Yogi Ferrell Stats: NBA Career

Introducing Yogi Ferrell: The Underrated Basketball Magician
Yogi Ferrell, a name that might not immediately resonate with every basketball fan, but one that holds a myriad of achievements and surprises for those willing to delve deeper into his career. With stints in the Brooklyn Nets, Dallas Mavericks, Sacramento Kings, Cleveland Cavaliers, and Los Angeles Clippers, Ferrell's journey has been a whirlwind tour across the basketball landscape of the United States.
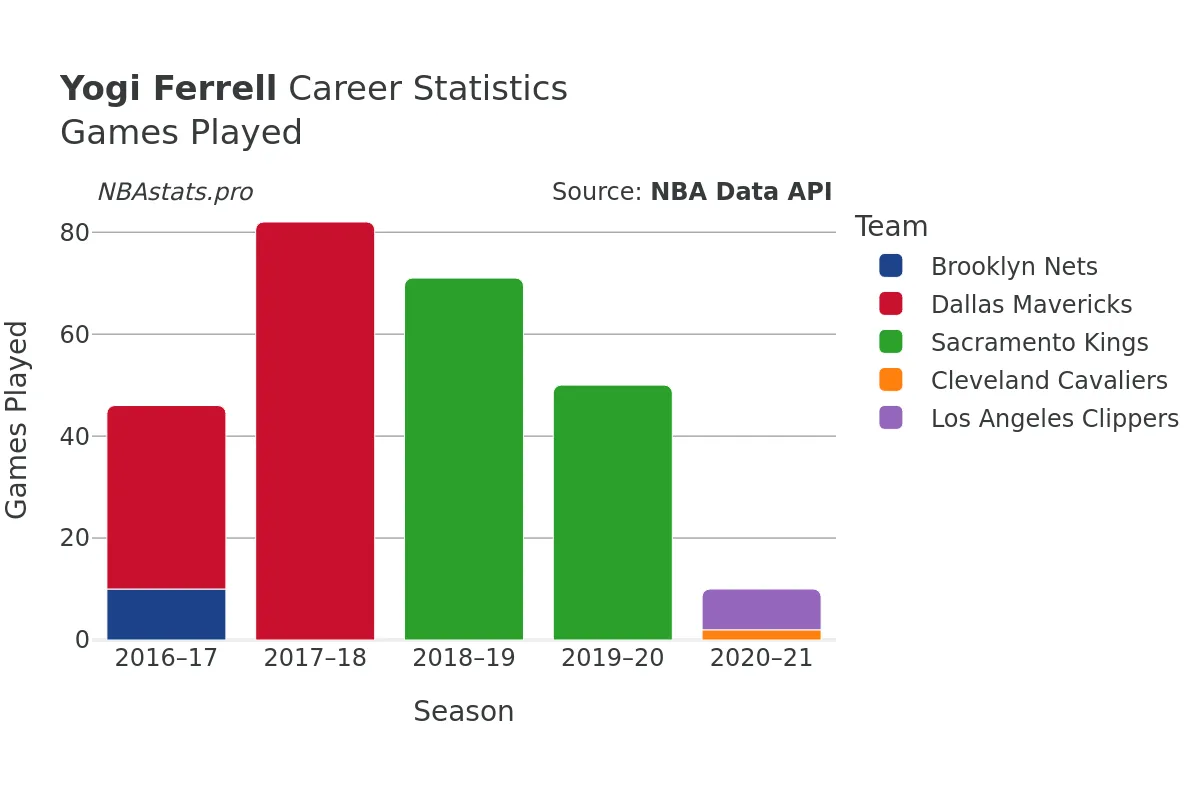
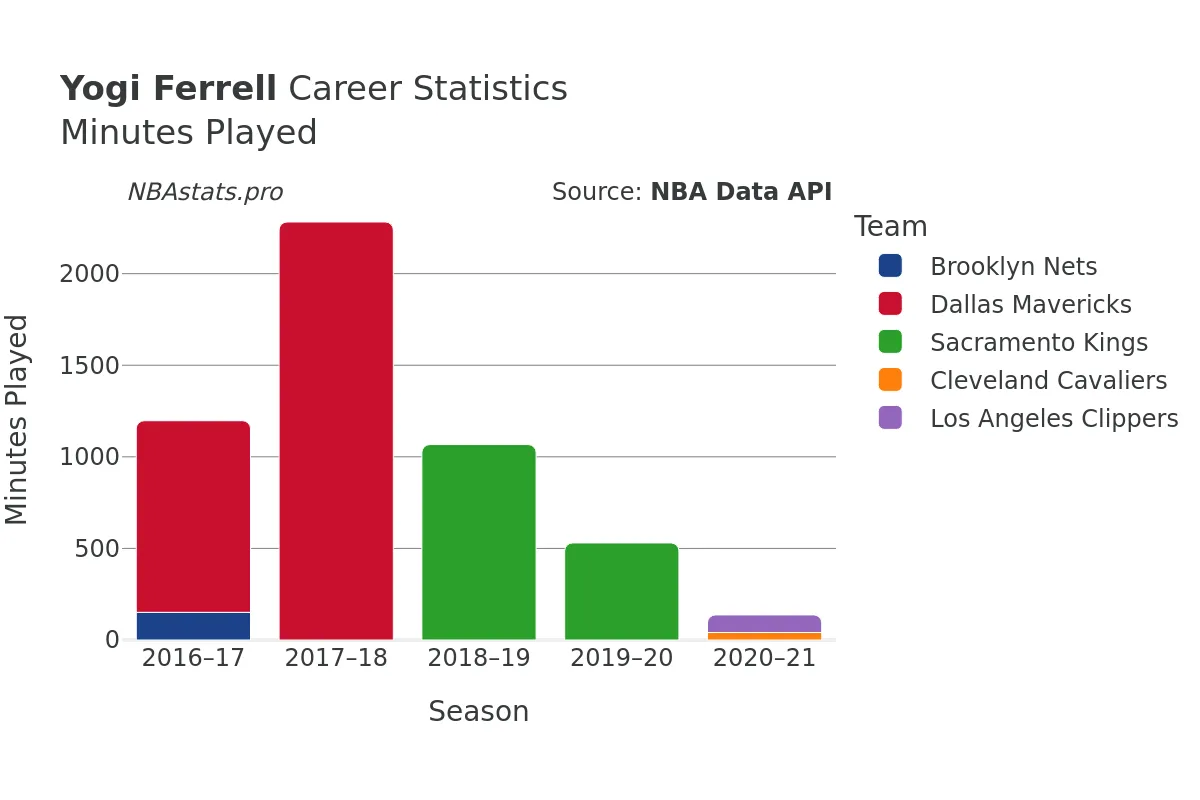
Ferrell first burst onto the ...NBA scene during the 2016-17 season, a relatively late start compared to some of his peers, at the age of 24. However, what he lacked in early exposure, he more than made up for with his skills on the court. Over the course of five active seasons, Ferrell showcased his talents through 315 games, accumulating an impressive 6547 minutes of playing time.
One of the most remarkable aspects of Ferrell's game is his shooting prowess. With 2172 field goals attempted and 903 made, he maintained a solid field goal percentage of approximately 41.6%. This efficiency, coupled with his ability to make an impact on both ends of the court, cemented Ferrell as a valuable asset to any team he joined.
Ferrell's free-throw shooting was equally impressive, with a sterling free throw percentage that remained consistently high throughout his career. This reliability in crucial moments only added to his value as a reliable and steady player under pressure.
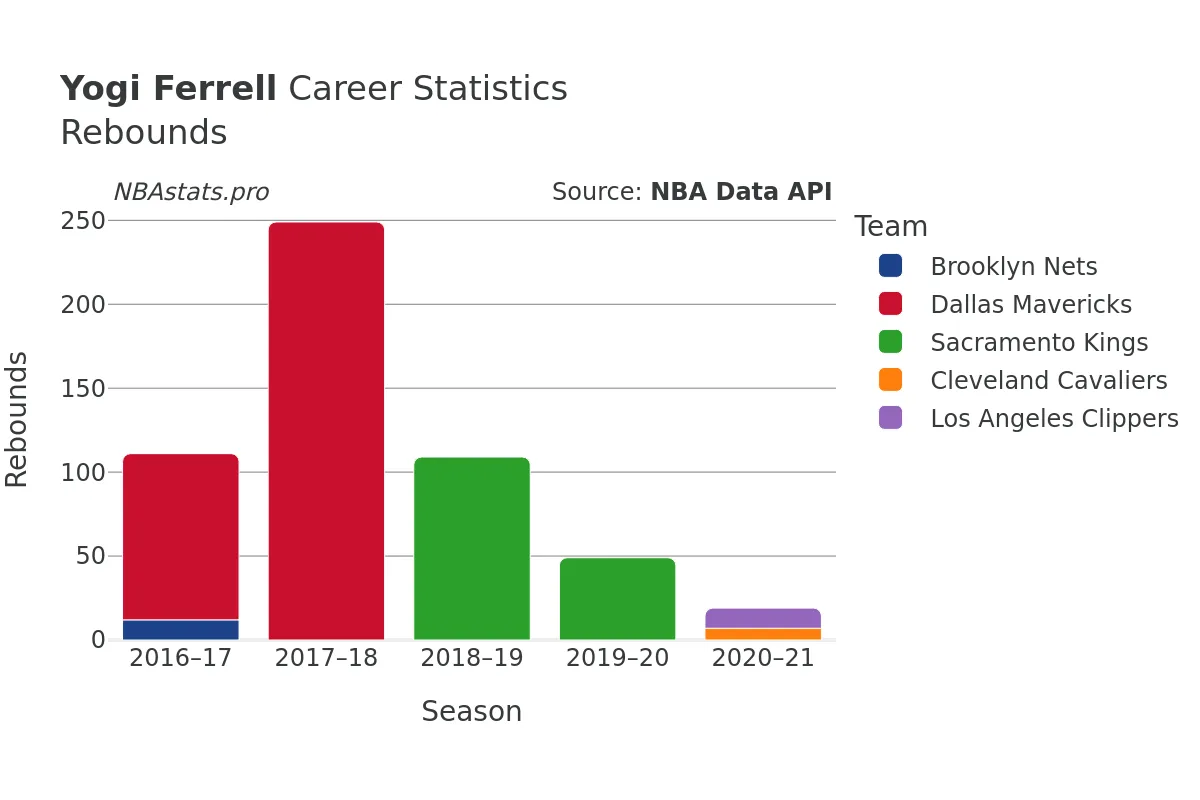
Rebounding is another area where Ferrell showcased his versatility. Amassing a total of 667 rebounds, with 572 on the defensive end and 95 on the offensive end, Ferrell proved that his contributions extended beyond scoring and distributing the ball. His willingness to battle in the paint and secure possession for his team set him apart as a well-rounded player.
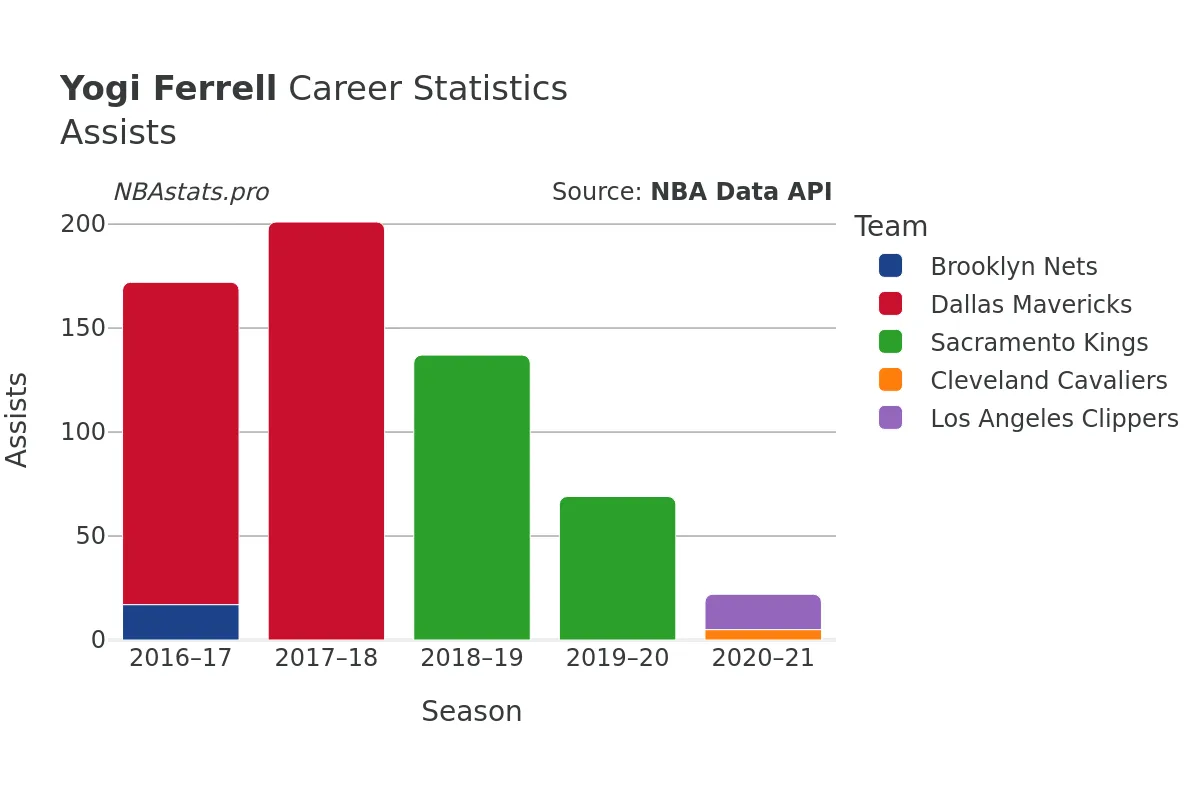
Speaking of distributing the ball, Ferrell's playmaking abilities shone through in his 795 career assists. Acting as a facilitator on the court, he consistently set up his teammates for scoring opportunities, showcasing his basketball IQ and court vision.
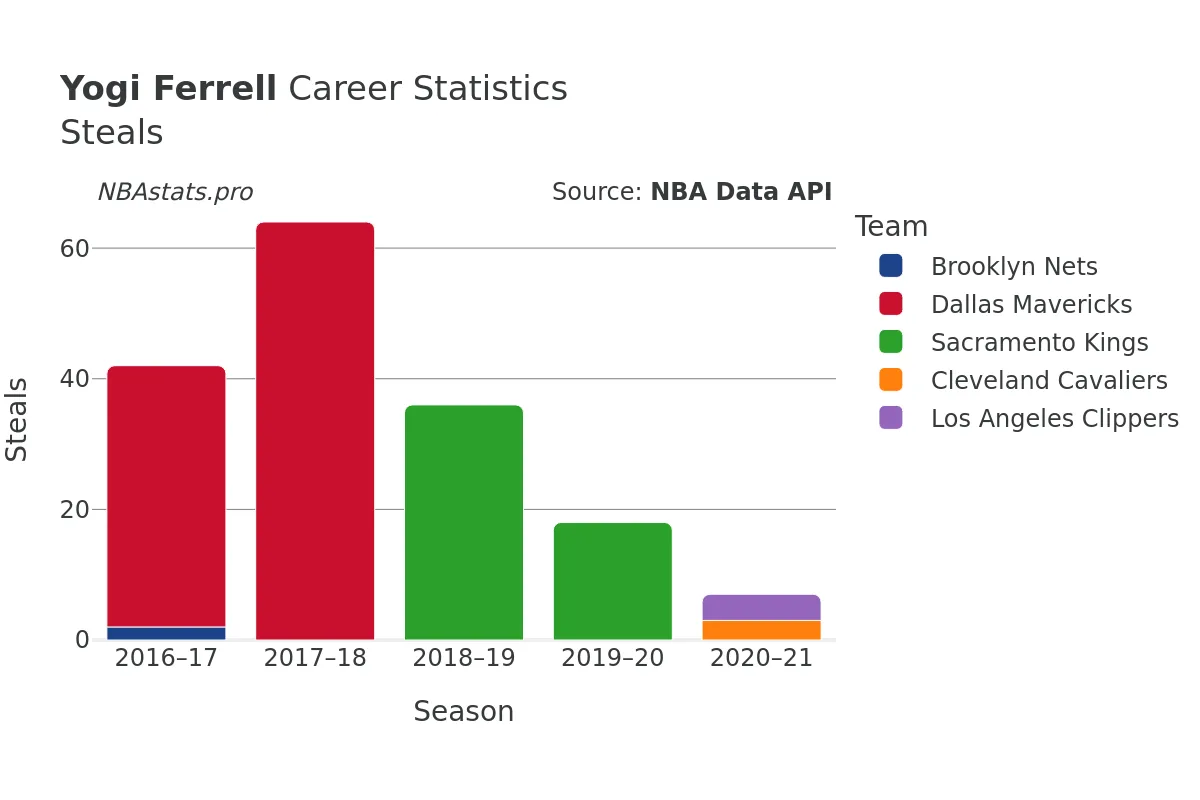
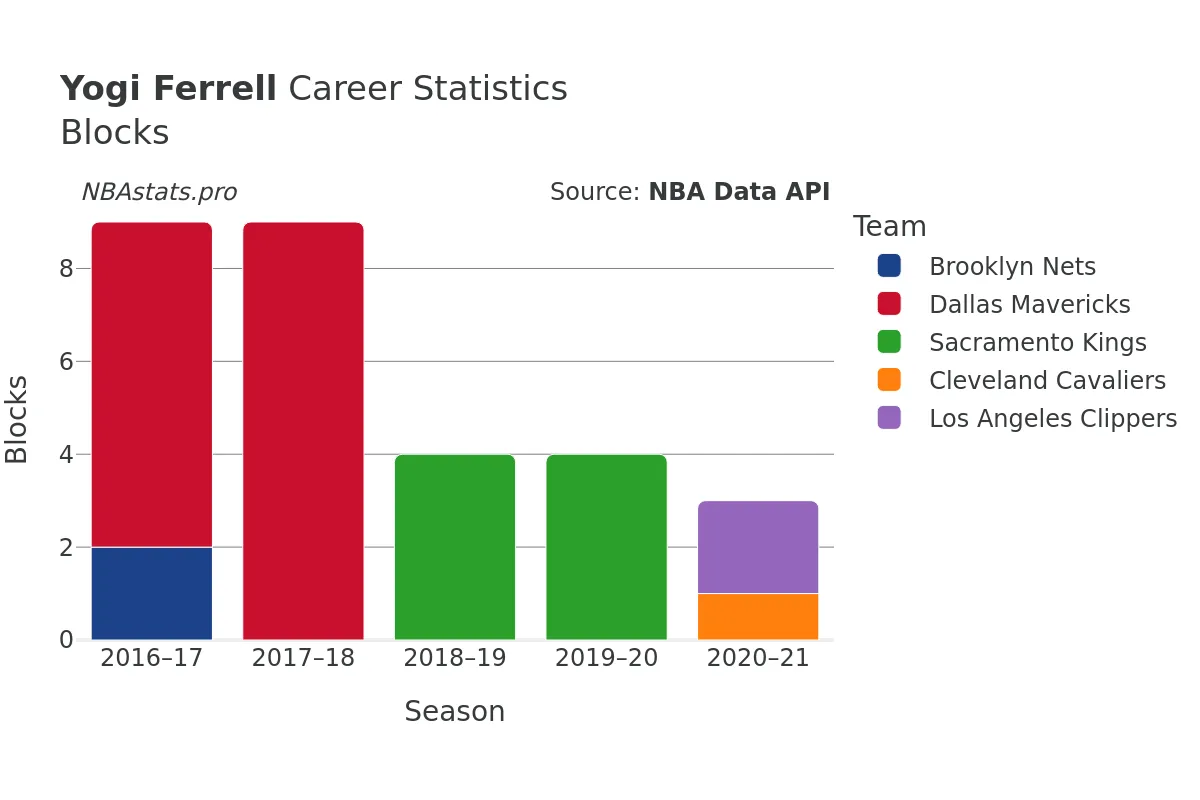
Defensively, Ferrell was no slouch either. With 216 steals and 41 blocks to his name, he made life difficult for his opponents and contributed to his team's overall defensive efforts. His tenacity and quick hands made him a formidable presence on the perimeter, always ready to capitalize on any misstep by the opposition.
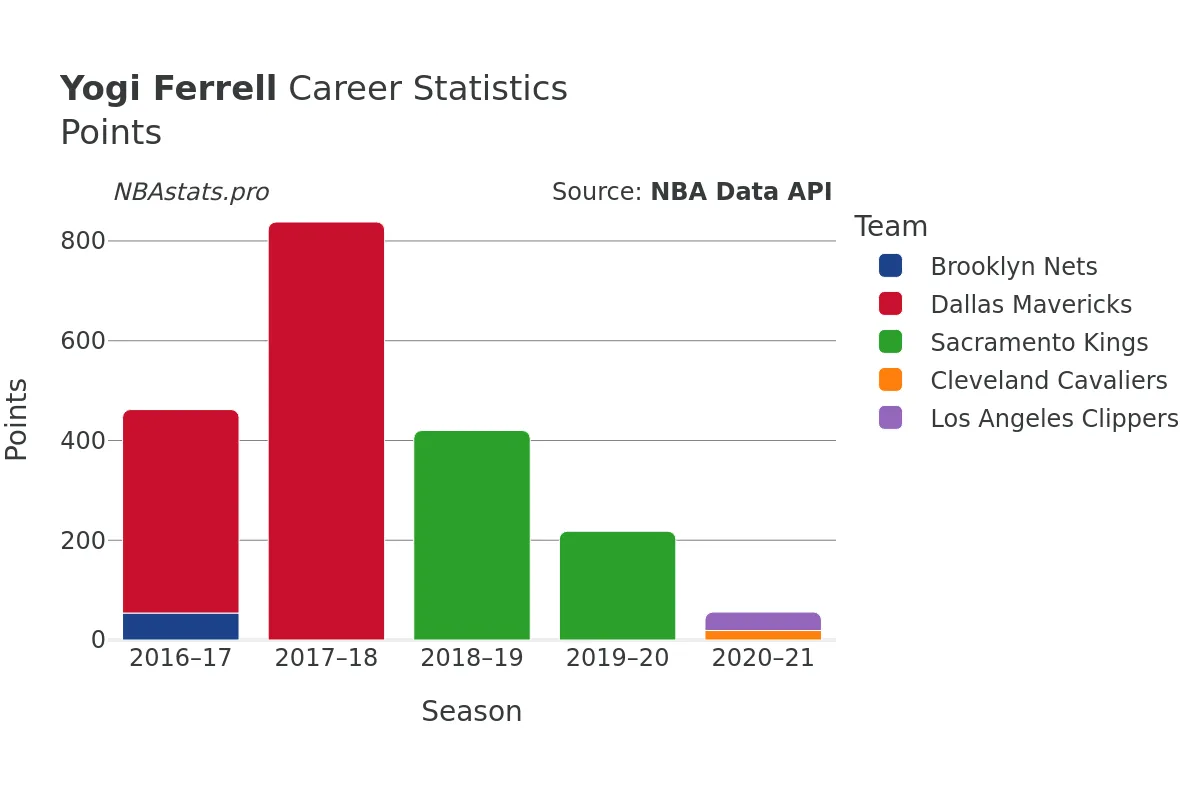
Not to be overlooked, Ferrell's scoring output of 2512 points is a testament to his ability to put the ball in the basket when his team needed it most. Whether driving to the hoop, pulling up for a mid-range jumper, or draining shots from beyond the arc, Ferrell had an arsenal of offensive weapons at his disposal.
As Ferrell's career transitioned from active play to a potential role in mentoring younger talents or exploring opportunities off the court, his impact on the teams and cities he represented remains a lasting legacy. From the bustling streets of Brooklyn to the Lone Star State of Texas, the sunny shores of California to the heart of Ohio, Ferrell left an indelible mark wherever he went.
For fans of the game looking to unravel the story of a player whose numbers speak volumes about his contributions on the court, Yogi Ferrell's journey is one worth exploring. Dive into the charts, analyze the stats, and discover the hidden gems that made Ferrell a player to remember in the annals of NBA basketball.
Read more
Games Played
Points
Assists
Rebounds
Steals
Minutes Played
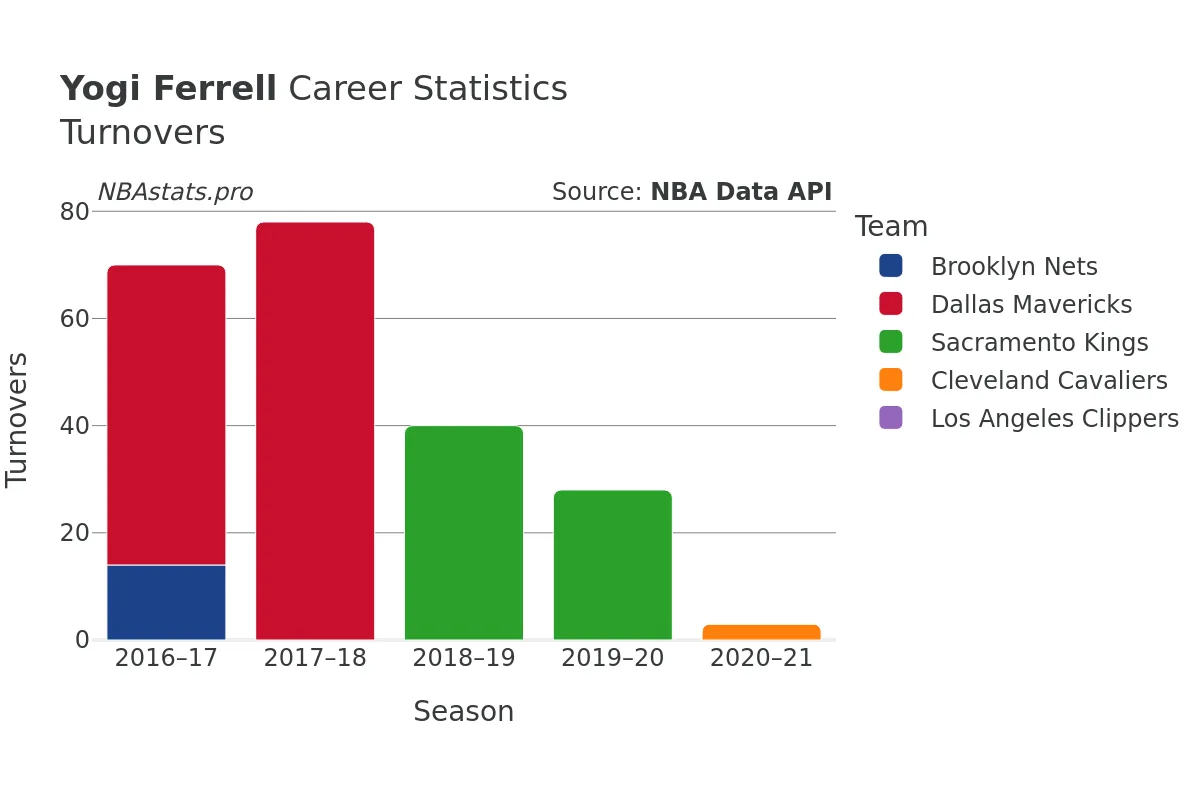
Turnovers
Blocks
Yogi Ferrell Career Stats Table
| SEASON | TEAM | AGE | GP | GS | MIN | FGM | FGA | FG % | FG3M | FG3A | FG3 % | FTM | FTA | FT % | OREB | DREB | REB | AST | STL | BLK | TOV | PF | PTS | |
|---|---|---|---|---|---|---|---|---|---|---|---|---|---|---|---|---|---|---|---|---|---|---|---|---|
| 1 | 2016-17 | BKN | 24 | 10 | 0 | 151 | 18 | 49 | 36.7% | 8 | 27 | 29.6% | 10 | 16 | 62.5% | 4 | 8 | 12 | 17 | 2 | 2 | 14 | 11 | 54 |
| 2 | 2016-17 | DAL | 24 | 36 | 29 | 1,046 | 142 | 345 | 41.2% | 60 | 149 | 40.3% | 64 | 73 | 87.7% | 16 | 83 | 99 | 155 | 40 | 7 | 56 | 79 | 408 |
| 3 | 2016-17 | TOT | 24 | 46 | 29 | 1,197 | 160 | 394 | 40.6% | 68 | 176 | 38.6% | 74 | 89 | 83.1% | 20 | 91 | 111 | 172 | 42 | 9 | 70 | 90 | 462 |
| 4 | 2017-18 | DAL | 25 | 82 | 21 | 2,282 | 311 | 730 | 42.6% | 134 | 359 | 37.3% | 82 | 103 | 79.6% | 26 | 223 | 249 | 201 | 64 | 9 | 78 | 153 | 838 |
| 5 | 2018-19 | SAC | 26 | 71 | 3 | 1,067 | 153 | 352 | 43.5% | 54 | 149 | 36.2% | 60 | 67 | 89.6% | 13 | 96 | 109 | 137 | 36 | 4 | 40 | 64 | 420 |
| 6 | 2019-20 | SAC | 27 | 50 | 0 | 530 | 79 | 188 | 42.0% | 24 | 79 | 30.4% | 36 | 42 | 85.7% | 6 | 43 | 49 | 69 | 18 | 4 | 28 | 38 | 218 |
| 7 | 2020-21 | CLE | 28 | 2 | 0 | 41 | 8 | 21 | 38.1% | 3 | 9 | 33.3% | 0 | 2 | 0.0% | 3 | 4 | 7 | 5 | 3 | 1 | 3 | 4 | 19 |
| 8 | 2020-21 | LAC | 28 | 8 | 0 | 96 | 12 | 36 | 33.3% | 6 | 19 | 31.6% | 7 | 7 | 100.0% | 2 | 10 | 12 | 17 | 4 | 2 | 0 | 7 | 37 |
| 9 | 2020-21 | TOT | 28 | 10 | 0 | 137 | 20 | 57 | 35.1% | 9 | 28 | 32.1% | 7 | 9 | 77.8% | 5 | 14 | 19 | 22 | 7 | 3 | 3 | 11 | 56 |
Max Min
NBA Alltime Leaders
Games Played
Robert Parish: 1,611Kareem Abdul-Jabbar: 1,560
Vince Carter: 1,541
Dirk Nowitzki: 1,522
John Stockton: 1,504
Points
LeBron James: 40,474Kareem Abdul-Jabbar: 38,387
Karl Malone: 36,928
Kobe Bryant: 33,643
Michael Jordan: 32,292
Steals
John Stockton: 3,265Jason Kidd: 2,684
Chris Paul: 2,614
Michael Jordan: 2,514
Gary Payton: 2,445
Free Throws Made
Karl Malone: 9,787Moses Malone: 8,531
LeBron James: 8,390
Kobe Bryant: 8,378
Oscar Robertson: 7,694