Vince Carter Stats: NBA Career

Vince Carter - The Ultimate NBA Journeyman
Throughout the course of his illustrious 22-year career in the NBA, Vince Carter has carved out a legacy that transcends generations. From his early days as a high-flying rookie with the Toronto Raptors to his veteran leadership role with the Atlanta Hawks, Carter has left an indelible mark on the league and the hearts of basketball fans worldwide.
Vince Carter, also known as "Vinsanity" or "Half-Man, Half-Amazing," began his NBA journey in the 1998-9...9 season, bursting onto the scene as a dynamic young talent out of the University of North Carolina. As the 5th overall pick in the 1998 NBA Draft, Carter wasted no time making an impact, averaging 18.3 points per game in his rookie year and earning the Rookie of the Year award.
Over the course of his career, Carter donned the jerseys of an impressive eight teams - the Toronto Raptors, Brooklyn Nets, Orlando Magic, Phoenix Suns, Dallas Mavericks, Memphis Grizzlies, Sacramento Kings, and Atlanta Hawks. From the hustle and bustle of Toronto to the sunny skies of Phoenix, Carter's journey took him to basketball cities across North America, each stop adding a new chapter to his storied career.
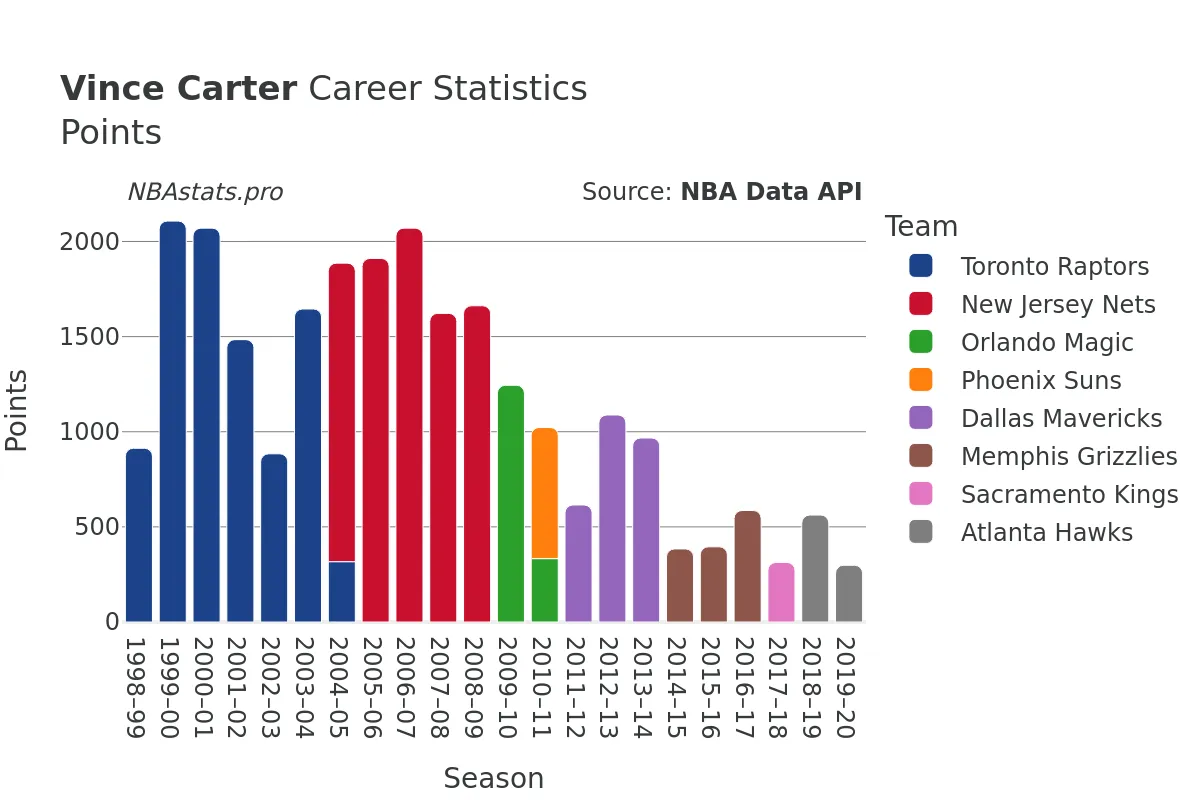
Carter's versatility and scoring prowess were evident in his impressive stats. With 28,636 career points, he ranks 19th on the all-time NBA scoring list. His smooth shooting touch resulted in 10,378 field goals made out of 23,771 attempts, showcasing his precision on the court with a shooting percentage of 43.66%. When it came to free throws, Carter was reliable under pressure, sinking 5,347 out of 6,715 attempts, boasting a respectable free-throw percentage.
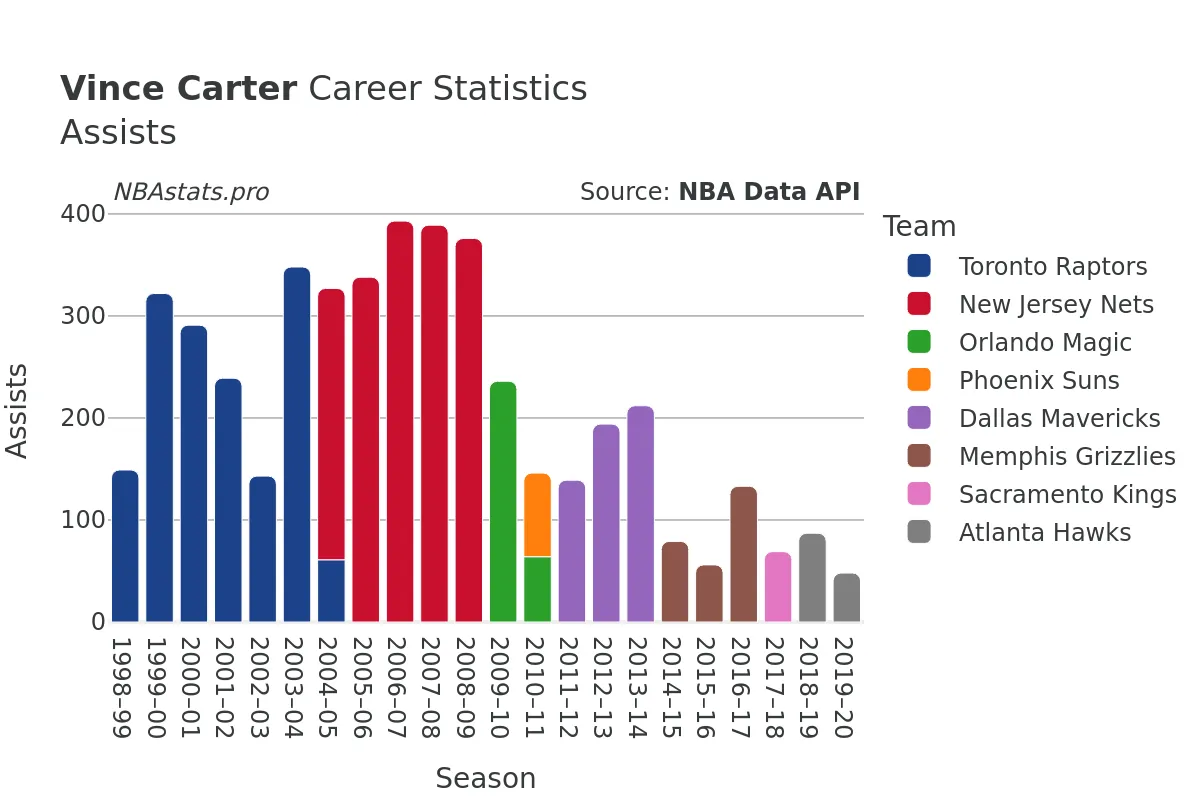
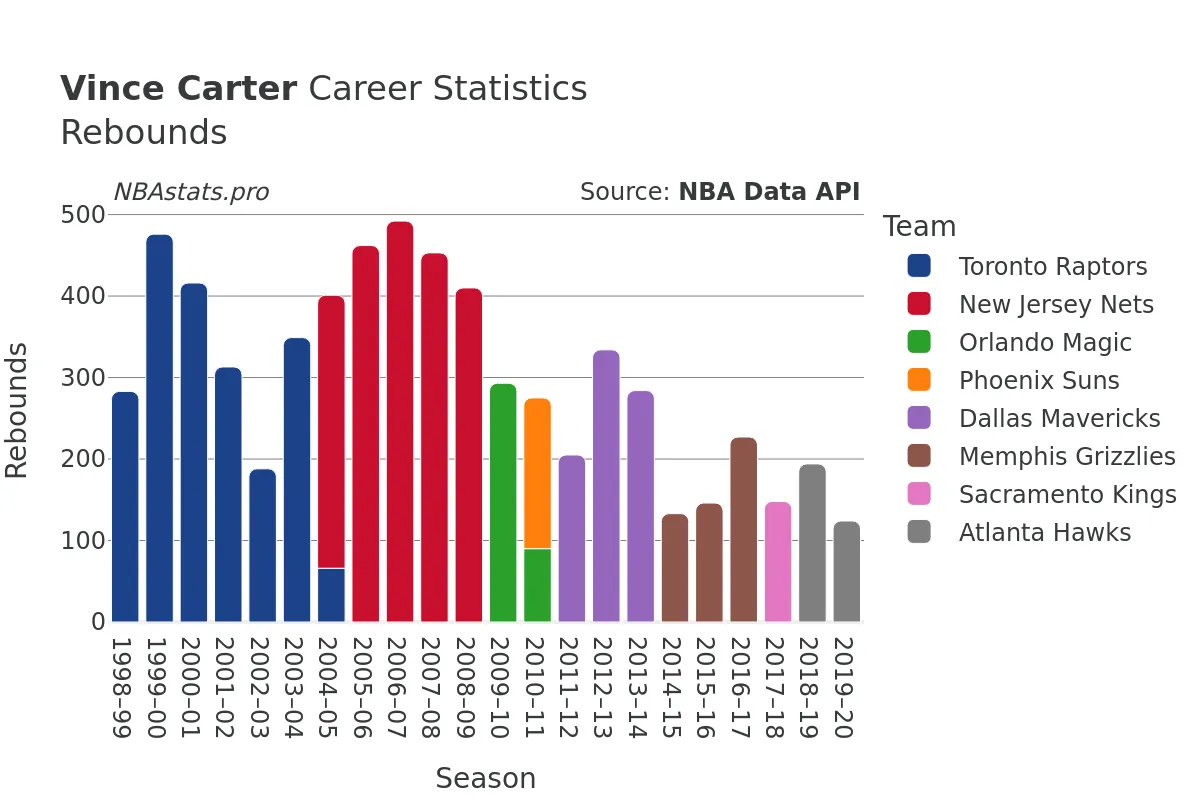
However, Carter wasn't just a scoring machine. His well-rounded game extended to rebounding, with a total of 7,282 rebounds throughout his career. His tenacity on the boards was highlighted by 5,464 defensive rebounds and 1,818 offensive rebounds, making him a threat on both ends of the court. Additionally, Carter proved to be an adept playmaker, dishing out 5,187 assists over the years, showcasing his basketball IQ and vision on the court.
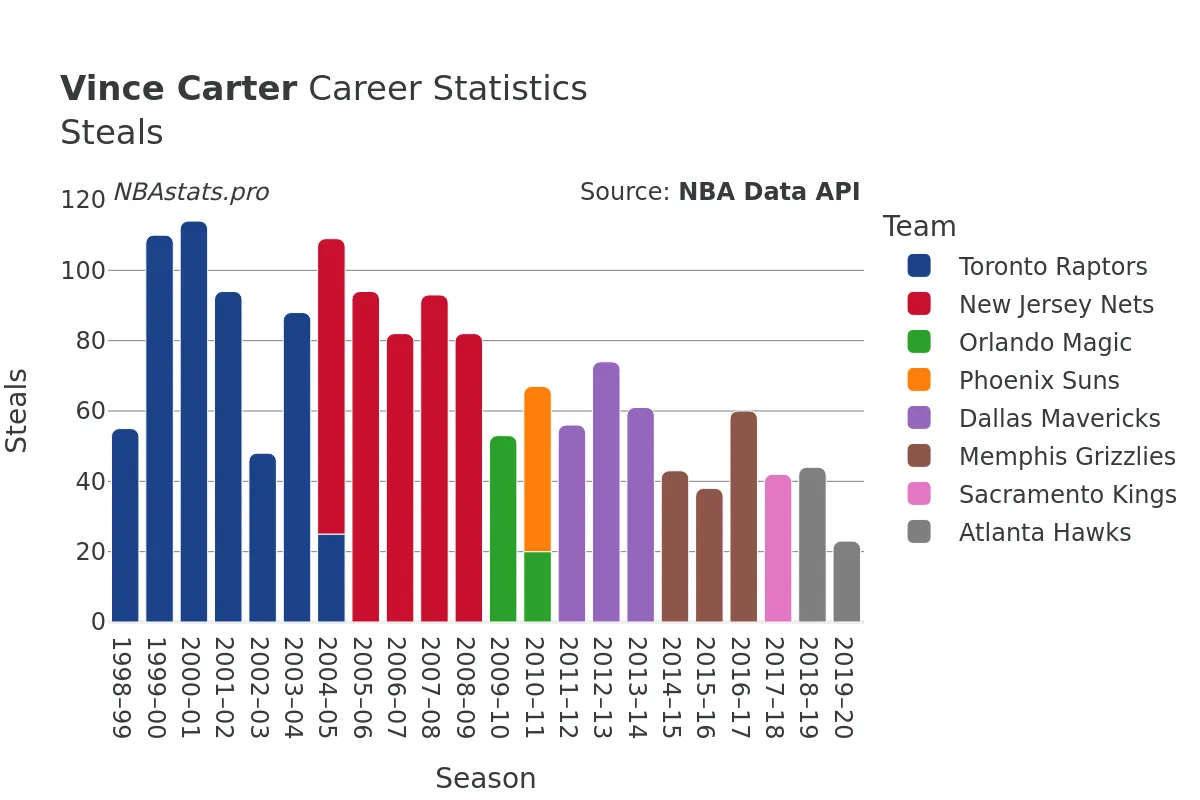
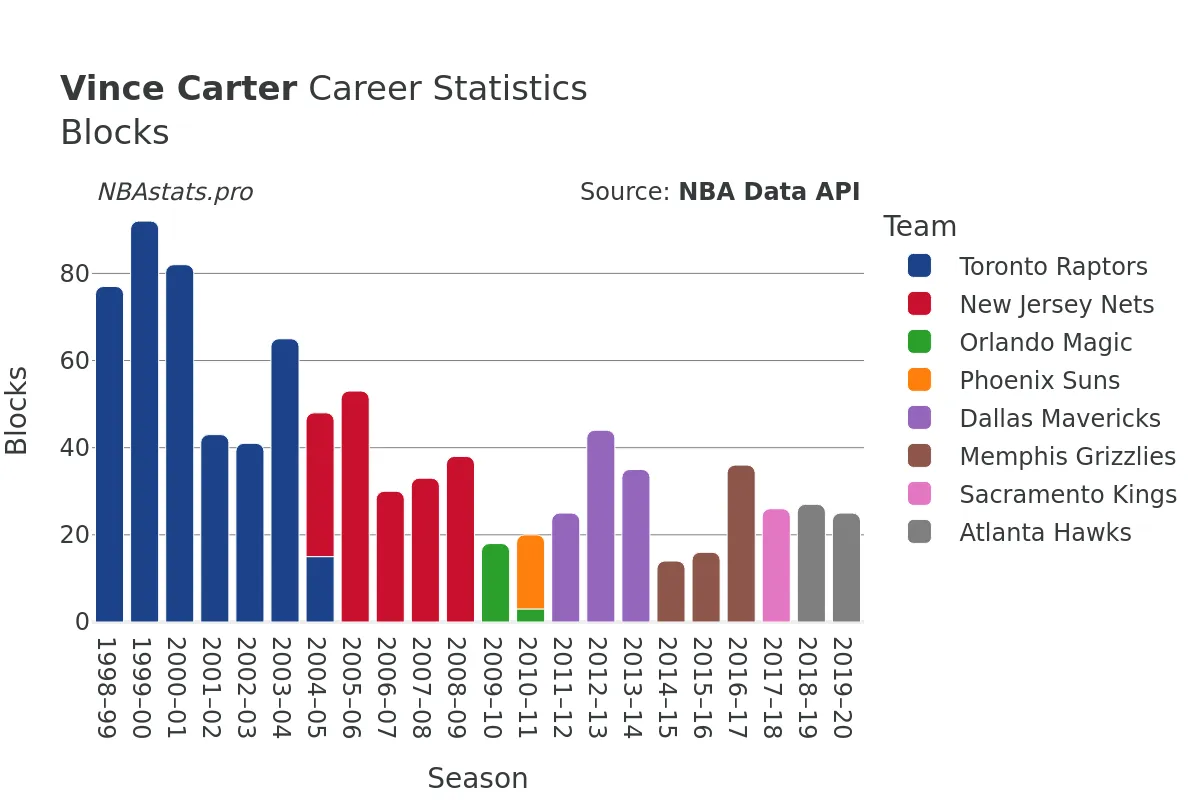
Defensively, Carter's impact was also felt. With 1,706 steals and 956 blocks, he showcased his ability to disrupt opponents and protect the rim when needed. His defensive acumen, coupled with his offensive prowess, made him a well-rounded player that opponents always had to game-plan for.
As Carter transitioned from a high-flying superstar to a seasoned veteran, his leadership and basketball IQ became invaluable assets to the teams he played for. Embracing his role as a mentor to younger players, Carter's impact went beyond the stat sheet, leaving a lasting impression on teammates and fans alike.
Vince Carter's influence on the game of basketball is undeniable. His longevity, skillset, and passion for the game have cemented his status as a future Hall of Famer and a true ambassador for the sport. As fans, we were fortunate to witness the evolution of a player who not only defied gravity but also defied Father Time, inspiring a new generation of basketball players to dream big and never give up on their goals.
For a deeper dive into Vince Carter's remarkable career, explore the stats and charts below to uncover the numbers behind the legend and gain a greater appreciation for the impact he had on the game we love.
Read more
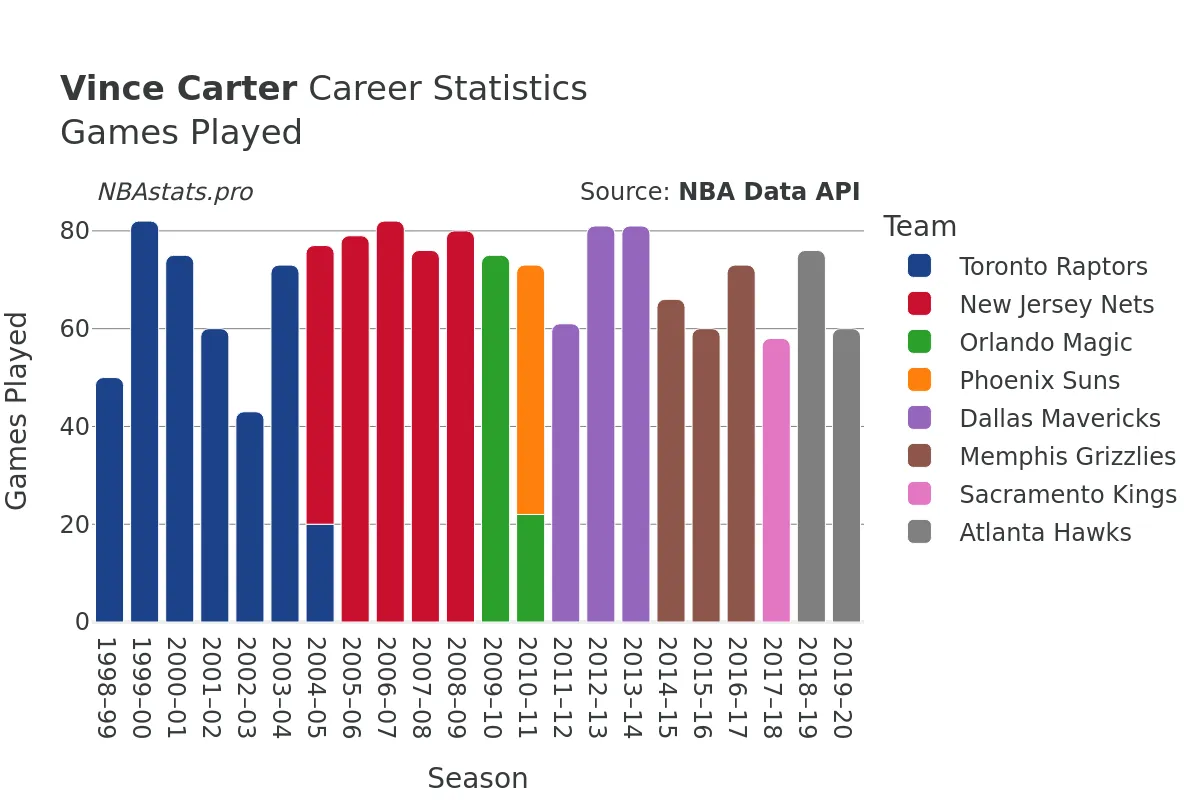
Games Played
Points
Assists
Rebounds
Steals
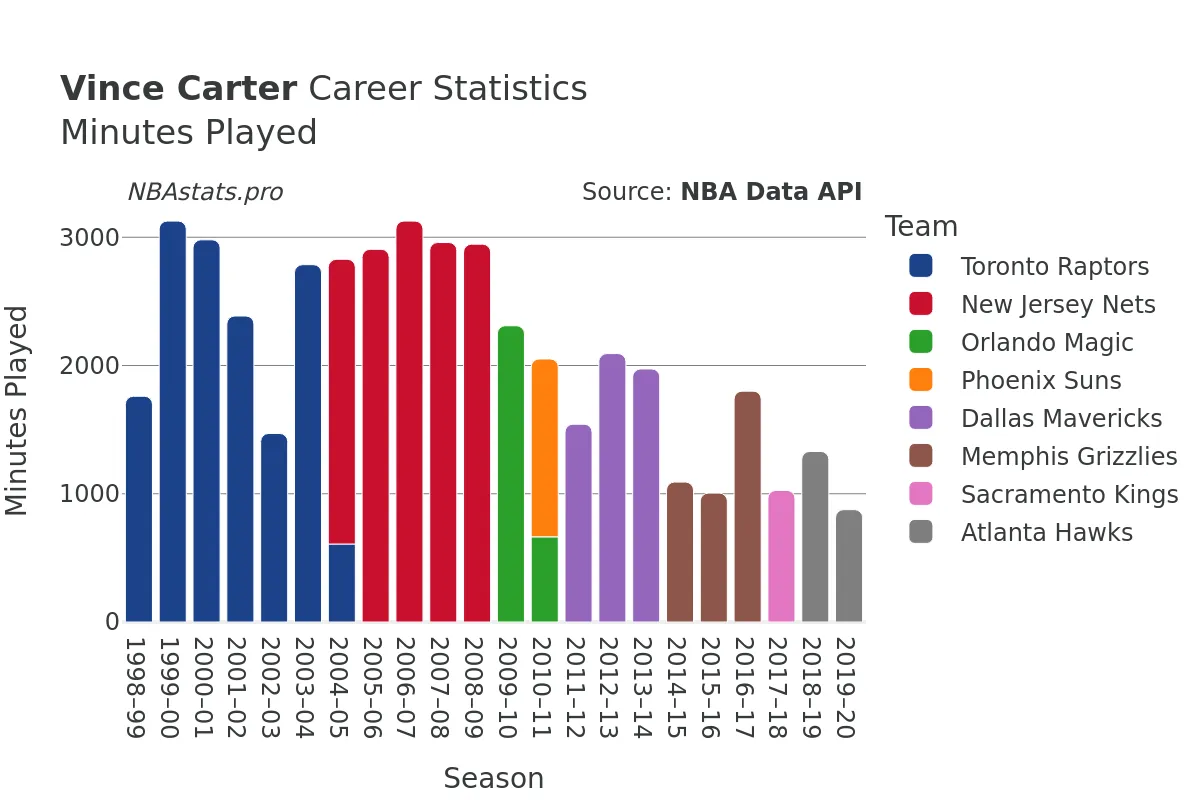
Minutes Played
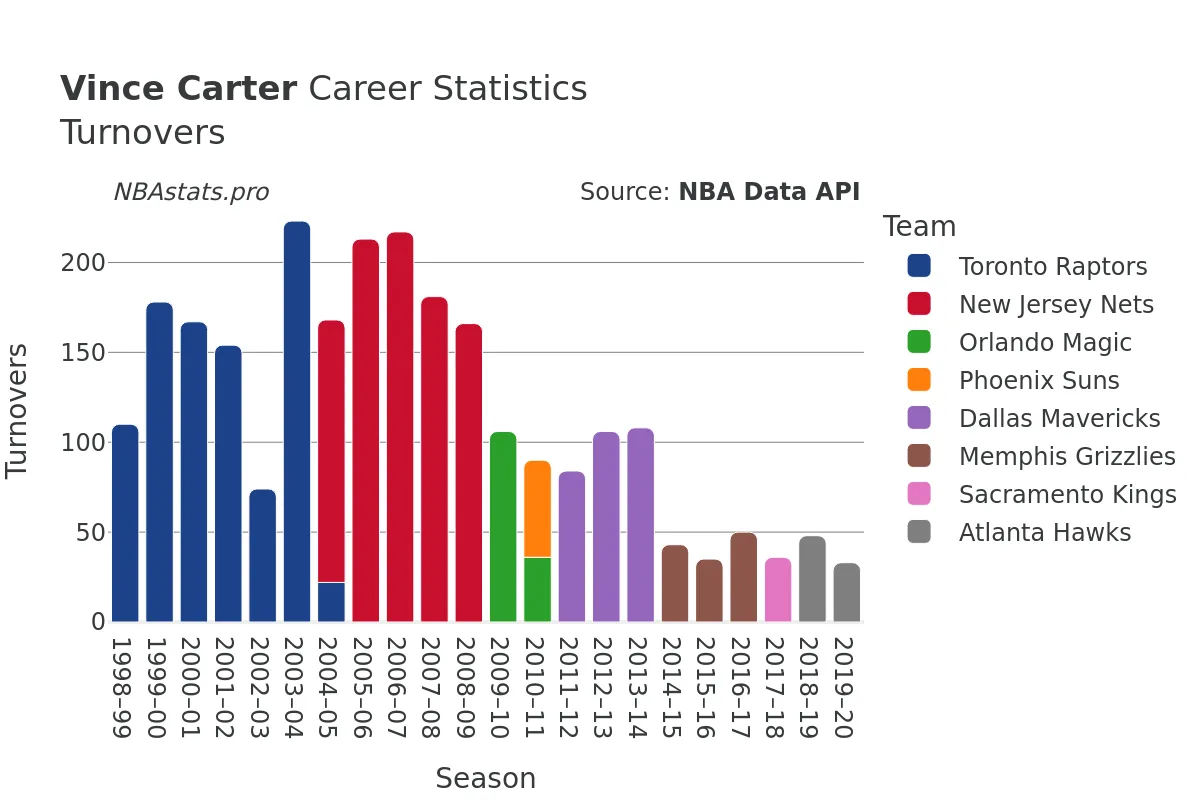
Turnovers
Blocks
Vince Carter Career Stats Table
| SEASON | TEAM | AGE | GP | GS | MIN | FGM | FGA | FG % | FG3M | FG3A | FG3 % | FTM | FTA | FT % | OREB | DREB | REB | AST | STL | BLK | TOV | PF | PTS | |
|---|---|---|---|---|---|---|---|---|---|---|---|---|---|---|---|---|---|---|---|---|---|---|---|---|
| 1 | 1998-99 | TOR | 22 | 50 | 49 | 1,760 | 345 | 766 | 45.0% | 19 | 66 | 28.8% | 204 | 268 | 76.1% | 94 | 189 | 283 | 149 | 55 | 77 | 110 | 140 | 913 |
| 2 | 1999-00 | TOR | 23 | 82 | 82 | 3,126 | 788 | 1,696 | 46.5% | 95 | 236 | 40.3% | 436 | 551 | 79.1% | 150 | 326 | 476 | 322 | 110 | 92 | 178 | 263 | 2,107 |
| 3 | 2000-01 | TOR | 24 | 75 | 75 | 2,980 | 762 | 1,656 | 46.0% | 162 | 397 | 40.8% | 384 | 502 | 76.5% | 176 | 240 | 416 | 291 | 114 | 82 | 167 | 205 | 2,070 |
| 4 | 2001-02 | TOR | 25 | 60 | 60 | 2,386 | 559 | 1,307 | 42.8% | 121 | 313 | 38.7% | 245 | 307 | 79.8% | 138 | 175 | 313 | 239 | 94 | 43 | 154 | 191 | 1,484 |
| 5 | 2002-03 | TOR | 26 | 43 | 42 | 1,470 | 355 | 760 | 46.7% | 45 | 131 | 34.4% | 129 | 160 | 80.6% | 59 | 129 | 188 | 143 | 48 | 41 | 74 | 121 | 884 |
| 6 | 2003-04 | TOR | 27 | 73 | 73 | 2,786 | 608 | 1,457 | 41.7% | 93 | 243 | 38.3% | 336 | 417 | 80.6% | 95 | 254 | 349 | 348 | 88 | 65 | 223 | 212 | 1,645 |
| 7 | 2004-05 | TOR | 28 | 20 | 20 | 608 | 124 | 302 | 41.1% | 19 | 59 | 32.2% | 50 | 72 | 69.4% | 28 | 38 | 66 | 61 | 25 | 15 | 22 | 56 | 317 |
| 8 | 2004-05 | NJN | 28 | 57 | 56 | 2,220 | 572 | 1,239 | 46.2% | 108 | 254 | 42.5% | 317 | 388 | 81.7% | 78 | 257 | 335 | 266 | 84 | 33 | 146 | 187 | 1,569 |
| 9 | 2004-05 | TOT | 28 | 77 | 76 | 2,828 | 696 | 1,541 | 45.2% | 127 | 313 | 40.6% | 367 | 460 | 79.8% | 106 | 295 | 401 | 327 | 109 | 48 | 168 | 243 | 1,886 |
| 10 | 2005-06 | NJN | 29 | 79 | 79 | 2,906 | 653 | 1,518 | 43.0% | 125 | 367 | 34.1% | 480 | 601 | 79.9% | 135 | 327 | 462 | 338 | 94 | 53 | 213 | 235 | 1,911 |
| 11 | 2006-07 | NJN | 30 | 82 | 82 | 3,126 | 726 | 1,598 | 45.4% | 156 | 437 | 35.7% | 462 | 576 | 80.2% | 114 | 378 | 492 | 393 | 82 | 30 | 217 | 266 | 2,070 |
| 12 | 2007-08 | NJN | 31 | 76 | 72 | 2,959 | 587 | 1,287 | 45.6% | 98 | 273 | 35.9% | 350 | 429 | 81.6% | 112 | 341 | 453 | 389 | 93 | 33 | 181 | 241 | 1,622 |
| 13 | 2008-09 | NJN | 32 | 80 | 80 | 2,946 | 588 | 1,345 | 43.7% | 151 | 392 | 38.5% | 335 | 410 | 81.7% | 74 | 336 | 410 | 376 | 82 | 38 | 166 | 234 | 1,662 |
| 14 | 2009-10 | ORL | 33 | 75 | 74 | 2,310 | 434 | 1,015 | 42.8% | 119 | 324 | 36.7% | 257 | 306 | 84.0% | 33 | 260 | 293 | 236 | 53 | 18 | 106 | 189 | 1,244 |
| 15 | 2010-11 | ORL | 34 | 22 | 22 | 664 | 125 | 266 | 47.0% | 27 | 78 | 34.6% | 56 | 75 | 74.7% | 11 | 79 | 90 | 64 | 20 | 3 | 36 | 70 | 333 |
| 16 | 2010-11 | PHX | 34 | 51 | 41 | 1,387 | 264 | 625 | 42.2% | 89 | 243 | 36.6% | 72 | 98 | 73.5% | 43 | 142 | 185 | 82 | 47 | 17 | 54 | 123 | 689 |
| 17 | 2010-11 | TOT | 34 | 73 | 63 | 2,052 | 389 | 891 | 43.7% | 116 | 321 | 36.1% | 128 | 173 | 74.0% | 54 | 221 | 275 | 146 | 67 | 20 | 90 | 193 | 1,022 |
| 18 | 2011-12 | DAL | 35 | 61 | 40 | 1,542 | 223 | 542 | 41.1% | 74 | 205 | 36.1% | 95 | 115 | 82.6% | 32 | 173 | 205 | 139 | 56 | 25 | 84 | 134 | 615 |
| 19 | 2012-13 | DAL | 36 | 81 | 3 | 2,093 | 372 | 855 | 43.5% | 162 | 399 | 40.6% | 182 | 223 | 81.6% | 58 | 276 | 334 | 194 | 74 | 44 | 106 | 226 | 1,088 |
| 20 | 2013-14 | DAL | 37 | 81 | 0 | 1,973 | 330 | 811 | 40.7% | 146 | 371 | 39.4% | 161 | 196 | 82.1% | 67 | 217 | 284 | 212 | 61 | 35 | 108 | 209 | 967 |
| 21 | 2014-15 | MEM | 38 | 66 | 1 | 1,091 | 135 | 406 | 33.3% | 69 | 232 | 29.7% | 45 | 57 | 78.9% | 27 | 106 | 133 | 79 | 43 | 14 | 43 | 102 | 384 |
| 22 | 2015-16 | MEM | 39 | 60 | 3 | 1,005 | 133 | 343 | 38.8% | 59 | 169 | 34.9% | 70 | 84 | 83.3% | 31 | 115 | 146 | 56 | 38 | 16 | 35 | 101 | 395 |
| 23 | 2016-17 | MEM | 40 | 73 | 15 | 1,800 | 193 | 490 | 39.4% | 112 | 296 | 37.8% | 88 | 115 | 76.5% | 36 | 191 | 227 | 133 | 60 | 36 | 50 | 163 | 586 |
| 24 | 2017-18 | SAC | 41 | 58 | 4 | 1,026 | 114 | 283 | 40.3% | 57 | 165 | 34.5% | 28 | 37 | 75.7% | 18 | 130 | 148 | 69 | 42 | 26 | 36 | 96 | 313 |
| 25 | 2018-19 | ATL | 42 | 76 | 9 | 1,330 | 196 | 468 | 41.9% | 123 | 316 | 38.9% | 47 | 66 | 71.2% | 31 | 163 | 194 | 87 | 44 | 27 | 48 | 141 | 562 |
| 26 | 2019-20 | ATL | 43 | 60 | 0 | 876 | 107 | 304 | 35.2% | 61 | 202 | 30.2% | 23 | 29 | 79.3% | 18 | 106 | 124 | 48 | 23 | 25 | 33 | 90 | 298 |
Max Min
NBA Alltime Leaders
Games Played
Robert Parish: 1,611Kareem Abdul-Jabbar: 1,560
Vince Carter: 1,541
Dirk Nowitzki: 1,522
John Stockton: 1,504
Points
LeBron James: 40,474Kareem Abdul-Jabbar: 38,387
Karl Malone: 36,928
Kobe Bryant: 33,643
Michael Jordan: 32,292
Steals
John Stockton: 3,265Jason Kidd: 2,684
Chris Paul: 2,614
Michael Jordan: 2,514
Gary Payton: 2,445
Free Throws Made
Karl Malone: 9,787Moses Malone: 8,531
LeBron James: 8,390
Kobe Bryant: 8,378
Oscar Robertson: 7,694