Chris Paul Stats: NBA Career

Welcome to the profile page of NBA superstar, Chris Paul! With a career spanning over two decades, Paul has showcased his exceptional skills and leadership on various teams across the league. Let's delve into the numbers and stats that define the illustrious career of this basketball maestro.
Chris Paul, known for his tenacity and court vision, began his NBA journey during the 2005-06 season with the New Orleans Pelicans. From there, he went on to play for the Los Angeles Clippers, Houston Rock...ets, Oklahoma City Thunder, Phoenix Suns, and most recently, the Golden State Warriors. His impact has been felt in cities across the United States, from New Orleans to California, Texas, Oklahoma, and Arizona.
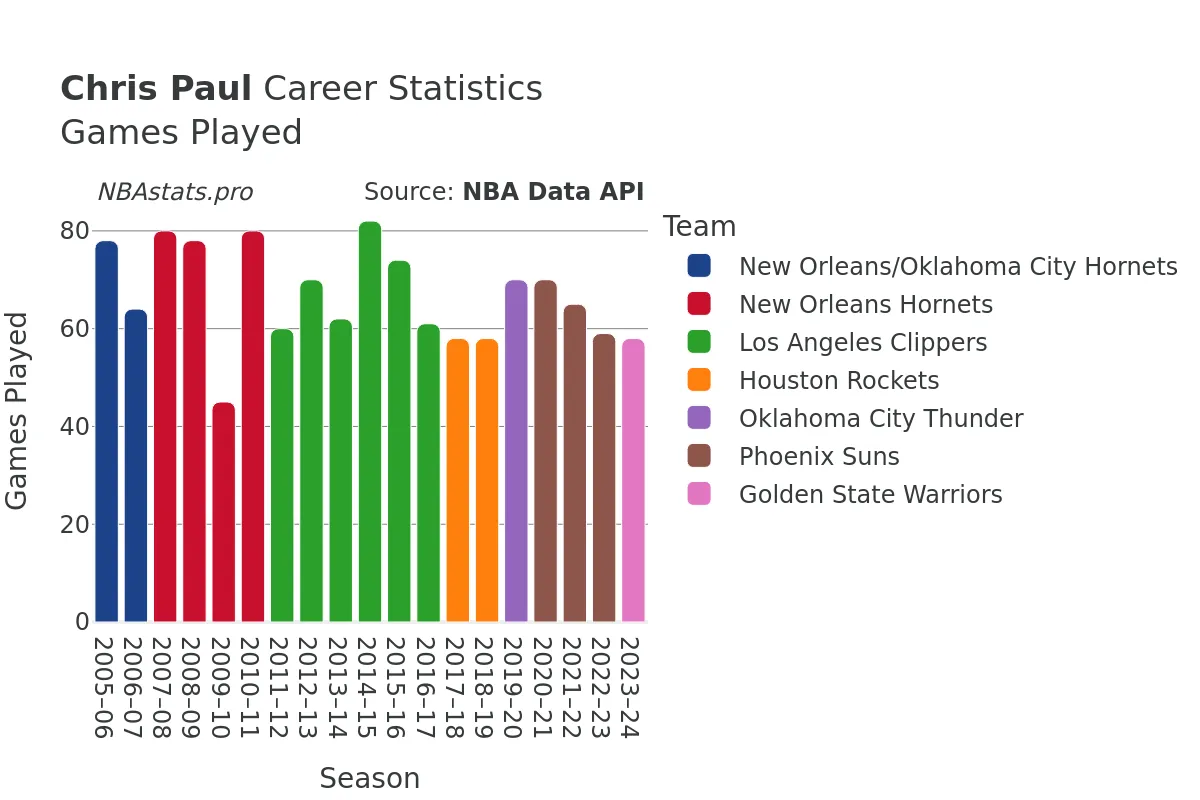
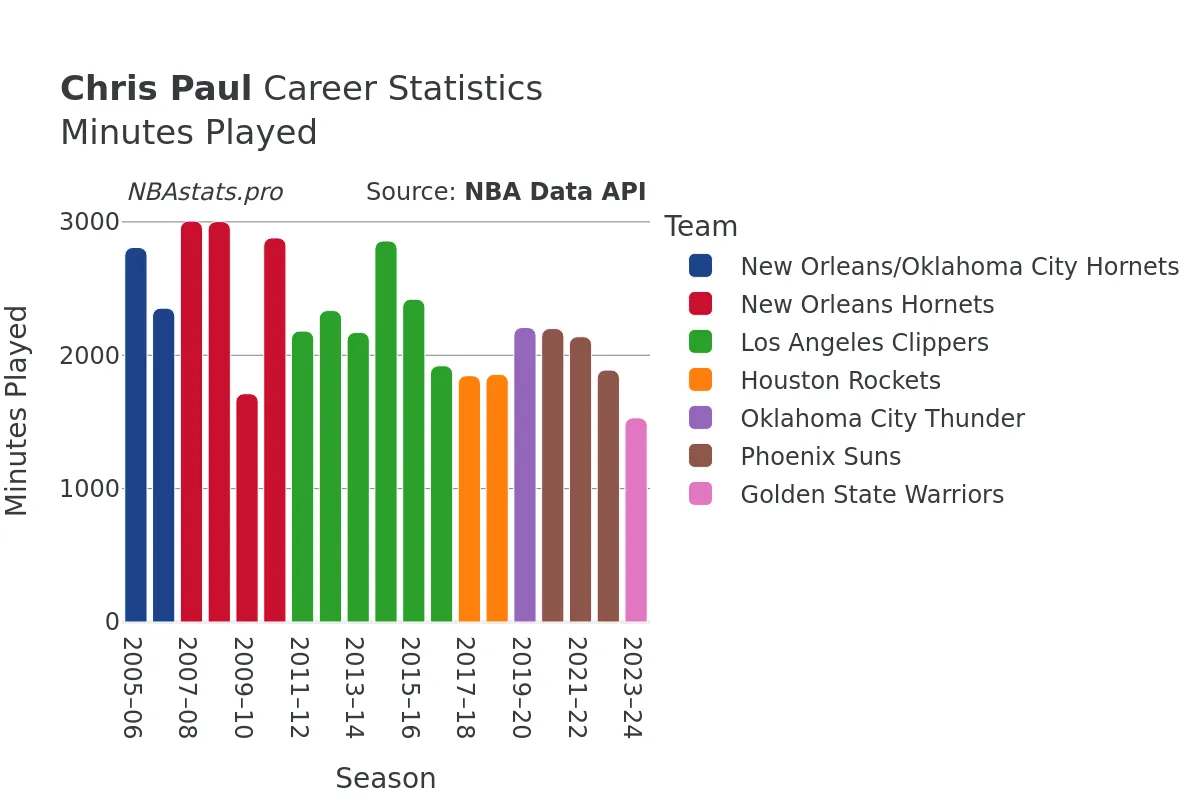
As one of the most consistent and efficient players in the league, Paul has amassed an impressive stat sheet over the years. With 1272 games under his belt, he has spent a total of 43317 minutes on the court, showcasing his enduring endurance and commitment to the game. A true marksman, Paul has attempted 16769 goals, making 7898 of them at an impressive shooting percentage of 47.1%.
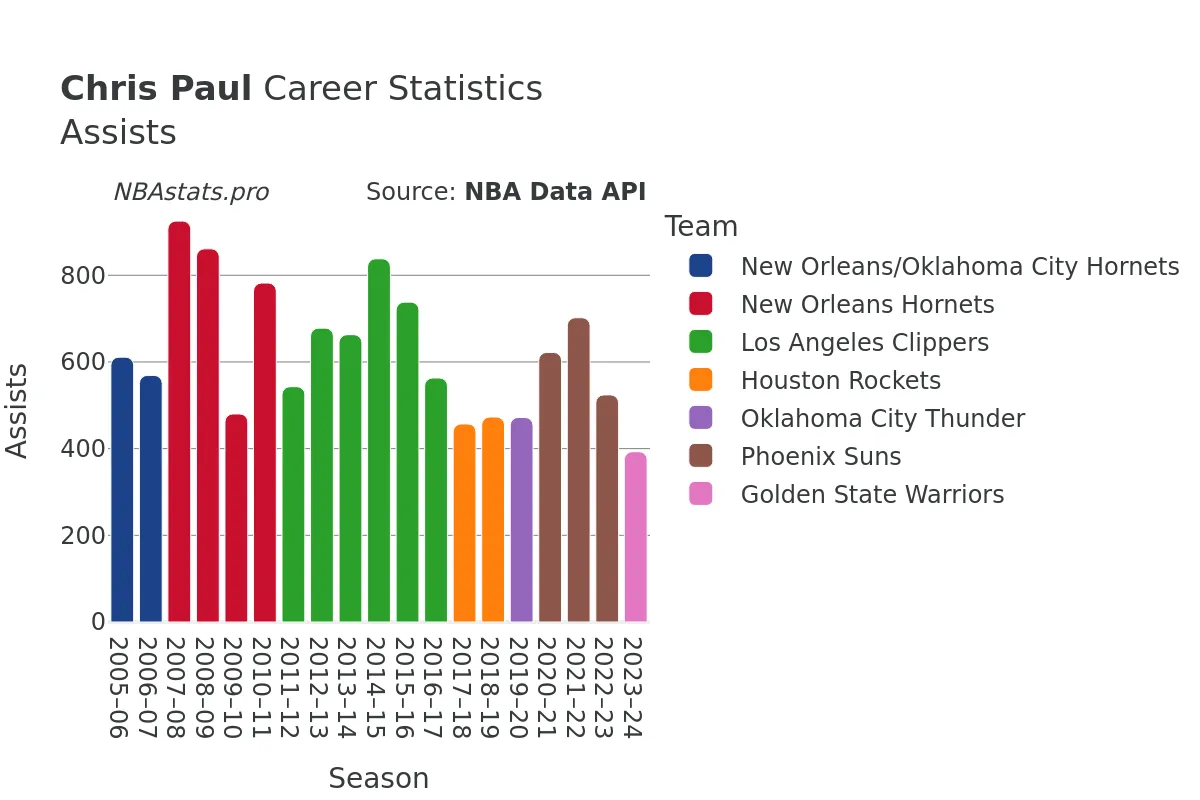
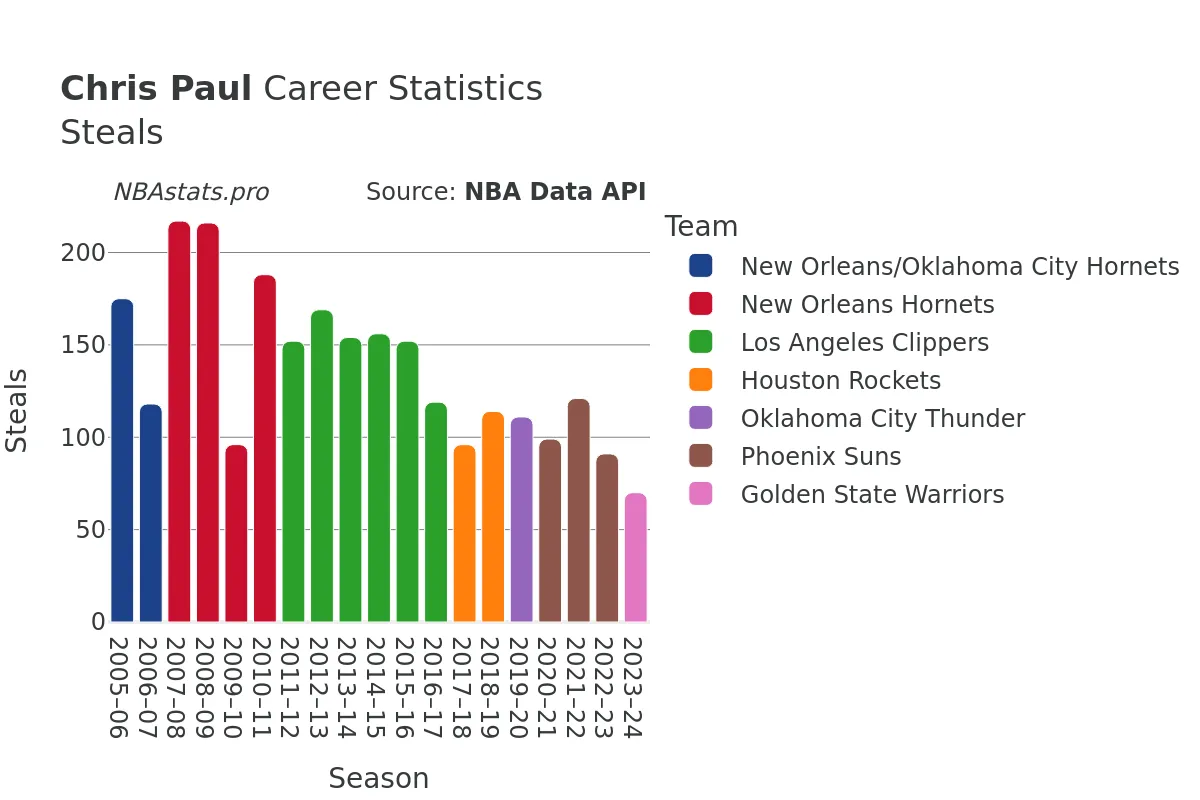
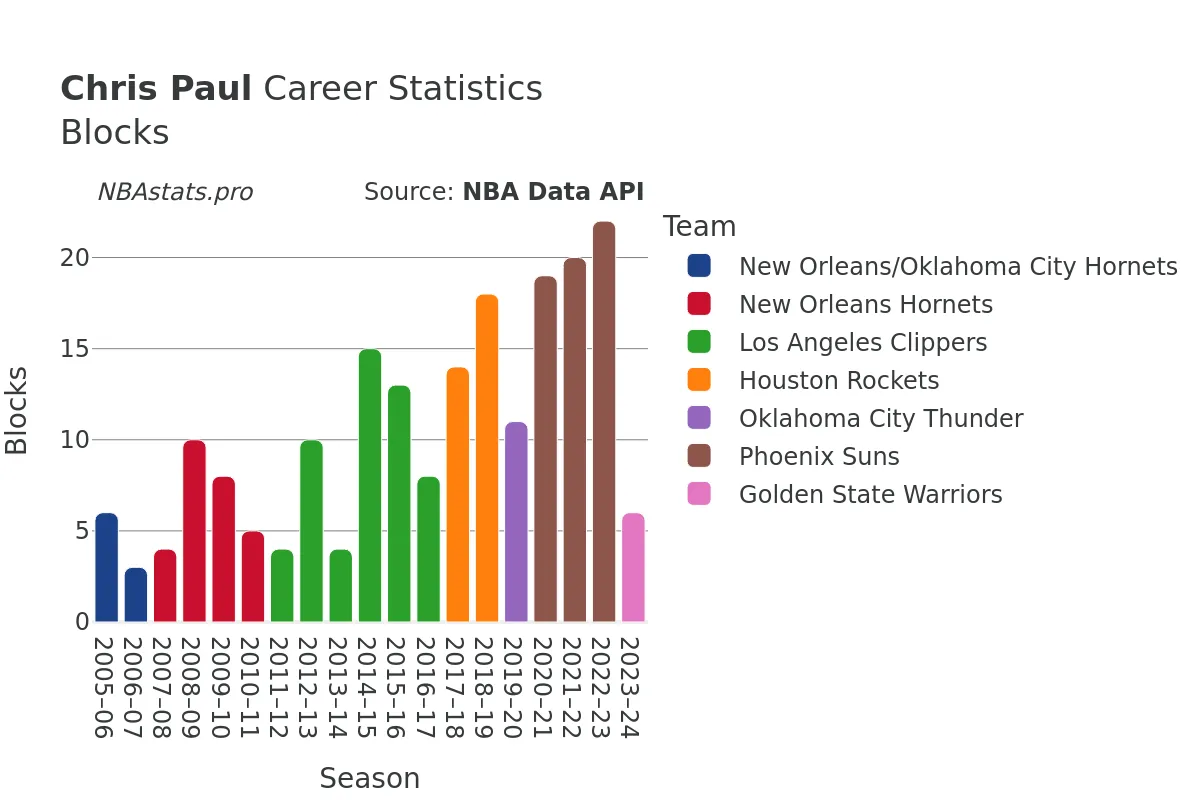
Paul's prowess extends beyond scoring, as evidenced by his remarkable passing ability. With 11894 assists to his name, he has cemented his status as one of the league's premier playmakers. Additionally, his defensive presence is felt with 2614 steals and 200 blocks, highlighting his well-rounded skill set on both ends of the floor.
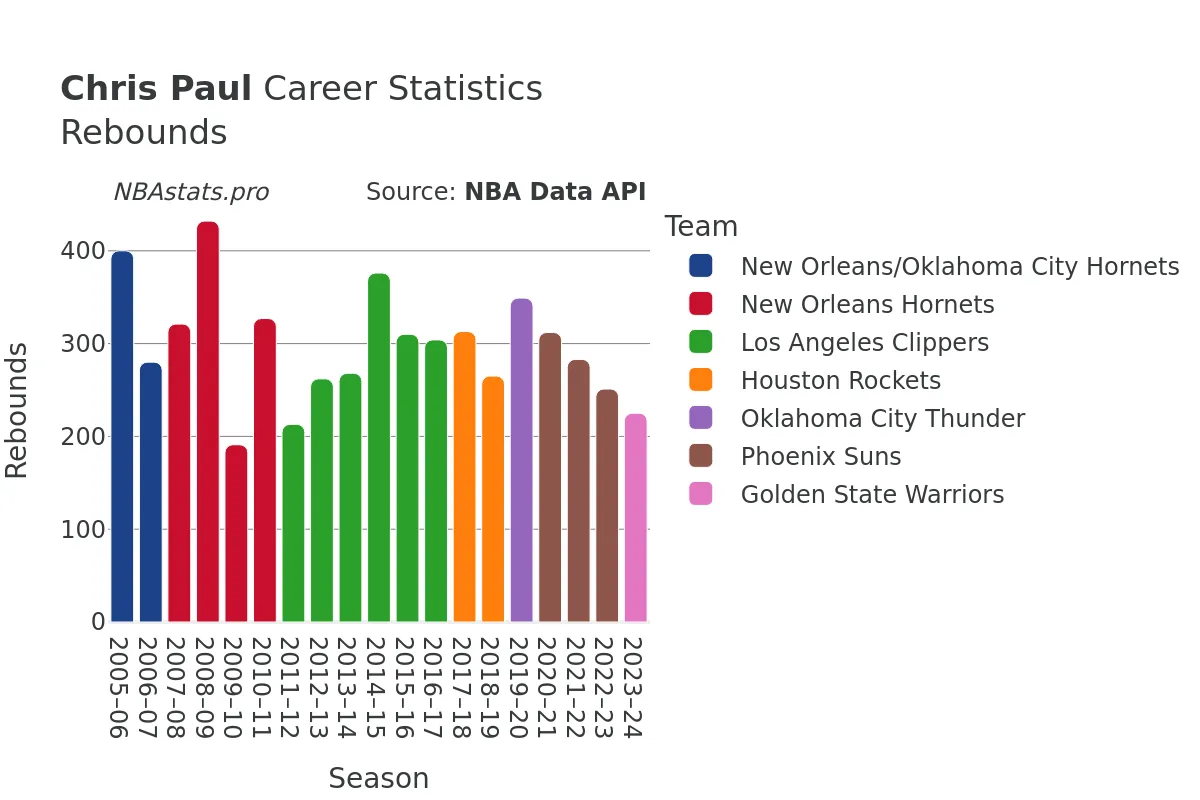
Rebounding may not be the first thing that comes to mind when discussing Chris Paul, but his 5682 rebounds, including 4923 defensive rebounds and 759 offensive rebounds, speak to his versatility and willingness to contribute in all aspects of the game.
When it comes to free throws, Paul has been a reliable asset for his teams. With 5487 attempts and an impressive 4772 successful free throws, he has proven to be clutch in crucial moments, often delivering when it matters most. His proficiency at the free-throw line is a testament to his focus and composure under pressure.
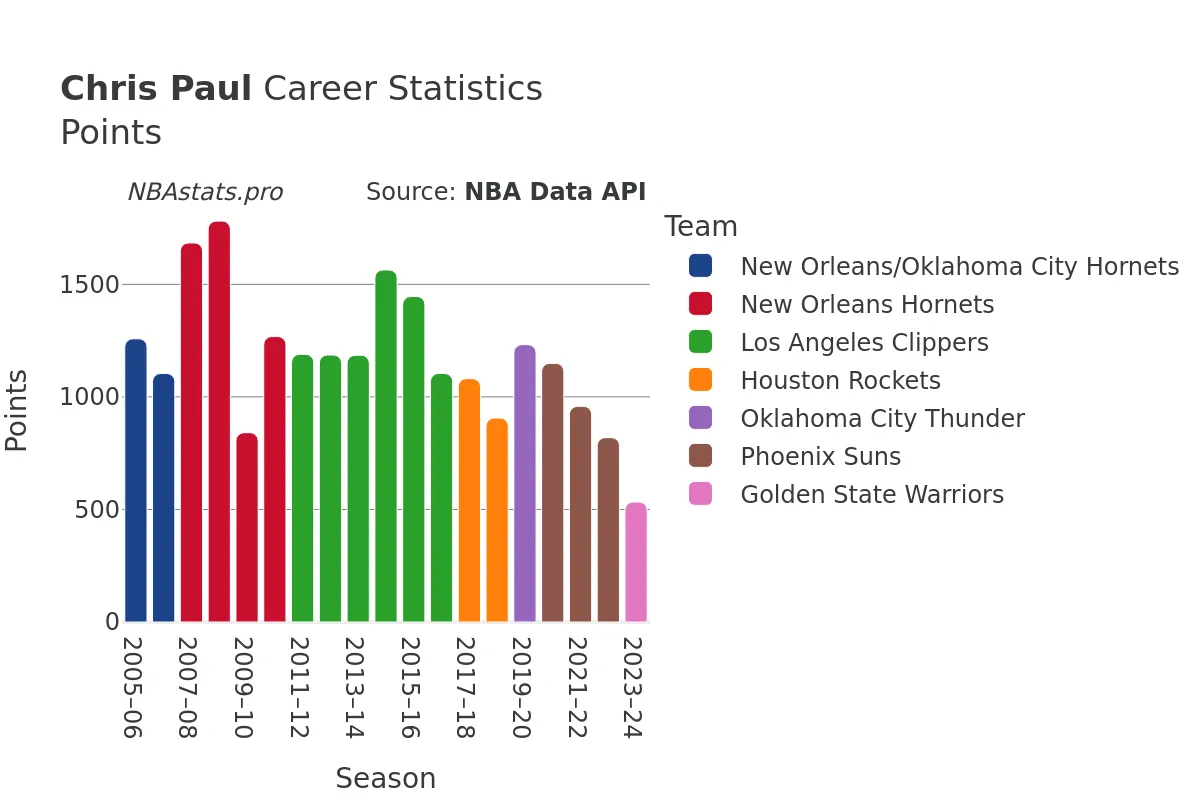
In terms of scoring, Paul has accumulated a total of 22288 points throughout his career, showcasing his ability to take over games and lead his team to victory. Whether it's sinking crucial baskets or setting up his teammates for scoring opportunities, Paul's impact on the court is undeniable.
As an active player in the league, Chris Paul continues to defy expectations and set the standard for excellence. With his unwavering dedication to the game, impressive skill set, and remarkable consistency, Paul has solidified his legacy as one of the greatest point guards to ever play the game.
Join us as we explore the fascinating career of Chris Paul through in-depth analysis and detailed breakdowns of his performance on the court. Dive into the numbers, charts, and graphs to gain a deeper understanding of the player behind the statistics. Witness the magic of Chris Paul unfold as we celebrate his extraordinary career in the NBA.
Read more
Games Played
Points
Assists
Rebounds
Steals
Minutes Played
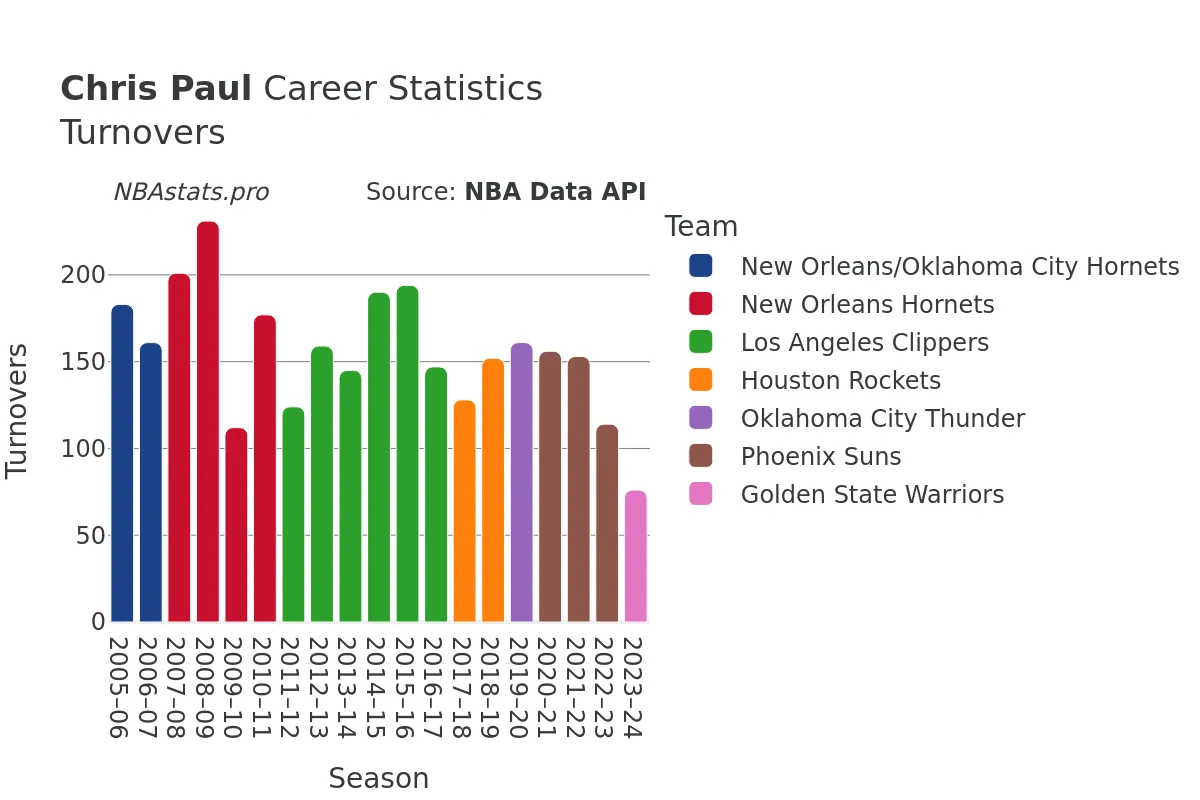
Turnovers
Blocks
Chris Paul Career Stats Table
| SEASON | TEAM | AGE | GP | GS | MIN | FGM | FGA | FG % | FG3M | FG3A | FG3 % | FTM | FTA | FT % | OREB | DREB | REB | AST | STL | BLK | TOV | PF | PTS | |
|---|---|---|---|---|---|---|---|---|---|---|---|---|---|---|---|---|---|---|---|---|---|---|---|---|
| 1 | 2005-06 | NOK | 21 | 78 | 78 | 2,808 | 407 | 947 | 43.0% | 50 | 177 | 28.2% | 394 | 465 | 84.7% | 61 | 339 | 400 | 611 | 175 | 6 | 183 | 218 | 1,258 |
| 2 | 2006-07 | NOK | 22 | 64 | 64 | 2,353 | 381 | 871 | 43.7% | 50 | 143 | 35.0% | 292 | 357 | 81.8% | 54 | 226 | 280 | 569 | 118 | 3 | 161 | 154 | 1,104 |
| 3 | 2007-08 | NOH | 23 | 80 | 80 | 3,006 | 630 | 1,291 | 48.8% | 92 | 249 | 36.9% | 332 | 390 | 85.1% | 62 | 259 | 321 | 925 | 217 | 4 | 201 | 185 | 1,684 |
| 4 | 2008-09 | NOH | 24 | 78 | 78 | 3,002 | 631 | 1,255 | 50.3% | 64 | 176 | 36.4% | 455 | 524 | 86.8% | 69 | 363 | 432 | 861 | 216 | 10 | 231 | 212 | 1,781 |
| 5 | 2009-10 | NOH | 25 | 45 | 45 | 1,712 | 314 | 637 | 49.3% | 52 | 127 | 40.9% | 161 | 190 | 84.7% | 20 | 171 | 191 | 480 | 96 | 8 | 112 | 118 | 841 |
| 6 | 2010-11 | NOH | 26 | 80 | 80 | 2,880 | 430 | 928 | 46.3% | 71 | 183 | 38.8% | 337 | 384 | 87.8% | 38 | 289 | 327 | 782 | 188 | 5 | 177 | 196 | 1,268 |
| 7 | 2011-12 | LAC | 27 | 60 | 60 | 2,181 | 425 | 890 | 47.8% | 79 | 213 | 37.1% | 260 | 302 | 86.1% | 42 | 171 | 213 | 543 | 152 | 4 | 124 | 138 | 1,189 |
| 8 | 2012-13 | LAC | 28 | 70 | 70 | 2,335 | 412 | 856 | 48.1% | 76 | 232 | 32.8% | 286 | 323 | 88.5% | 53 | 209 | 262 | 678 | 169 | 10 | 159 | 143 | 1,186 |
| 9 | 2013-14 | LAC | 29 | 62 | 62 | 2,171 | 406 | 870 | 46.7% | 78 | 212 | 36.8% | 295 | 345 | 85.5% | 38 | 230 | 268 | 663 | 154 | 4 | 145 | 157 | 1,185 |
| 10 | 2014-15 | LAC | 30 | 82 | 82 | 2,857 | 568 | 1,170 | 48.5% | 139 | 349 | 39.8% | 289 | 321 | 90.0% | 52 | 324 | 376 | 838 | 156 | 15 | 190 | 203 | 1,564 |
| 11 | 2015-16 | LAC | 31 | 74 | 74 | 2,420 | 515 | 1,114 | 46.2% | 122 | 329 | 37.1% | 294 | 328 | 89.6% | 39 | 271 | 310 | 738 | 152 | 13 | 194 | 185 | 1,446 |
| 12 | 2016-17 | LAC | 32 | 61 | 61 | 1,921 | 374 | 785 | 47.6% | 124 | 302 | 41.1% | 232 | 260 | 89.2% | 40 | 264 | 304 | 563 | 119 | 8 | 147 | 146 | 1,104 |
| 13 | 2017-18 | HOU | 33 | 58 | 58 | 1,847 | 367 | 798 | 46.0% | 144 | 379 | 38.0% | 203 | 221 | 91.9% | 37 | 276 | 313 | 457 | 96 | 14 | 128 | 141 | 1,081 |
| 14 | 2018-19 | HOU | 34 | 58 | 58 | 1,857 | 302 | 720 | 41.9% | 127 | 355 | 35.8% | 175 | 203 | 86.2% | 36 | 229 | 265 | 473 | 114 | 18 | 152 | 146 | 906 |
| 15 | 2019-20 | OKC | 35 | 70 | 70 | 2,208 | 434 | 887 | 48.9% | 111 | 304 | 36.5% | 253 | 279 | 90.7% | 26 | 323 | 349 | 472 | 111 | 11 | 161 | 158 | 1,232 |
| 16 | 2020-21 | PHX | 36 | 70 | 70 | 2,200 | 439 | 879 | 49.9% | 102 | 258 | 39.5% | 169 | 181 | 93.4% | 25 | 287 | 312 | 622 | 99 | 19 | 156 | 166 | 1,149 |
| 17 | 2021-22 | PHX | 37 | 65 | 65 | 2,139 | 363 | 736 | 49.3% | 63 | 199 | 31.7% | 169 | 202 | 83.7% | 22 | 261 | 283 | 702 | 121 | 20 | 153 | 134 | 958 |
| 18 | 2022-23 | PHX | 38 | 59 | 59 | 1,889 | 294 | 668 | 44.0% | 98 | 261 | 37.5% | 133 | 160 | 83.1% | 27 | 224 | 251 | 524 | 91 | 22 | 114 | 126 | 819 |
| 19 | 2023-24 | GSW | 38 | 58 | 18 | 1,531 | 206 | 467 | 44.1% | 78 | 210 | 37.1% | 43 | 52 | 82.7% | 18 | 207 | 225 | 393 | 70 | 6 | 76 | 108 | 533 |
Max Min
NBA Alltime Leaders
Games Played
Robert Parish: 1,611Kareem Abdul-Jabbar: 1,560
Vince Carter: 1,541
Dirk Nowitzki: 1,522
John Stockton: 1,504
Points
LeBron James: 40,474Kareem Abdul-Jabbar: 38,387
Karl Malone: 36,928
Kobe Bryant: 33,643
Michael Jordan: 32,292
Steals
John Stockton: 3,265Jason Kidd: 2,684
Chris Paul: 2,614
Michael Jordan: 2,514
Gary Payton: 2,445
Free Throws Made
Karl Malone: 9,787Moses Malone: 8,531
LeBron James: 8,390
Kobe Bryant: 8,378
Oscar Robertson: 7,694