Wesley Johnson Stats: NBA Career

## Wesley Johnson: A Defensive Dynamo
Wesley Johnson, a versatile forward known for his defensive prowess, has carved out an impressive career in the NBA. Over the span of nine seasons, Johnson showcased his skills for various teams, leaving a lasting impact on each franchise he played for. Let's delve into the numbers and discover what makes Wesley Johnson a standout player in the league.
### A Journey Across the NBA Landscape
Johnson's NBA journey began in the 2010-11 season when he donned ...the jersey of the **Minnesota Timberwolves**. From there, he went on to play for the **Phoenix Suns**, **Los Angeles Lakers**, **Los Angeles Clippers**, **New Orleans Pelicans**, and finally the **Washington Wizards**. Through his travels, Johnson left his mark on the basketball courts of Minnesota, Phoenix, Los Angeles, New Orleans, and Washington, showcasing his skills in different states across the country.
### Defensive Tenacity and Rebounding Prowess
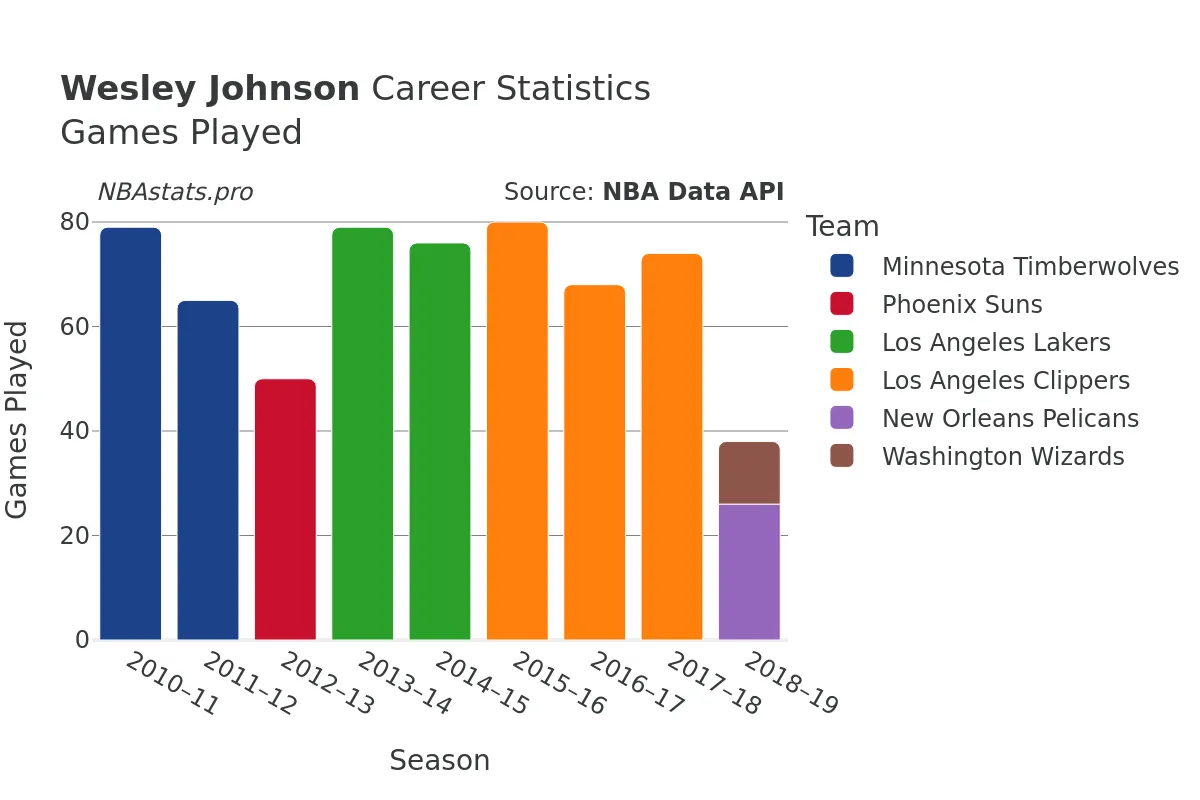
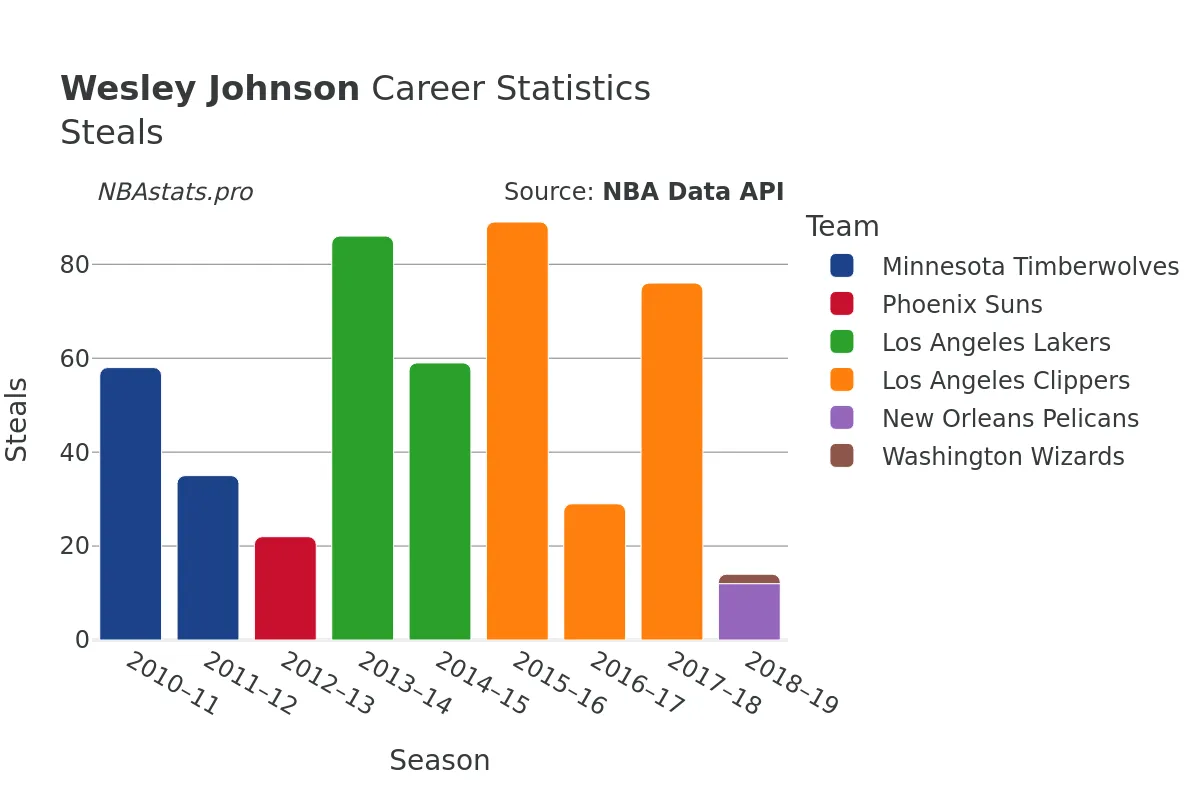
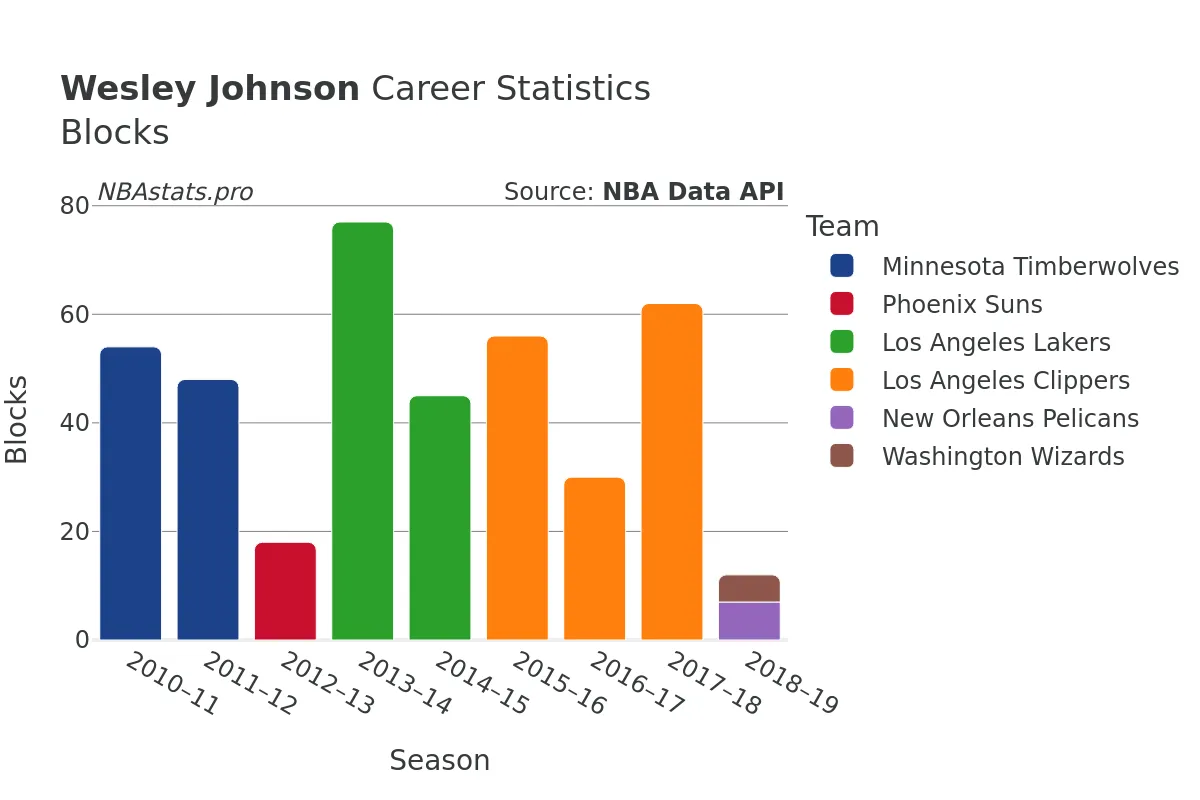
Throughout his career, Johnson demonstrated a knack for defense, amassing impressive stats in steals and blocks. With a total of **482 steals** and **414 blocks** over 647 games played, Johnson's defensive capabilities were crucial for his teams' success. His ability to disrupt opponents' plays and protect the rim made him a valuable asset on the court.
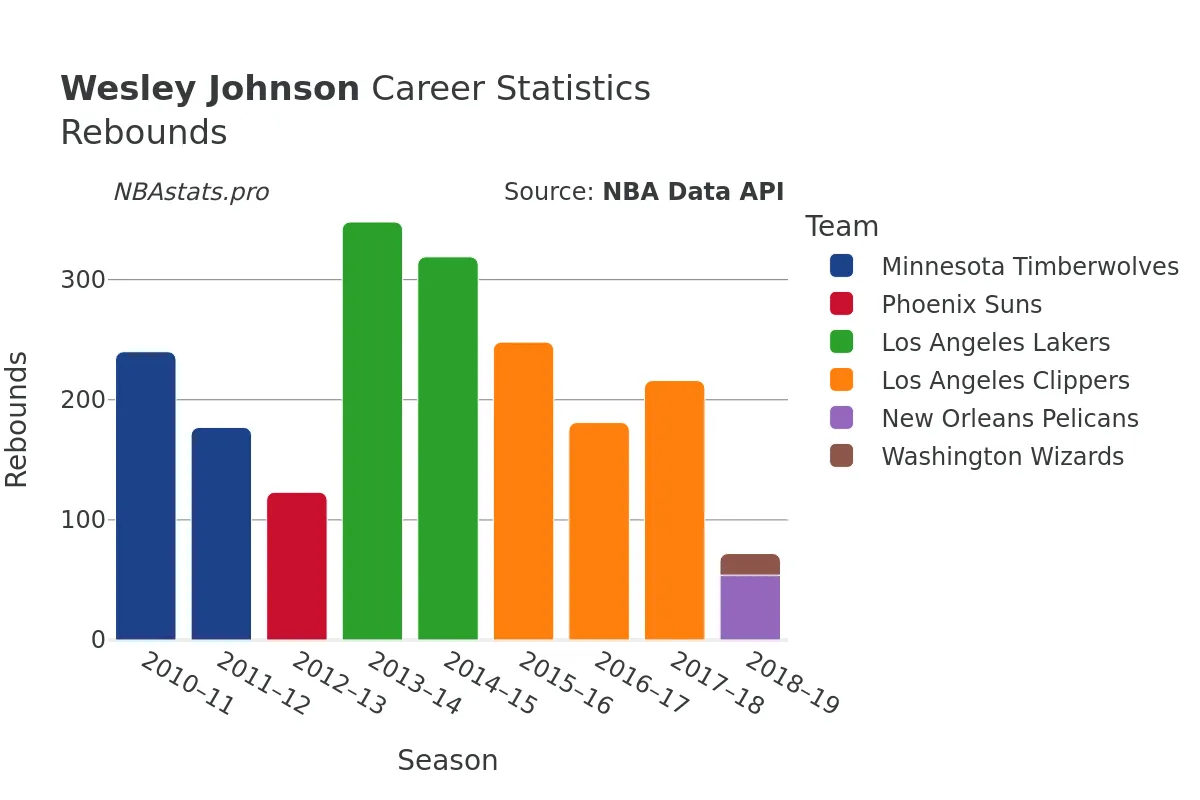
In addition to his defensive contributions, Johnson was a force to be reckoned with on the boards. With **1996 rebounds** to his name, including **1647 defensive rebounds** and **349 offensive rebounds**, Johnson displayed his tenacity and determination in battling for possession under the basket.
### Scoring Efficiency and Playmaking Skills
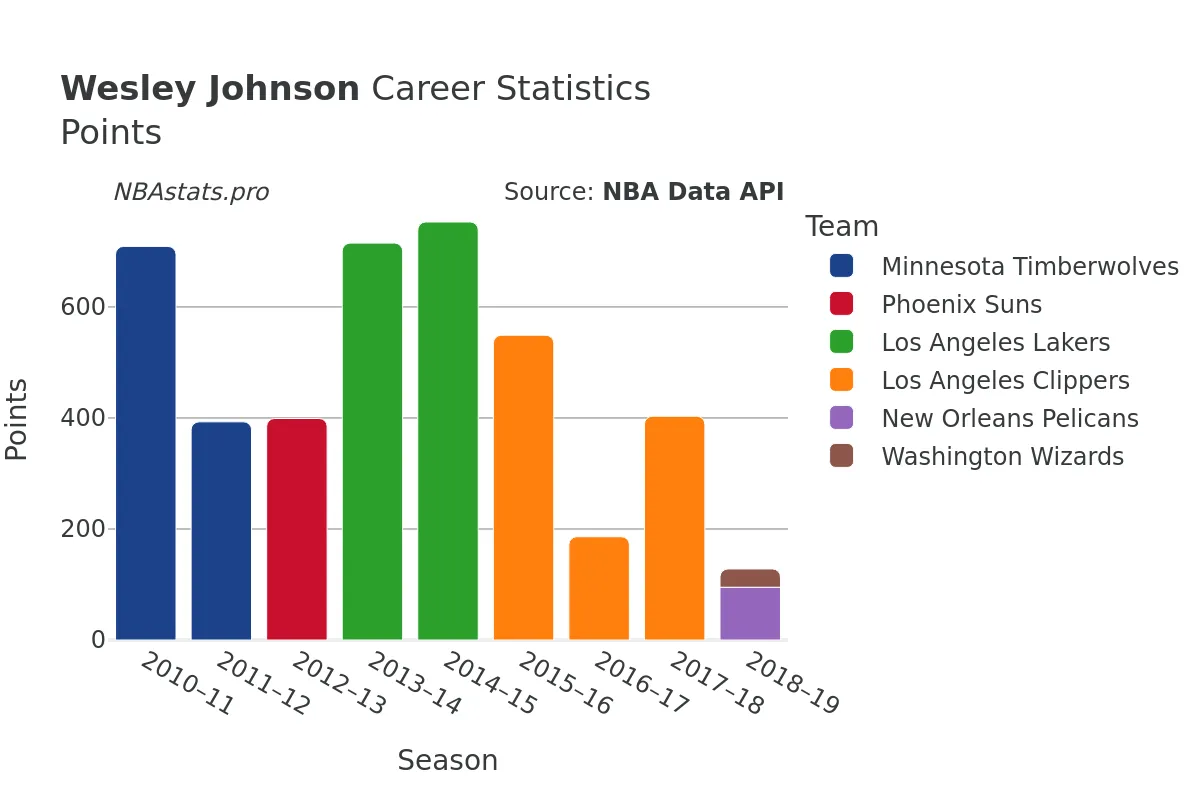
While Johnson's defensive skills were a highlight of his game, he also showcased efficiency and effectiveness on the offensive end. Over his career, Johnson attempted **4156 field goals**, making **1674 of them** at a shooting percentage of **40.28%**. His ability to convert his attempts into points provided a solid offensive foundation for his teams.
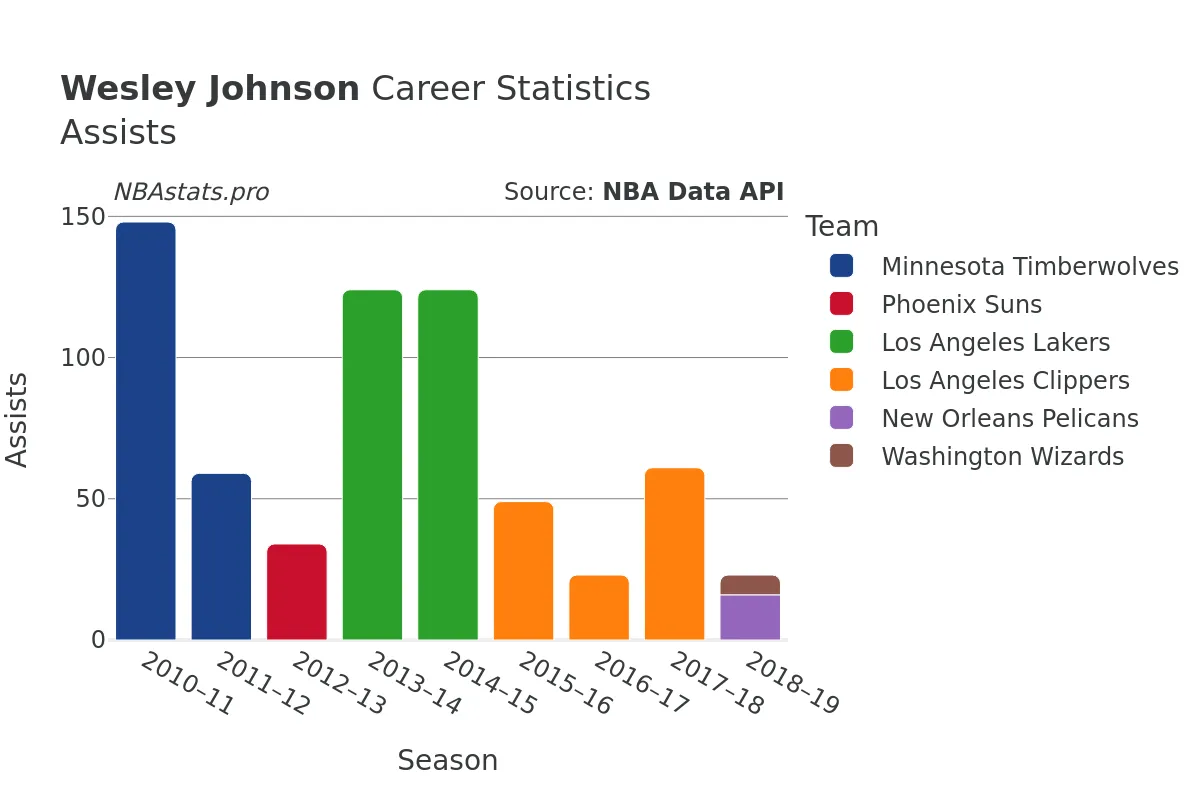
Johnson's versatility extended to his playmaking abilities, as evidenced by his **668 assists** over the span of his career. Whether scoring himself or setting up teammates for baskets, Johnson's well-rounded game made him a valuable asset on both ends of the floor.
### A Legacy of Resilience and Dedication
Throughout his time in the NBA, Wesley Johnson exemplified resilience and dedication to his craft. From his early days as a 23-year-old rookie to his final season at the age of 31, Johnson continued to compete at a high level, showcasing his passion for the game and commitment to excellence.
As Johnson's NBA journey came to a close after the 2018-19 season, his impact on the teams he represented and the fans who cheered him on was indelible. His legacy as a defensive dynamo and versatile forward endures, serving as a testament to his skills and contributions to the game of basketball.
### Dive Deeper into Wesley Johnson's Career
To truly appreciate the full scope of Wesley Johnson's impact on the NBA, explore the detailed statistics and charts that capture his performance on the court. From steals and blocks to rebounds and assists, each metric tells a story of Johnson's talents and contributions to the teams he played for. Take a closer look at the numbers and discover what made Wesley Johnson a standout player in the league.
Read more
Games Played
Points
Assists
Rebounds
Steals
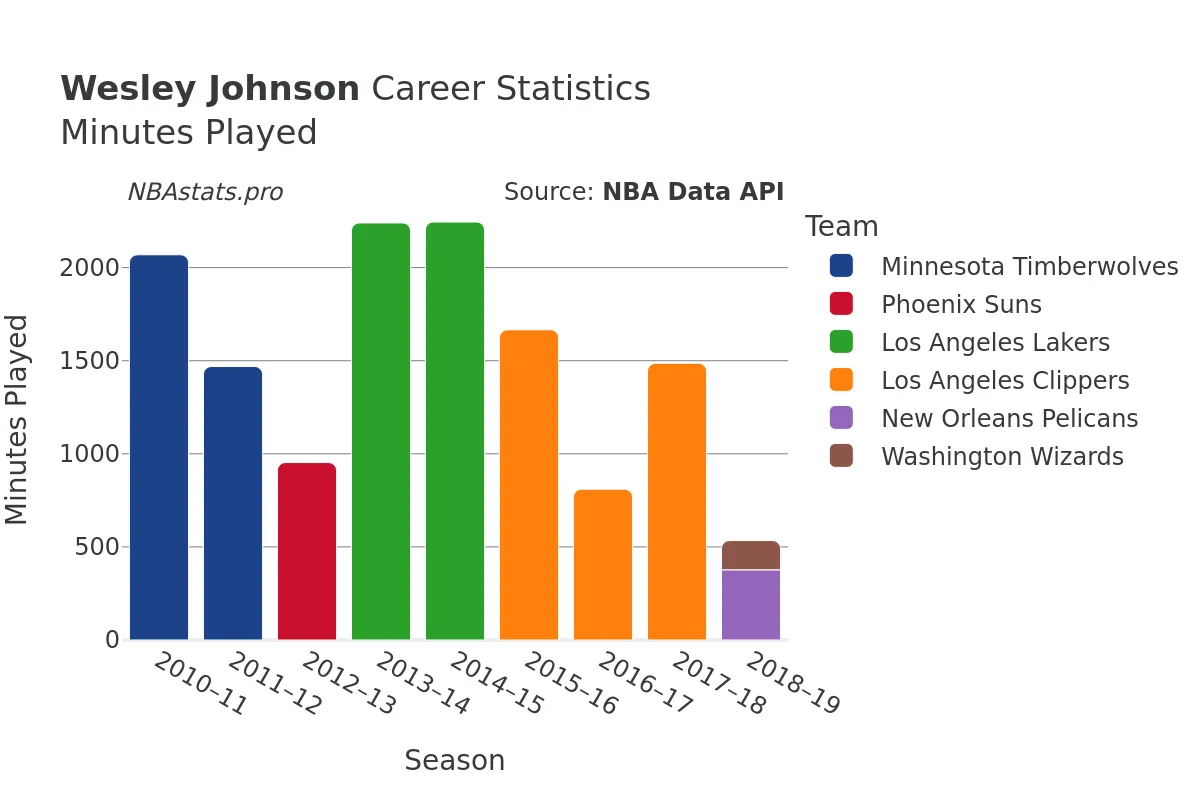
Minutes Played
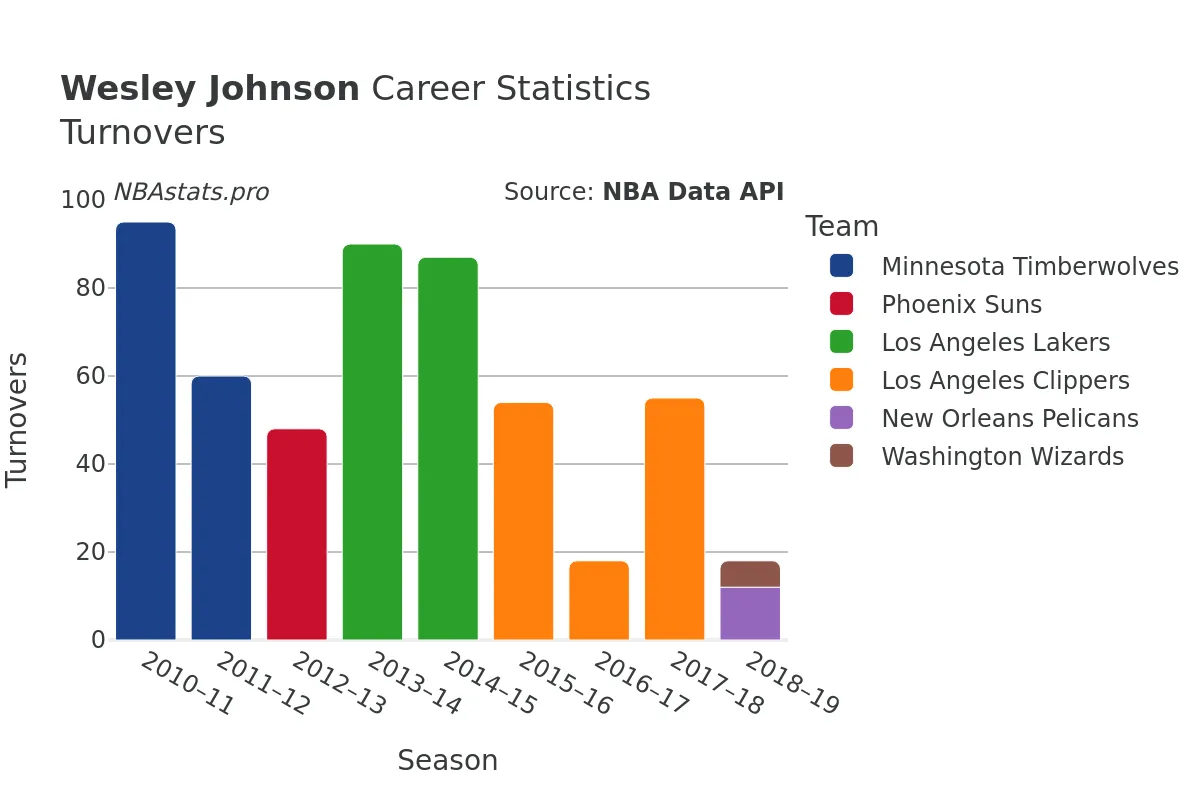
Turnovers
Blocks
Wesley Johnson Career Stats Table
| SEASON | TEAM | AGE | GP | GS | MIN | FGM | FGA | FG % | FG3M | FG3A | FG3 % | FTM | FTA | FT % | OREB | DREB | REB | AST | STL | BLK | TOV | PF | PTS | |
|---|---|---|---|---|---|---|---|---|---|---|---|---|---|---|---|---|---|---|---|---|---|---|---|---|
| 1 | 2010-11 | MIN | 23 | 79 | 63 | 2,069 | 271 | 682 | 39.7% | 103 | 289 | 35.6% | 64 | 92 | 69.6% | 51 | 189 | 240 | 148 | 58 | 54 | 95 | 163 | 709 |
| 2 | 2011-12 | MIN | 24 | 65 | 64 | 1,469 | 158 | 397 | 39.8% | 53 | 169 | 31.4% | 24 | 34 | 70.6% | 24 | 153 | 177 | 59 | 35 | 48 | 60 | 115 | 393 |
| 3 | 2012-13 | PHX | 25 | 50 | 21 | 953 | 161 | 396 | 40.7% | 50 | 155 | 32.3% | 27 | 35 | 77.1% | 21 | 102 | 123 | 34 | 22 | 18 | 48 | 56 | 399 |
| 4 | 2013-14 | LAL | 26 | 79 | 62 | 2,240 | 277 | 651 | 42.5% | 100 | 271 | 36.9% | 61 | 77 | 79.2% | 70 | 278 | 348 | 124 | 86 | 77 | 90 | 207 | 715 |
| 5 | 2014-15 | LAL | 27 | 76 | 59 | 2,245 | 286 | 691 | 41.4% | 91 | 259 | 35.1% | 90 | 112 | 80.4% | 67 | 252 | 319 | 124 | 59 | 45 | 87 | 162 | 753 |
| 6 | 2015-16 | LAC | 28 | 80 | 9 | 1,666 | 208 | 515 | 40.4% | 103 | 309 | 33.3% | 30 | 46 | 65.2% | 37 | 211 | 248 | 49 | 89 | 56 | 54 | 173 | 549 |
| 7 | 2016-17 | LAC | 29 | 68 | 3 | 810 | 73 | 200 | 36.5% | 29 | 118 | 24.6% | 11 | 17 | 64.7% | 26 | 155 | 181 | 23 | 29 | 30 | 18 | 83 | 186 |
| 8 | 2017-18 | LAC | 30 | 74 | 40 | 1,486 | 150 | 368 | 40.8% | 60 | 177 | 33.9% | 43 | 58 | 74.1% | 29 | 187 | 216 | 61 | 76 | 62 | 55 | 146 | 403 |
| 9 | 2018-19 | NOP | 31 | 26 | 13 | 377 | 35 | 88 | 39.8% | 19 | 50 | 38.0% | 6 | 9 | 66.7% | 10 | 44 | 54 | 16 | 12 | 7 | 12 | 45 | 95 |
| 10 | 2018-19 | WAS | 31 | 12 | 0 | 157 | 10 | 40 | 25.0% | 6 | 26 | 23.1% | 7 | 10 | 70.0% | 2 | 16 | 18 | 7 | 2 | 5 | 6 | 18 | 33 |
| 11 | 2018-19 | TOT | 31 | 38 | 13 | 534 | 45 | 128 | 35.2% | 25 | 76 | 32.9% | 13 | 19 | 68.4% | 12 | 60 | 72 | 23 | 14 | 12 | 18 | 63 | 128 |
Max Min
NBA Alltime Leaders
Games Played
Robert Parish: 1,611Kareem Abdul-Jabbar: 1,560
Vince Carter: 1,541
Dirk Nowitzki: 1,522
John Stockton: 1,504
Points
LeBron James: 40,474Kareem Abdul-Jabbar: 38,387
Karl Malone: 36,928
Kobe Bryant: 33,643
Michael Jordan: 32,292
Steals
John Stockton: 3,265Jason Kidd: 2,684
Chris Paul: 2,614
Michael Jordan: 2,514
Gary Payton: 2,445
Free Throws Made
Karl Malone: 9,787Moses Malone: 8,531
LeBron James: 8,390
Kobe Bryant: 8,378
Oscar Robertson: 7,694