Tyler Johnson Stats: NBA Career

In the fast-paced world of the NBA, every player brings a unique set of skills and talents to the court. Let's shine a spotlight on Tyler Johnson, who has traversed multiple teams throughout his career, leaving a mark in each city he played in.
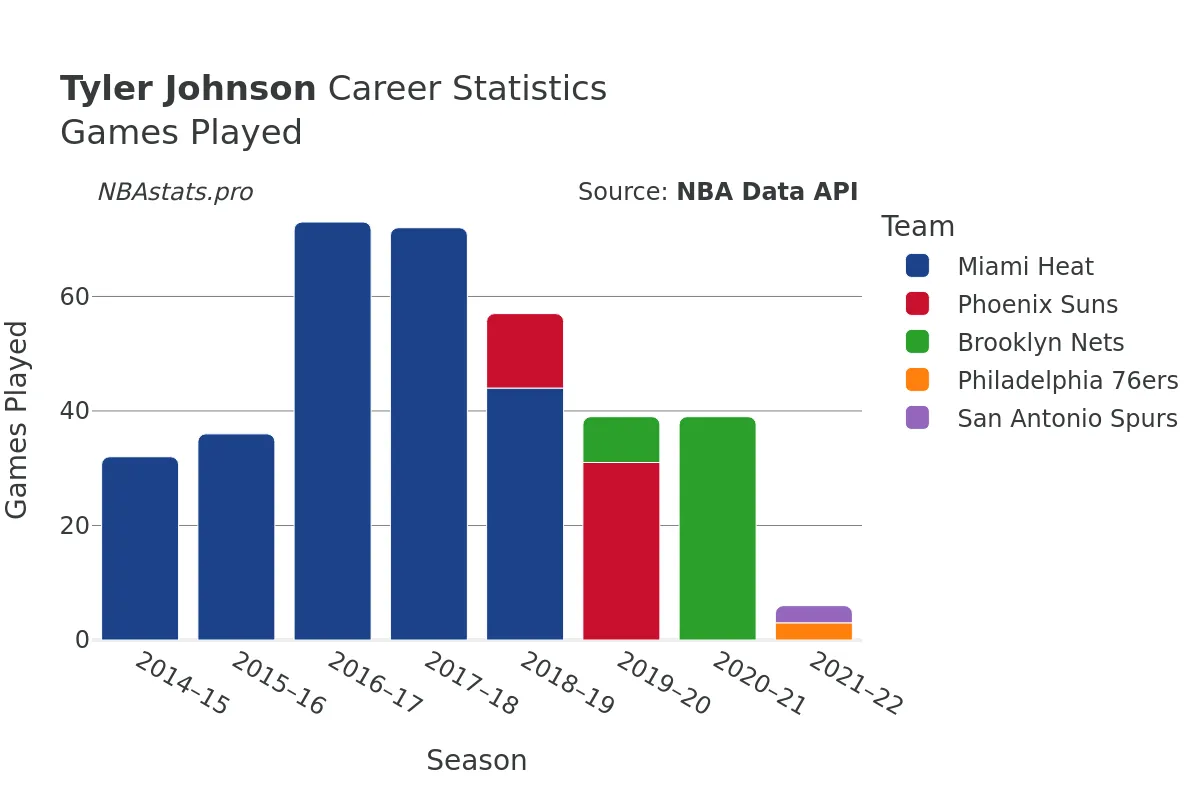
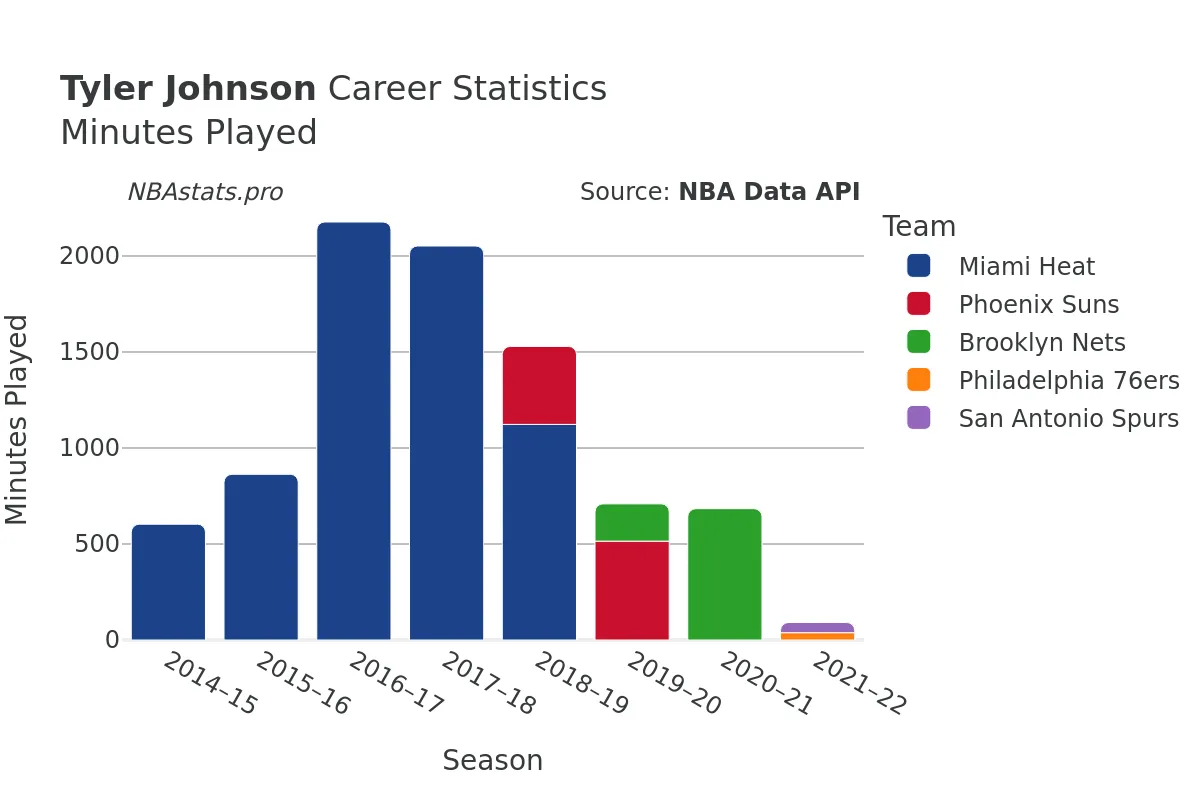
Tyler Johnson's journey began in the 2014-15 NBA season, stepping onto the court at the age of 23 with the Miami Heat. Over the years, he showcased his prowess as a shooting guard, dribbling his way through defenses and sinking shots with finesse. With 4...56 games under his belt, Johnson logged a total of 11,037 minutes of play, seizing every moment to make an impact.
Known for his accuracy and precision, Johnson attempted 3,720 field goals during his career, successfully making 1,566 of them. This translated to a solid field goal percentage of approximately 42%. Whether it was a mid-range jumper or a drive to the basket, Johnson's offensive capabilities always kept the opposing team on their toes.
One aspect of Johnson's game that truly set him apart was his free throw shooting. With 869 attempts at the charity stripe, he coolly sank 676 of them, boasting an impressive free throw percentage. His clutch free throw shooting in crucial moments undoubtedly helped his teams secure vital points and emerge victorious on numerous occasions.
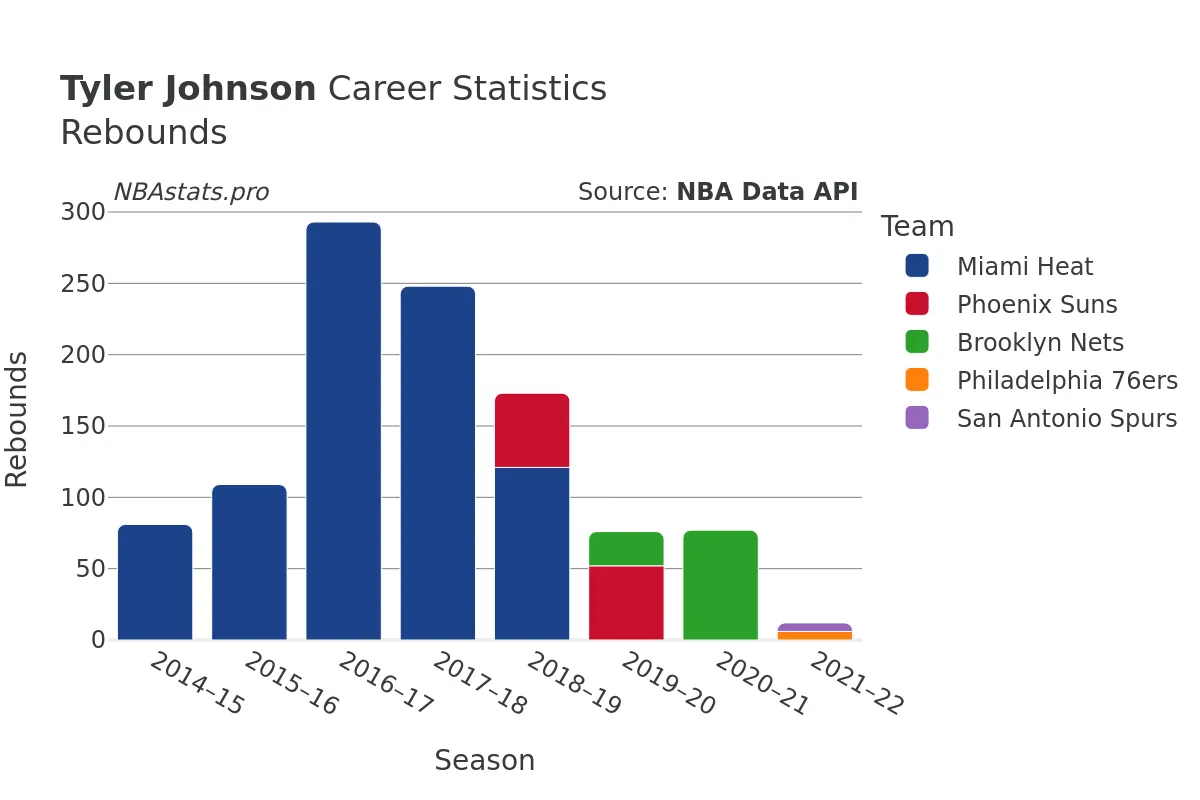
Rebounding is a fundamental skill in basketball, and Johnson proved to be a valuable asset in that department as well. Throughout his career, he snagged a total of 1,330 rebounds, with 1,088 of them coming on the defensive end, showcasing his commitment to both ends of the floor. Johnson's ability to crash the boards and secure possession for his team was instrumental in turning defense into offense.
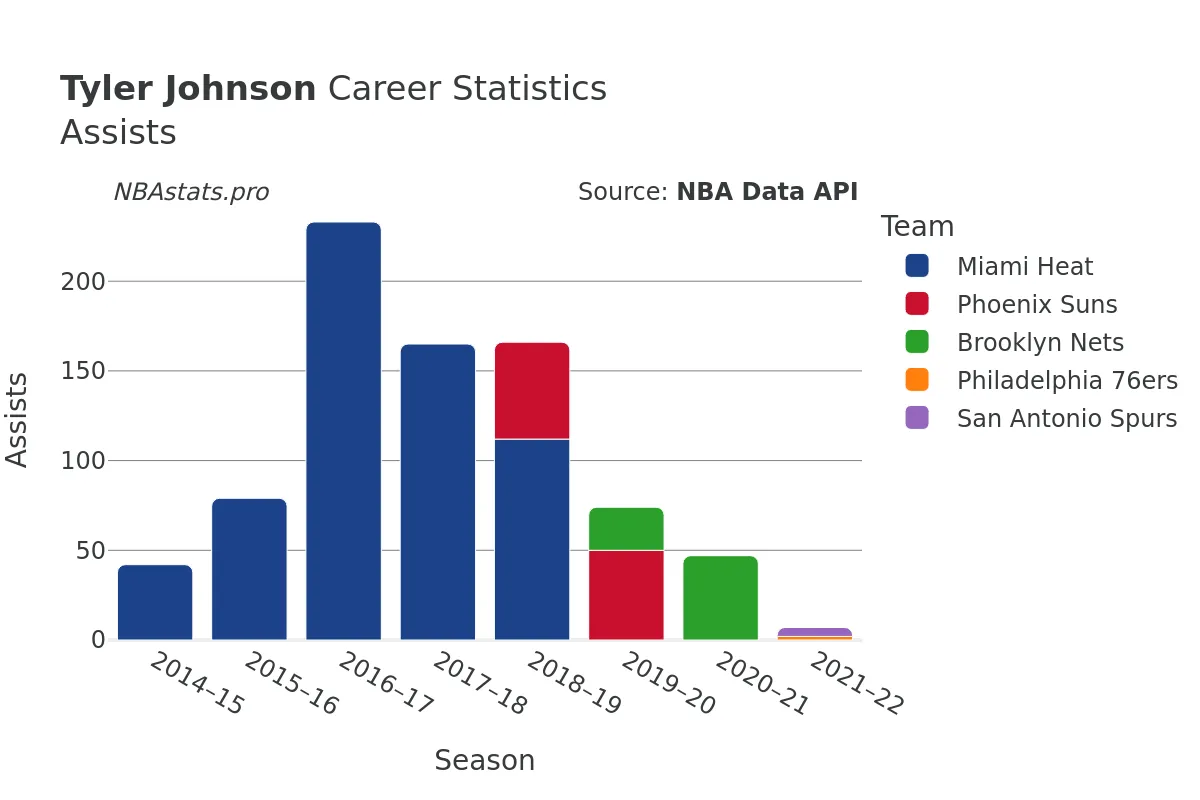
As a playmaker, Johnson also demonstrated his vision and passing abilities, amassing 1,060 assists during his time on the court. Whether setting up teammates for open looks or creating scoring opportunities through his ball movement, Johnson's unselfish style of play made him a versatile threat in any offensive scheme.
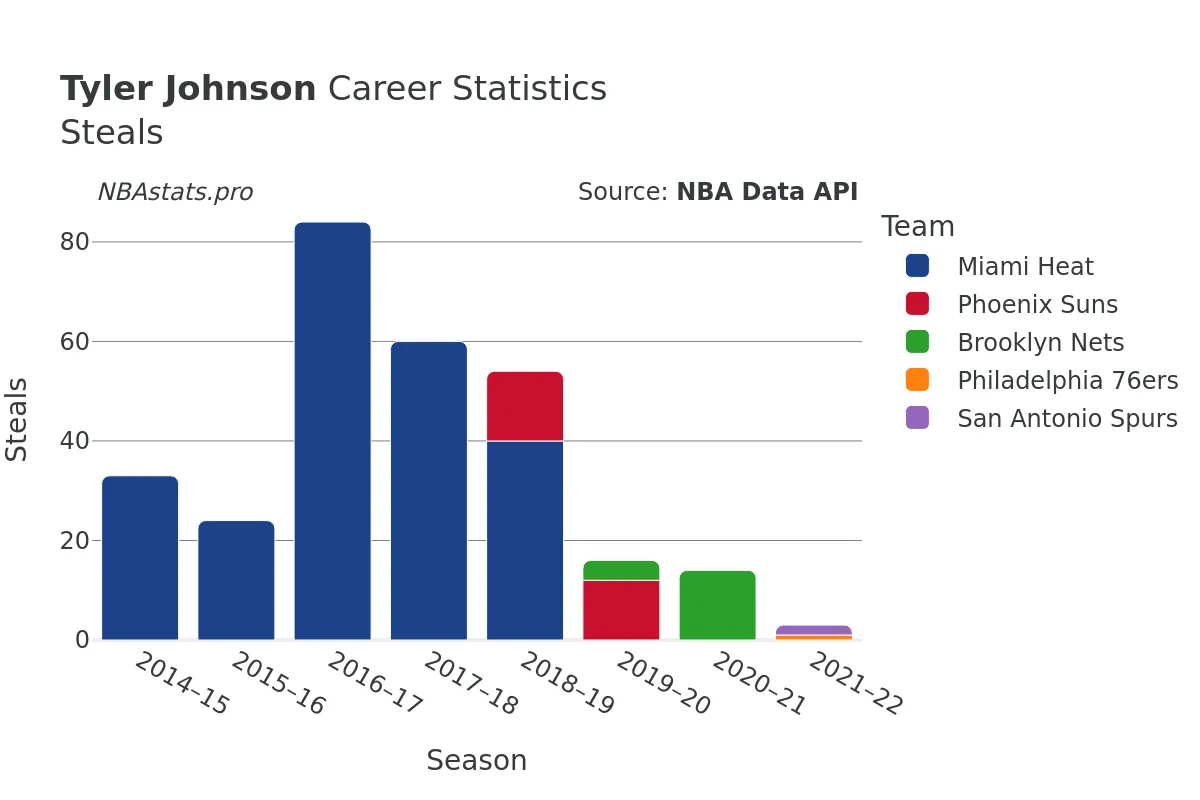
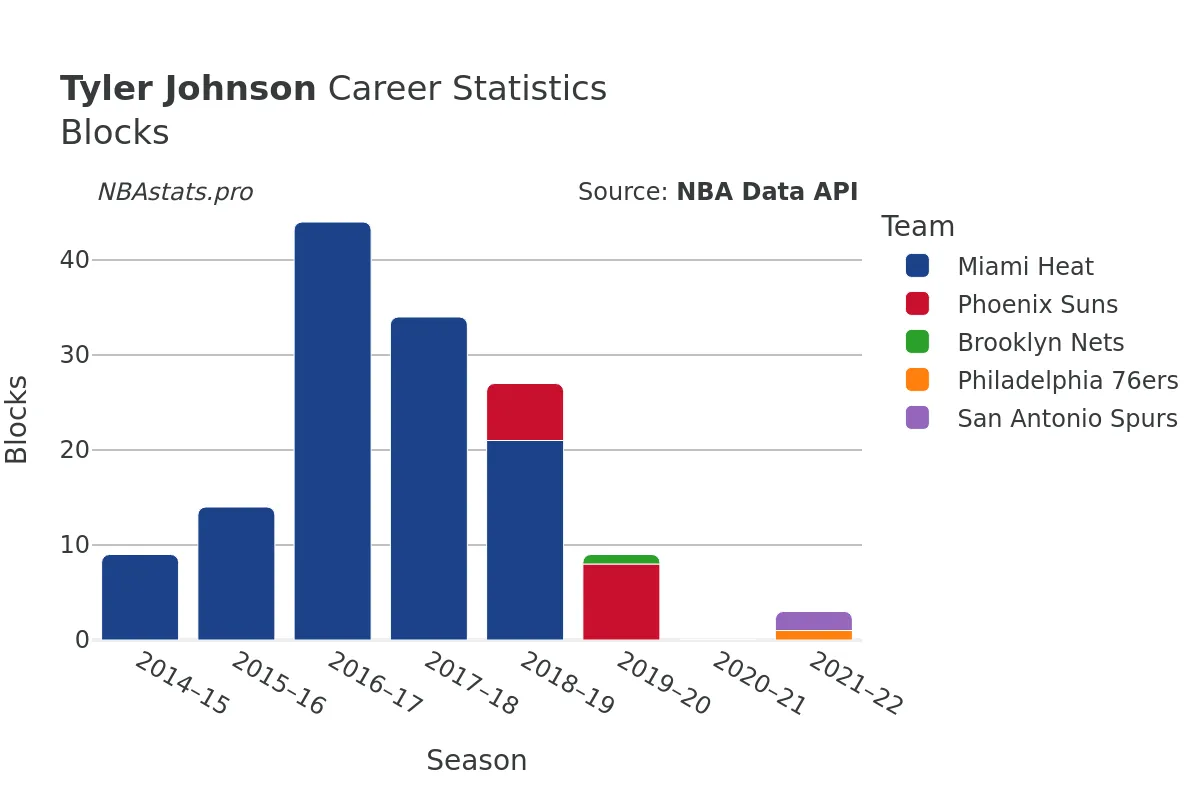
Defensively, Johnson was a tenacious presence, racking up 361 steals and 179 blocks over the course of his career. His quick hands and anticipatory skills allowed him to disrupt opponent's plays, leading to turnovers and transition opportunities for his team.
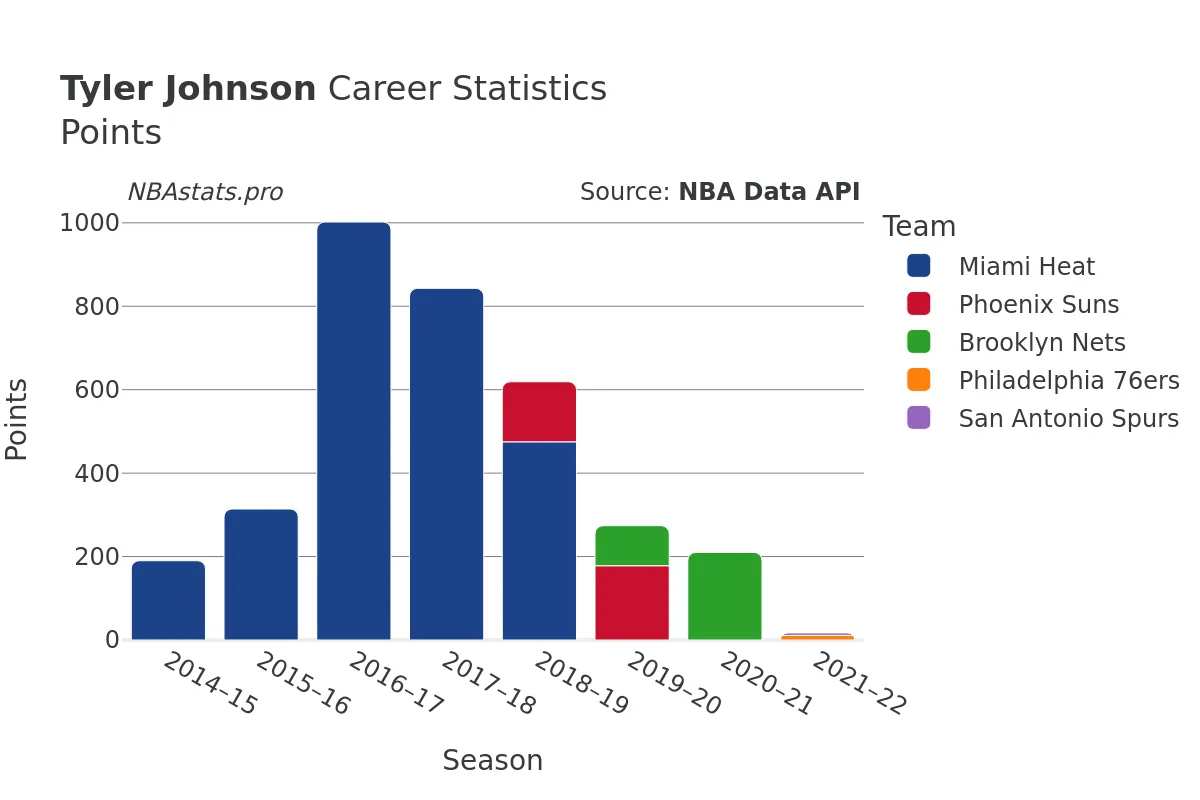
In terms of scoring, Johnson accumulated a total of 4,379 points, showcasing his ability to light up the scoreboard when his team needed a boost. Whether draining three-pointers from beyond the arc or driving to the hoop for acrobatic finishes, Johnson's scoring prowess made him a potent offensive weapon throughout his career.
While his time on the court may have come to an end, Tyler Johnson's impact on the teams he played for reverberates through the statistics and memories he left behind. From Miami to Phoenix, Brooklyn to Philadelphia, and finally San Antonio, Johnson's journey as a professional basketball player is a testament to his dedication, skill, and commitment to the game.
As you delve deeper into the numbers and charts that encapsulate Tyler Johnson's career, you'll gain a greater appreciation for the nuances of his playing style and the impact he had on the teams he represented. So, grab a seat, grab a snack, and get ready to immerse yourself in the captivating story of Tyler Johnson - a player who left it all on the hardwood every time he stepped onto the court.
Read more
Games Played
Points
Assists
Rebounds
Steals
Minutes Played
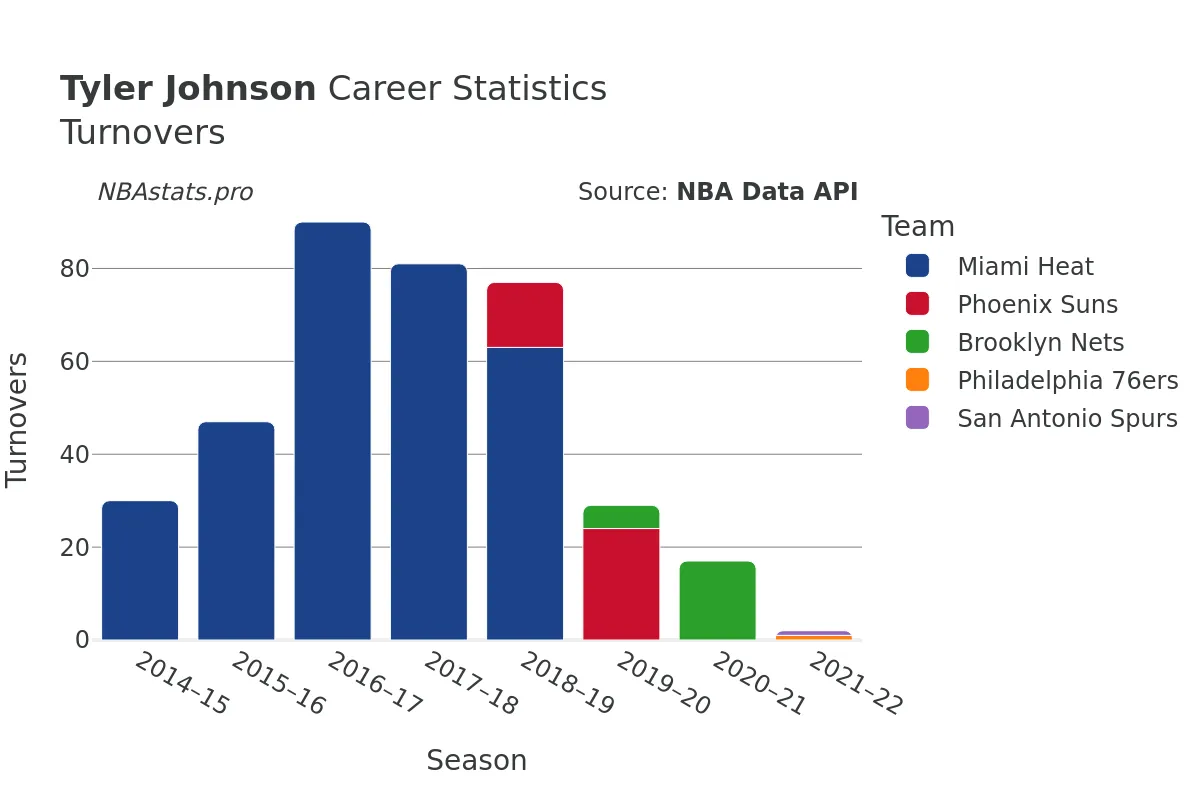
Turnovers
Blocks
Tyler Johnson Career Stats Table
| SEASON | TEAM | AGE | GP | GS | MIN | FGM | FGA | FG % | FG3M | FG3A | FG3 % | FTM | FTA | FT % | OREB | DREB | REB | AST | STL | BLK | TOV | PF | PTS | |
|---|---|---|---|---|---|---|---|---|---|---|---|---|---|---|---|---|---|---|---|---|---|---|---|---|
| 1 | 2014-15 | MIA | 23 | 32 | 2 | 603 | 70 | 167 | 41.9% | 18 | 48 | 37.5% | 32 | 47 | 68.1% | 14 | 67 | 81 | 42 | 33 | 9 | 30 | 42 | 190 |
| 2 | 2015-16 | MIA | 24 | 36 | 5 | 863 | 118 | 243 | 48.6% | 27 | 71 | 38.0% | 51 | 64 | 79.7% | 28 | 81 | 109 | 79 | 24 | 14 | 47 | 66 | 314 |
| 3 | 2016-17 | MIA | 25 | 73 | 0 | 2,177 | 357 | 824 | 43.3% | 93 | 250 | 37.2% | 195 | 254 | 76.8% | 50 | 243 | 293 | 233 | 84 | 44 | 90 | 176 | 1,002 |
| 4 | 2017-18 | MIA | 26 | 72 | 39 | 2,052 | 309 | 711 | 43.5% | 119 | 324 | 36.7% | 106 | 129 | 82.2% | 34 | 214 | 248 | 165 | 60 | 34 | 81 | 148 | 843 |
| 5 | 2018-19 | MIA | 27 | 44 | 10 | 1,123 | 171 | 401 | 42.6% | 72 | 204 | 35.3% | 61 | 88 | 69.3% | 19 | 102 | 121 | 112 | 40 | 21 | 63 | 72 | 475 |
| 6 | 2018-19 | PHX | 27 | 13 | 12 | 406 | 46 | 125 | 36.8% | 18 | 56 | 32.1% | 34 | 39 | 87.2% | 15 | 37 | 52 | 54 | 14 | 6 | 14 | 25 | 144 |
| 7 | 2018-19 | TOT | 27 | 57 | 22 | 1,529 | 217 | 526 | 41.3% | 90 | 260 | 34.6% | 95 | 127 | 74.8% | 34 | 139 | 173 | 166 | 54 | 27 | 77 | 97 | 619 |
| 8 | 2019-20 | PHX | 28 | 31 | 3 | 515 | 65 | 171 | 38.0% | 24 | 83 | 28.9% | 24 | 32 | 75.0% | 10 | 42 | 52 | 50 | 12 | 8 | 24 | 43 | 178 |
| 9 | 2019-20 | BKN | 28 | 8 | 4 | 194 | 32 | 79 | 40.5% | 14 | 36 | 38.9% | 18 | 18 | 100.0% | 8 | 16 | 24 | 24 | 4 | 1 | 5 | 15 | 96 |
| 10 | 2019-20 | TOT | 28 | 39 | 7 | 709 | 97 | 250 | 38.8% | 38 | 119 | 31.9% | 42 | 50 | 84.0% | 18 | 58 | 76 | 74 | 16 | 9 | 29 | 58 | 274 |
| 11 | 2020-21 | BKN | 29 | 39 | 3 | 684 | 72 | 183 | 39.3% | 48 | 132 | 36.4% | 18 | 21 | 85.7% | 6 | 71 | 77 | 47 | 14 | 0 | 17 | 43 | 210 |
| 12 | 2021-22 | PHI | 30 | 3 | 0 | 38 | 4 | 10 | 40.0% | 3 | 7 | 42.9% | 0 | 0 | 0.0% | 1 | 5 | 6 | 2 | 1 | 1 | 1 | 4 | 11 |
| 13 | 2021-22 | SAS | 30 | 3 | 0 | 53 | 2 | 10 | 20.0% | 2 | 6 | 33.3% | 0 | 0 | 0.0% | 2 | 4 | 6 | 5 | 2 | 2 | 1 | 3 | 6 |
| 14 | 2021-22 | TOT | 30 | 6 | 0 | 91 | 6 | 20 | 30.0% | 5 | 13 | 38.5% | 0 | 0 | 0.0% | 3 | 9 | 12 | 7 | 3 | 3 | 2 | 7 | 17 |
Max Min
NBA Alltime Leaders
Games Played
Robert Parish: 1,611Kareem Abdul-Jabbar: 1,560
Vince Carter: 1,541
Dirk Nowitzki: 1,522
John Stockton: 1,504
Points
LeBron James: 40,474Kareem Abdul-Jabbar: 38,387
Karl Malone: 36,928
Kobe Bryant: 33,643
Michael Jordan: 32,292
Steals
John Stockton: 3,265Jason Kidd: 2,684
Chris Paul: 2,614
Michael Jordan: 2,514
Gary Payton: 2,445
Free Throws Made
Karl Malone: 9,787Moses Malone: 8,531
LeBron James: 8,390
Kobe Bryant: 8,378
Oscar Robertson: 7,694