Tony Snell Stats: NBA Career

Diving into the world of basketball statistics is like unlocking a treasure trove of insights into the prowess and skills of NBA players. Among the many names that have graced the courts over the years, Tony Snell stands out as a player with a unique blend of consistency and versatility.
Tony Snell's NBA journey spanned over nine seasons, during which he showcased his talents while representing multiple teams across different states. Snell started his professional basketball career in the 2013...-14 season and concluded it in the 2021-22 season, leaving a lasting impression on fans and analysts alike.
Throughout his career, Snell donned the jerseys of the Chicago Bulls, Milwaukee Bucks, Detroit Pistons, Atlanta Hawks, Portland Trail Blazers, and New Orleans Pelicans, bringing his skills to cities such as Chicago, Milwaukee, Detroit, Atlanta, Portland, and New Orleans. His ability to adapt to different team environments and contribute effectively on the court solidified his reputation as a reliable player in the league.
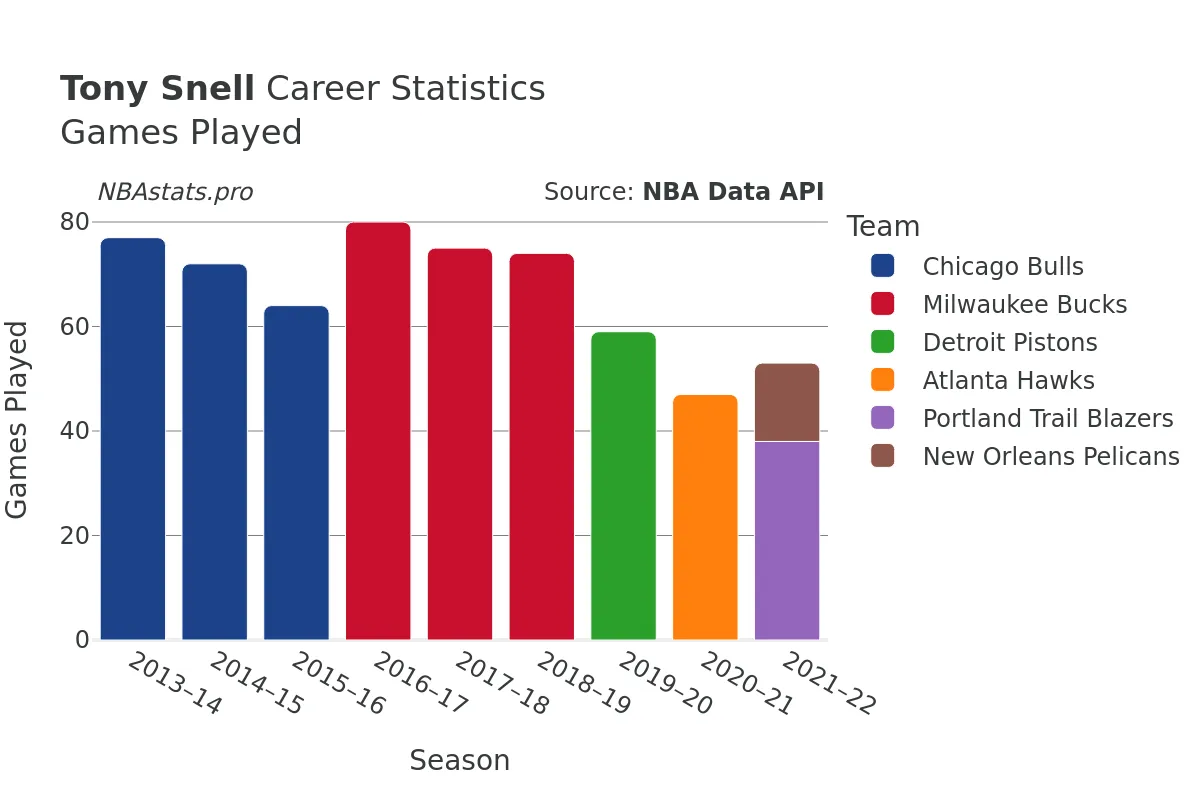
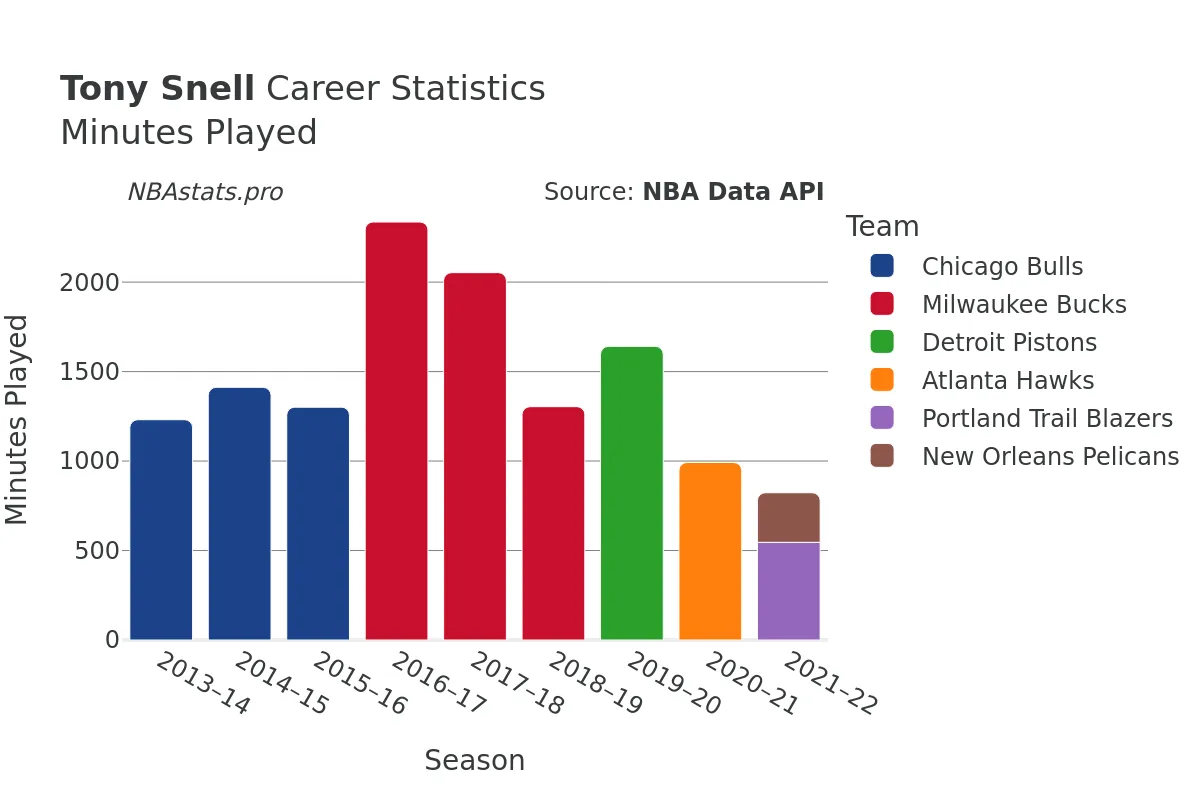
In a total of 654 games played, Snell logged an impressive 13,916 minutes on the court, highlighting his durability and value as a consistent performer. His offensive capabilities shone through as he attempted 3,268 field goals, making 1,404 of them at a shooting percentage of 42.96%. These numbers attest to Snell's scoring prowess and efficiency in putting points on the board for his team.
When it came to free throws, Snell demonstrated his composure under pressure, attempting 328 shots from the line and sinking 278 of them. His free throw percentage further underscores his proficiency at the charity stripe, showcasing his reliability in crucial moments during games.
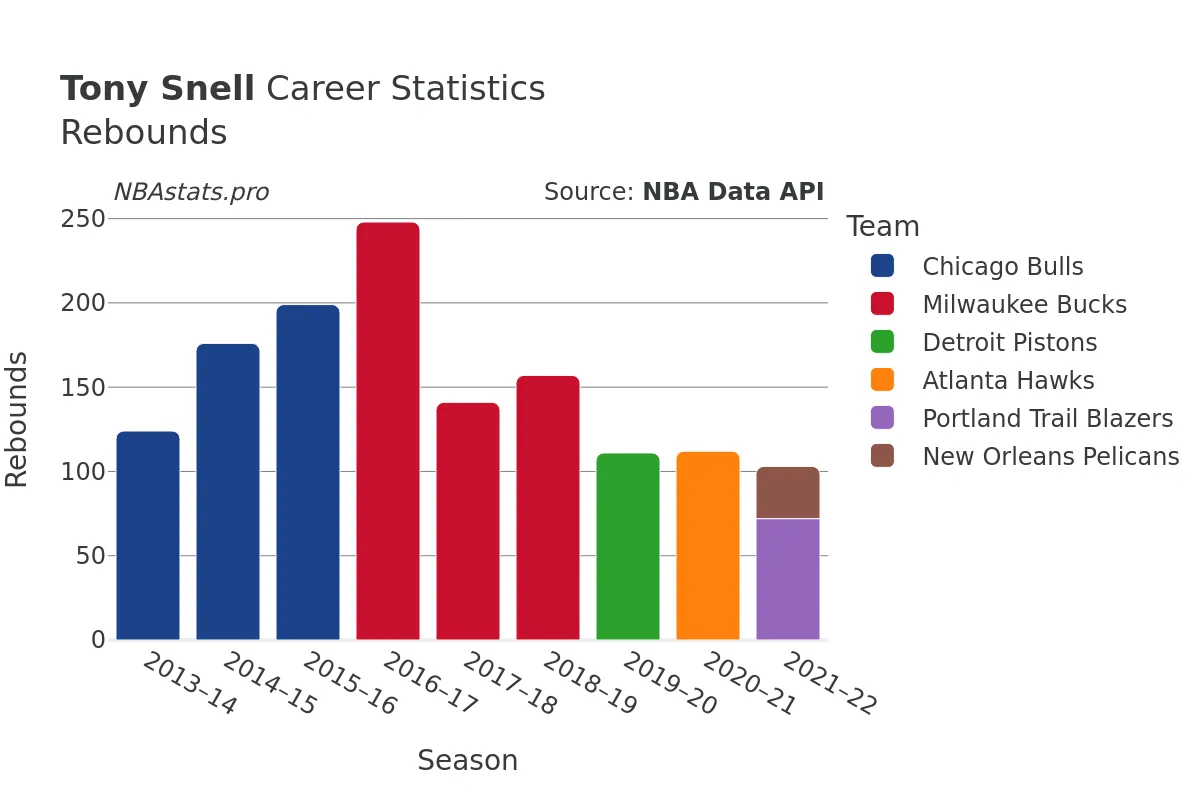
Beyond scoring, Snell made his presence felt on the boards, tallying a total of 1,474 rebounds throughout his career. His ability to secure both defensive rebounds (1,286) and offensive rebounds (188) underscores his versatility as a player who can contribute on both ends of the floor.
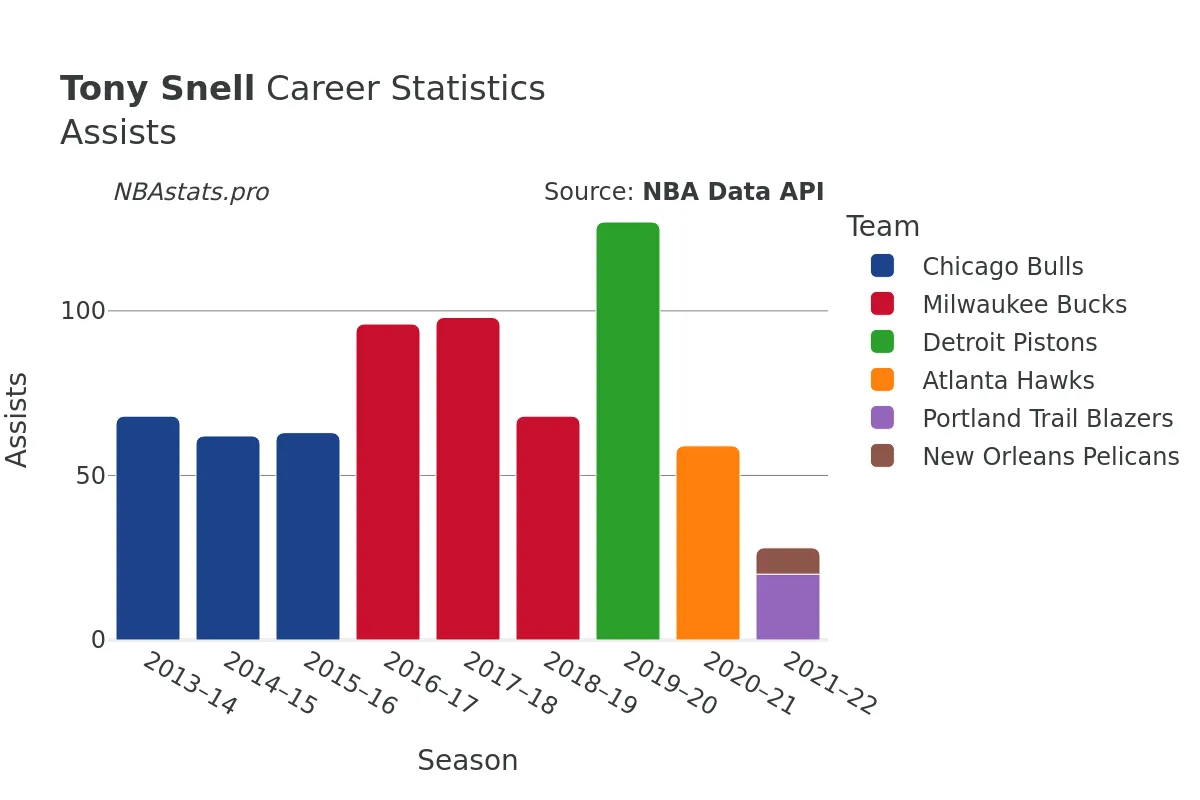
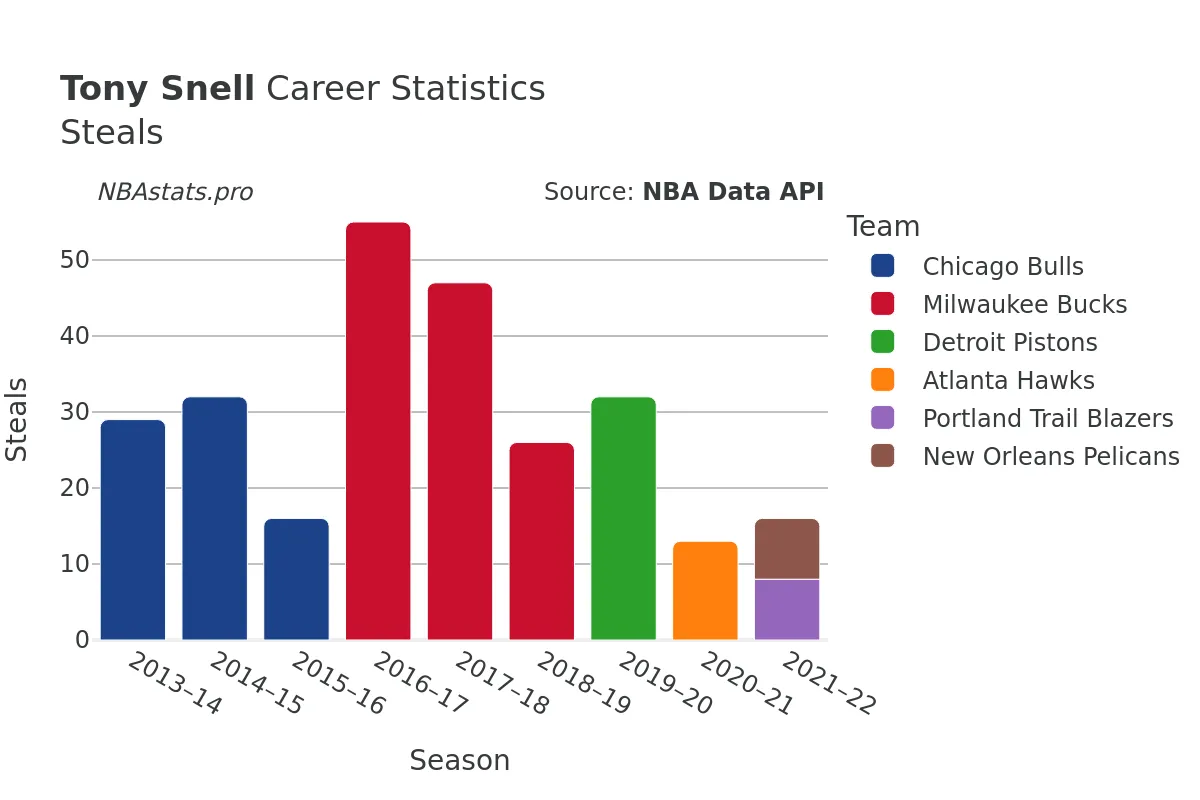
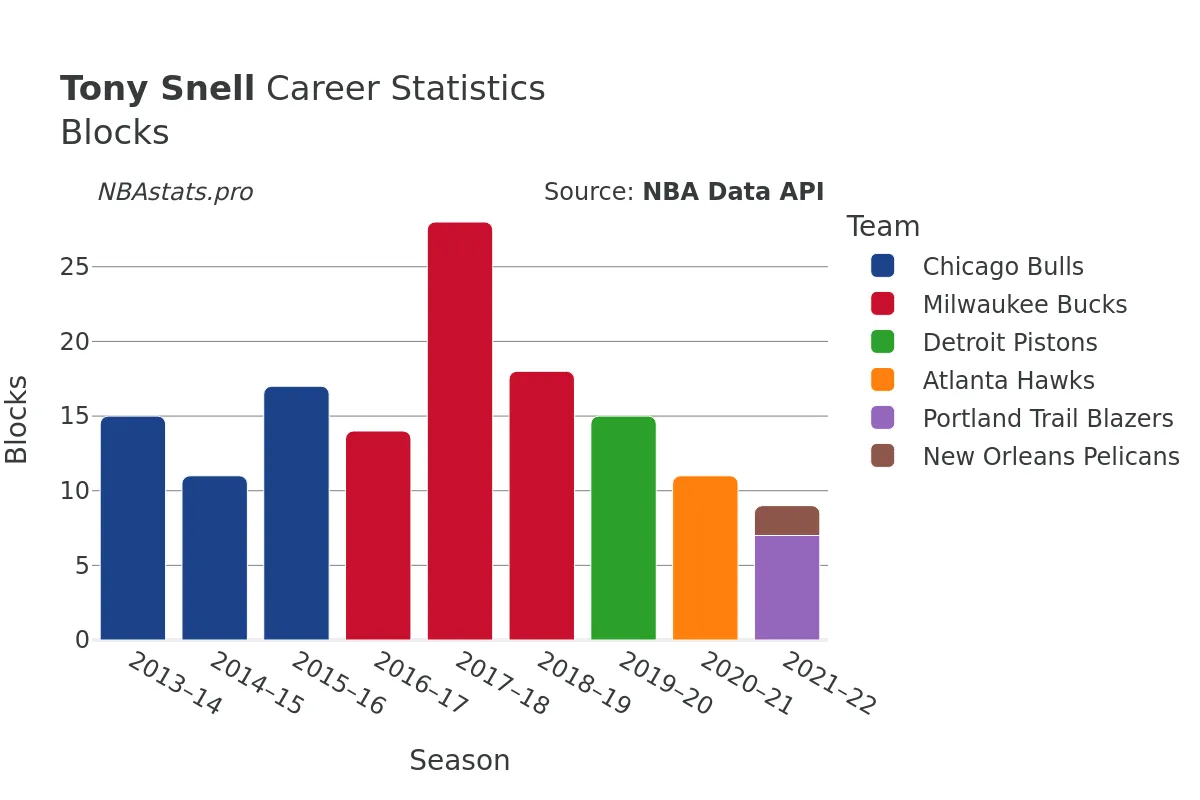
In terms of playmaking, Snell showcased his court vision and passing skills with 697 assists, demonstrating his willingness to involve his teammates and create scoring opportunities. His defensive acumen was evident in his 282 steals and 147 blocks, showcasing his ability to disrupt opponents' offensive plays and protect the rim when needed.
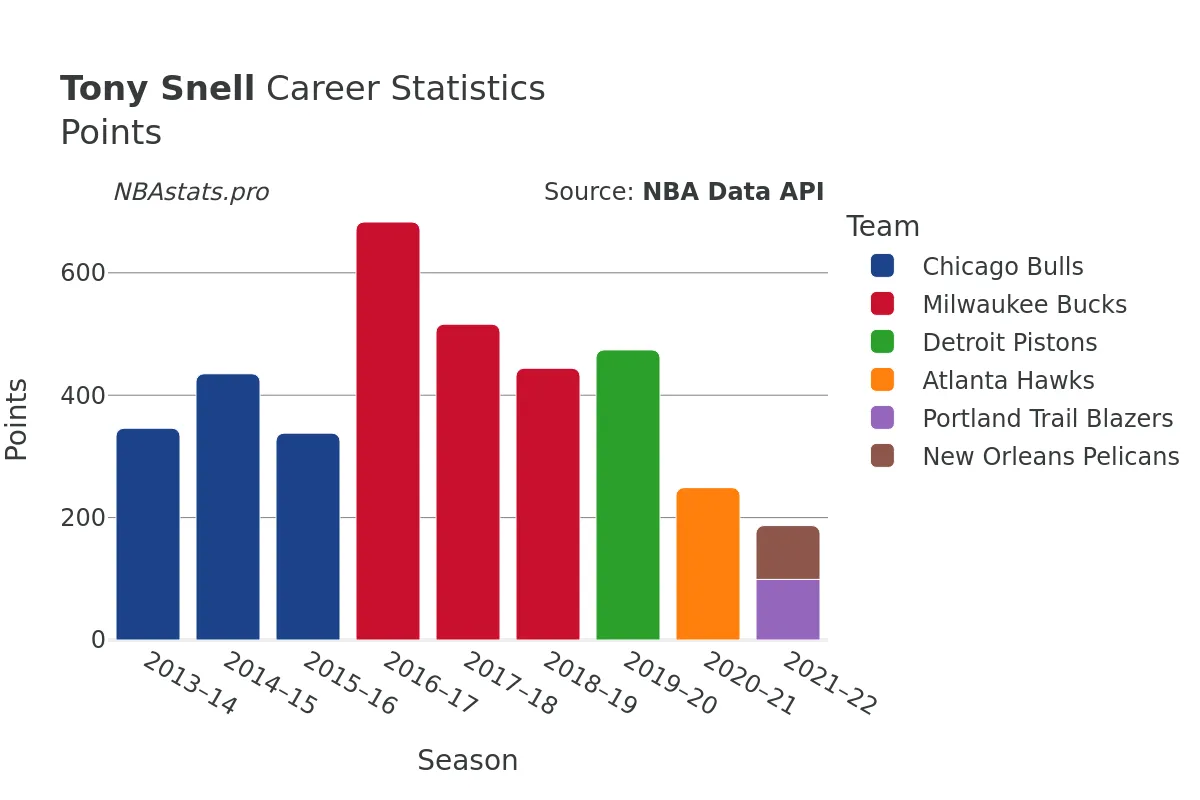
With a total of 3,859 points scored during his NBA career, Tony Snell left a mark as a player who could step up and deliver when his team needed him most. Whether it was sinking crucial shots, making key defensive plays, or setting up his teammates for success, Snell's contributions on the court were vital to his teams' success.
As you delve deeper into the statistical breakdown of Tony Snell's career, you'll uncover the nuances of his playing style, the impact he had on his teams, and the legacy he leaves behind in the NBA. Explore the numbers, analyze the trends, and discover the story of a player who left it all on the hardwood every time he laced up his sneakers.
Read more
Games Played
Points
Assists
Rebounds
Steals
Minutes Played
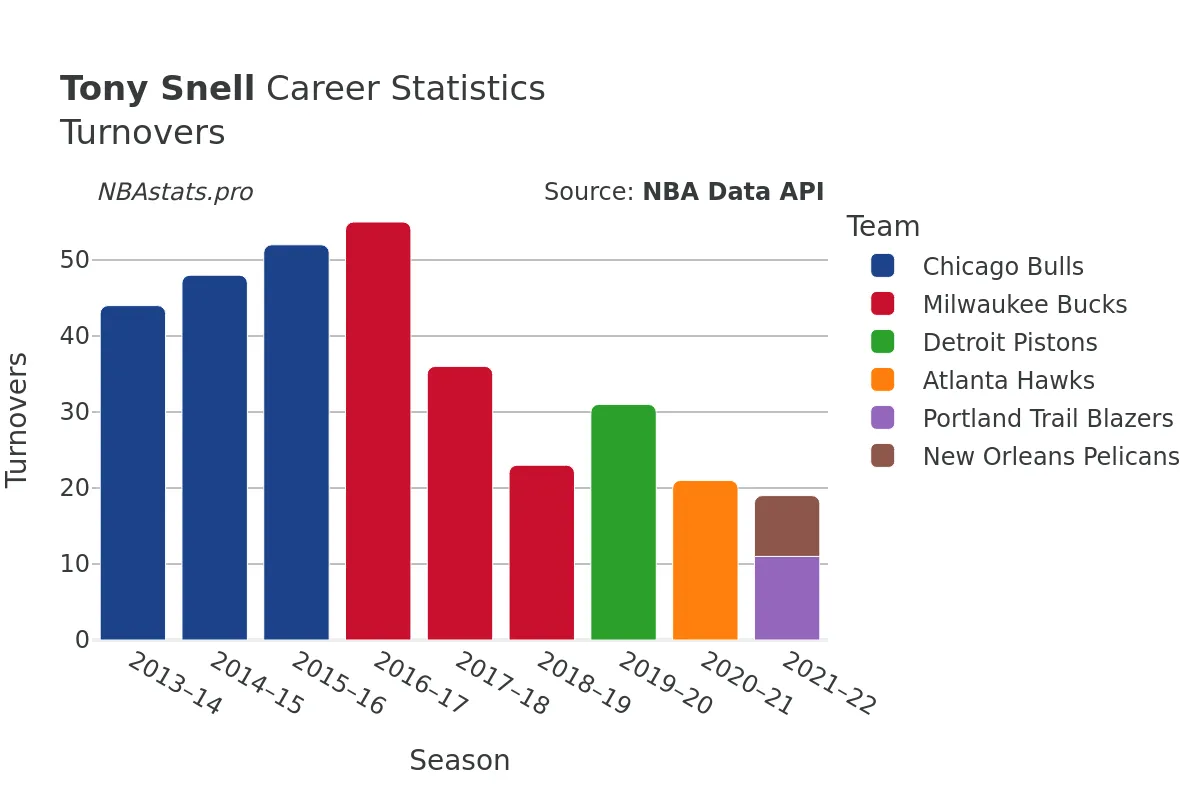
Turnovers
Blocks
Tony Snell Career Stats Table
| SEASON | TEAM | AGE | GP | GS | MIN | FGM | FGA | FG % | FG3M | FG3A | FG3 % | FTM | FTA | FT % | OREB | DREB | REB | AST | STL | BLK | TOV | PF | PTS | |
|---|---|---|---|---|---|---|---|---|---|---|---|---|---|---|---|---|---|---|---|---|---|---|---|---|
| 1 | 2013-14 | CHI | 22 | 77 | 12 | 1,231 | 129 | 336 | 38.4% | 57 | 178 | 32.0% | 31 | 41 | 75.6% | 19 | 105 | 124 | 68 | 29 | 15 | 44 | 84 | 346 |
| 2 | 2014-15 | CHI | 23 | 72 | 22 | 1,412 | 159 | 371 | 42.9% | 73 | 197 | 37.1% | 44 | 55 | 80.0% | 31 | 145 | 176 | 62 | 32 | 11 | 48 | 86 | 435 |
| 3 | 2015-16 | CHI | 24 | 64 | 33 | 1,301 | 126 | 339 | 37.2% | 56 | 155 | 36.1% | 30 | 33 | 90.9% | 19 | 180 | 199 | 63 | 16 | 17 | 52 | 100 | 338 |
| 4 | 2016-17 | MIL | 25 | 80 | 80 | 2,336 | 246 | 541 | 45.5% | 144 | 355 | 40.6% | 47 | 58 | 81.0% | 22 | 226 | 248 | 96 | 55 | 14 | 55 | 125 | 683 |
| 5 | 2017-18 | MIL | 26 | 75 | 59 | 2,053 | 185 | 425 | 43.5% | 108 | 268 | 40.3% | 38 | 48 | 79.2% | 9 | 132 | 141 | 98 | 47 | 28 | 36 | 115 | 516 |
| 6 | 2018-19 | MIL | 27 | 74 | 12 | 1,304 | 163 | 361 | 45.2% | 81 | 204 | 39.7% | 37 | 42 | 88.1% | 29 | 128 | 157 | 68 | 26 | 18 | 23 | 90 | 444 |
| 7 | 2019-20 | DET | 28 | 59 | 57 | 1,641 | 170 | 382 | 44.5% | 102 | 254 | 40.2% | 32 | 32 | 100.0% | 9 | 102 | 111 | 127 | 32 | 15 | 31 | 101 | 474 |
| 8 | 2020-21 | ATL | 29 | 47 | 23 | 992 | 88 | 171 | 51.5% | 62 | 109 | 56.9% | 11 | 11 | 100.0% | 18 | 94 | 112 | 59 | 13 | 11 | 21 | 75 | 249 |
| 9 | 2021-22 | POR | 30 | 38 | 10 | 546 | 36 | 97 | 37.1% | 24 | 75 | 32.0% | 3 | 3 | 100.0% | 11 | 61 | 72 | 20 | 8 | 7 | 11 | 44 | 99 |
| 10 | 2021-22 | NOP | 30 | 15 | 2 | 277 | 33 | 74 | 44.6% | 21 | 53 | 39.6% | 1 | 1 | 100.0% | 5 | 26 | 31 | 8 | 8 | 2 | 8 | 26 | 88 |
| 11 | 2021-22 | TOT | 30 | 53 | 12 | 823 | 69 | 171 | 40.4% | 45 | 128 | 35.2% | 4 | 4 | 100.0% | 16 | 87 | 103 | 28 | 16 | 9 | 19 | 70 | 187 |
Max Min
NBA Alltime Leaders
Games Played
Robert Parish: 1,611Kareem Abdul-Jabbar: 1,560
Vince Carter: 1,541
Dirk Nowitzki: 1,522
John Stockton: 1,504
Points
LeBron James: 40,474Kareem Abdul-Jabbar: 38,387
Karl Malone: 36,928
Kobe Bryant: 33,643
Michael Jordan: 32,292
Steals
John Stockton: 3,265Jason Kidd: 2,684
Chris Paul: 2,614
Michael Jordan: 2,514
Gary Payton: 2,445
Free Throws Made
Karl Malone: 9,787Moses Malone: 8,531
LeBron James: 8,390
Kobe Bryant: 8,378
Oscar Robertson: 7,694