Steve Hawes Stats: NBA Career

Introducing Steve Hawes: The NBA Journeyman with an Impressive Stat Line
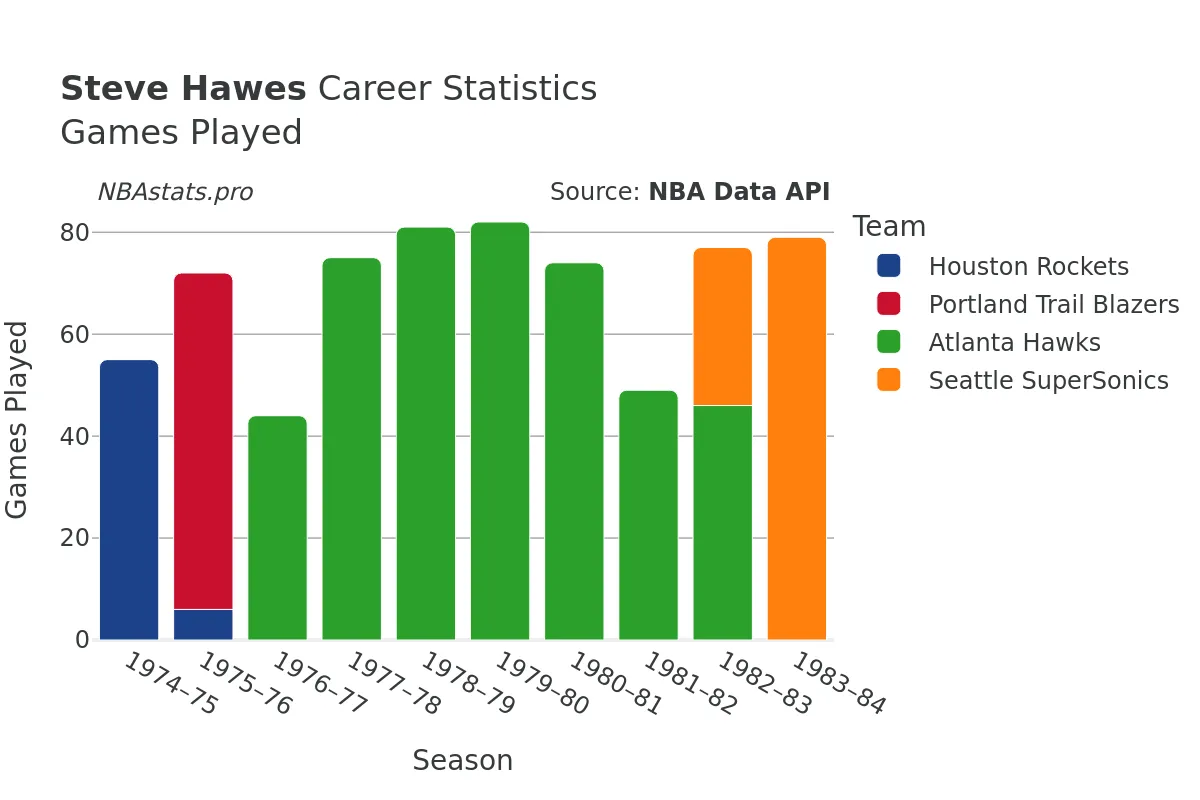
Steve Hawes, a versatile and skilled NBA player, left an indelible mark on the teams he played for during his career spanning from the 1974-75 season to the 1983-84 season. Hawes showcased his talents while wearing the jerseys of the Houston Rockets, Portland Trail Blazers, Atlanta Hawks, and Oklahoma City Thunder, representing cities such as Houston, Portland, Atlanta, and Oklahoma City, respectively.
Hawes, a true baske...tball journeyman, graced the hardwood for a total of 837 games, accumulating an impressive sum of 18,658 minutes played. His dedication to the game was evident in his 5,629 field goals attempted, out of which he successfully made 2,699, boasting an impressive field goal percentage of approximately 47.9%. Additionally, Hawes displayed finesse and accuracy from the free-throw line, attempting 1,581 free throws and sinking 1,236 of them. His prowess at the charity stripe makes him a reliable scorer when the pressure is on.
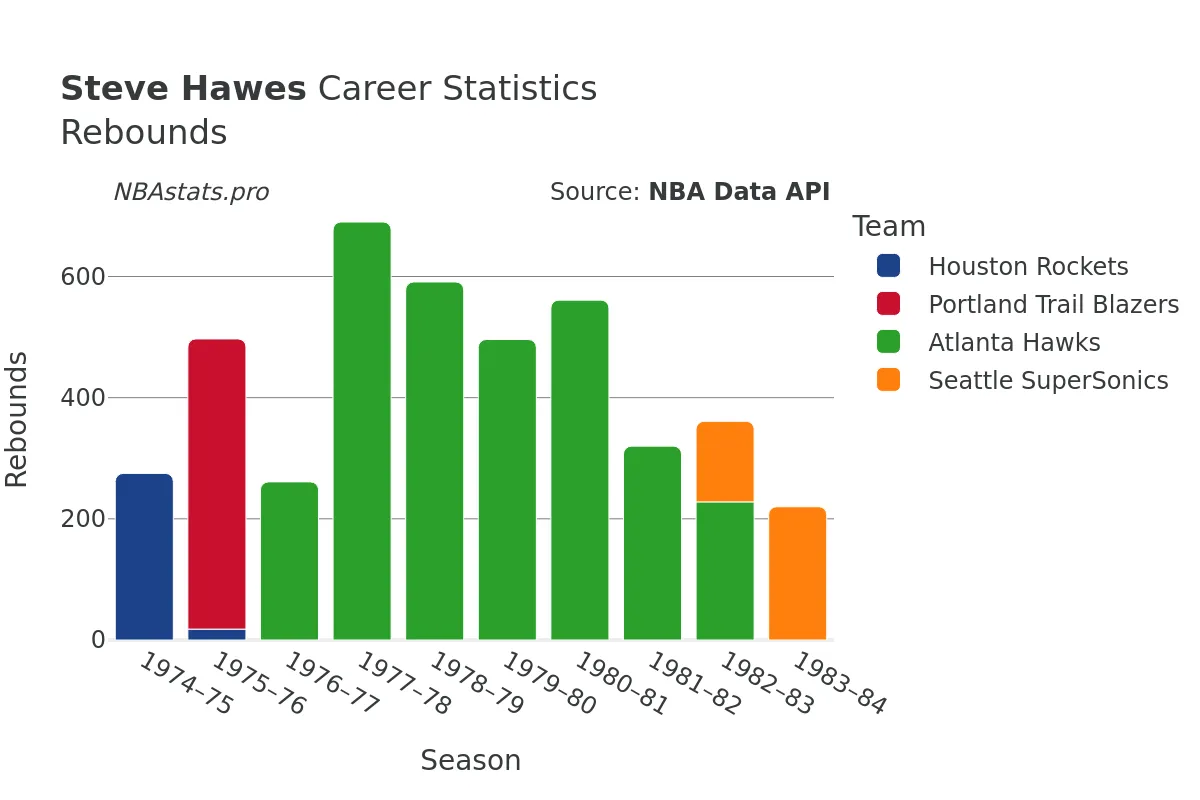
A standout aspect of Hawes' game was his prowess on the glass. Throughout his career, he hauled in a total of 5,130 rebounds, with 3,646 coming on the defensive end and 1,484 on the offensive end. His ability to crash the boards and secure crucial possessions for his team made him a valuable asset on both ends of the floor.
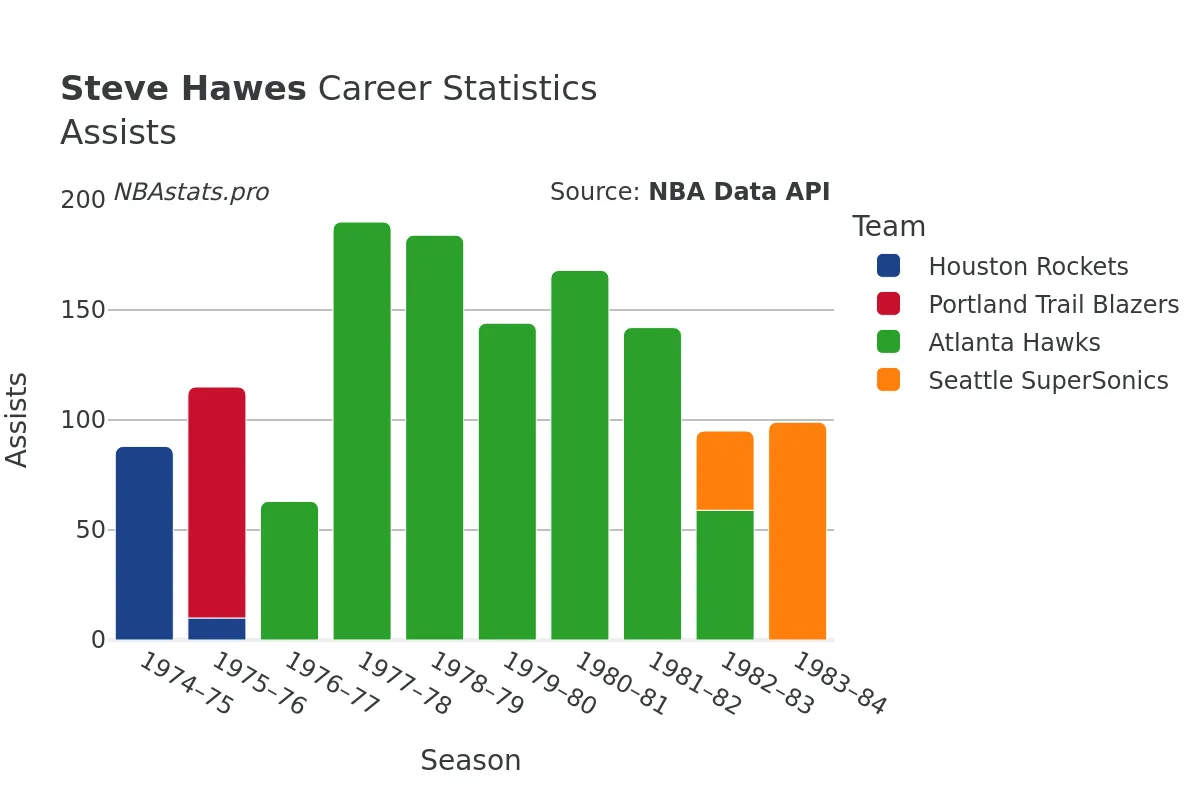
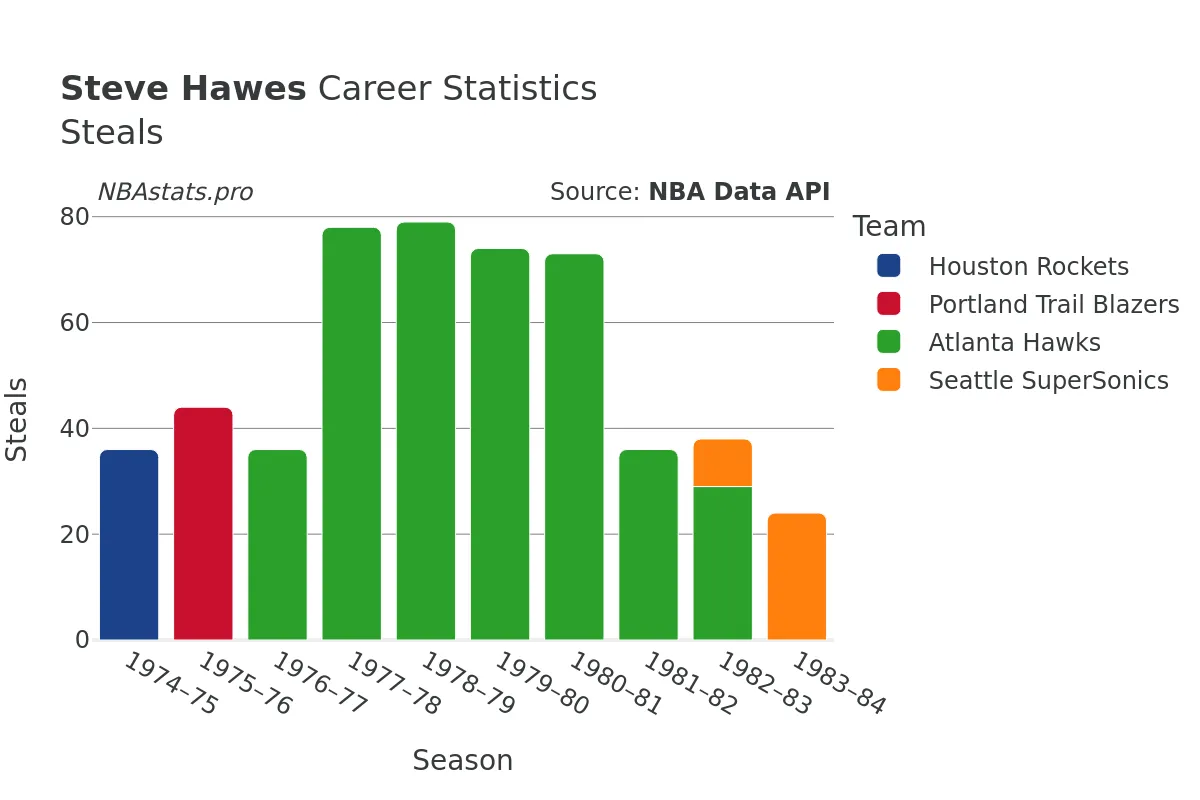
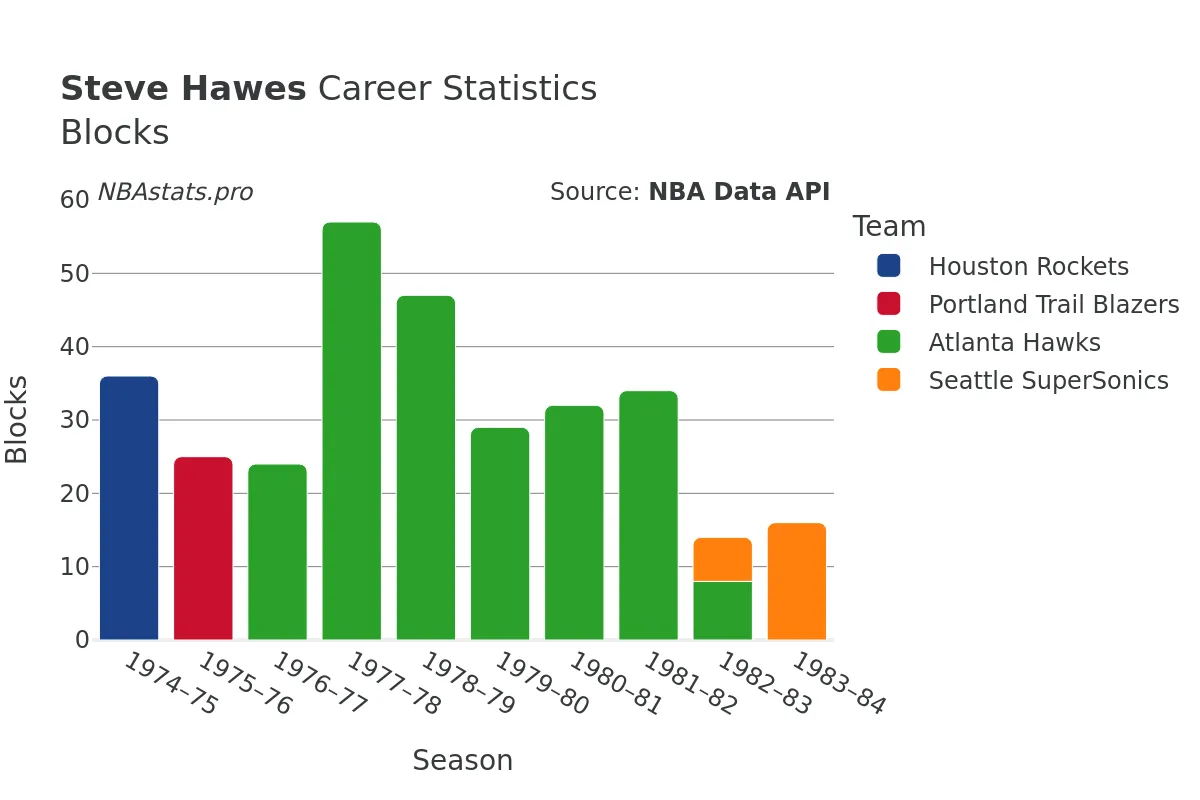
When it came to facilitating the offense, Hawes proved to be more than just a scoring threat. He dished out an impressive 1,498 assists over the course of his career, showcasing his court vision and playmaking abilities. Additionally, his defensive contributions were notable, as evidenced by his 600 steals and 353 blocks, demonstrating his ability to disrupt the opposing team's offense and protect the rim when needed.
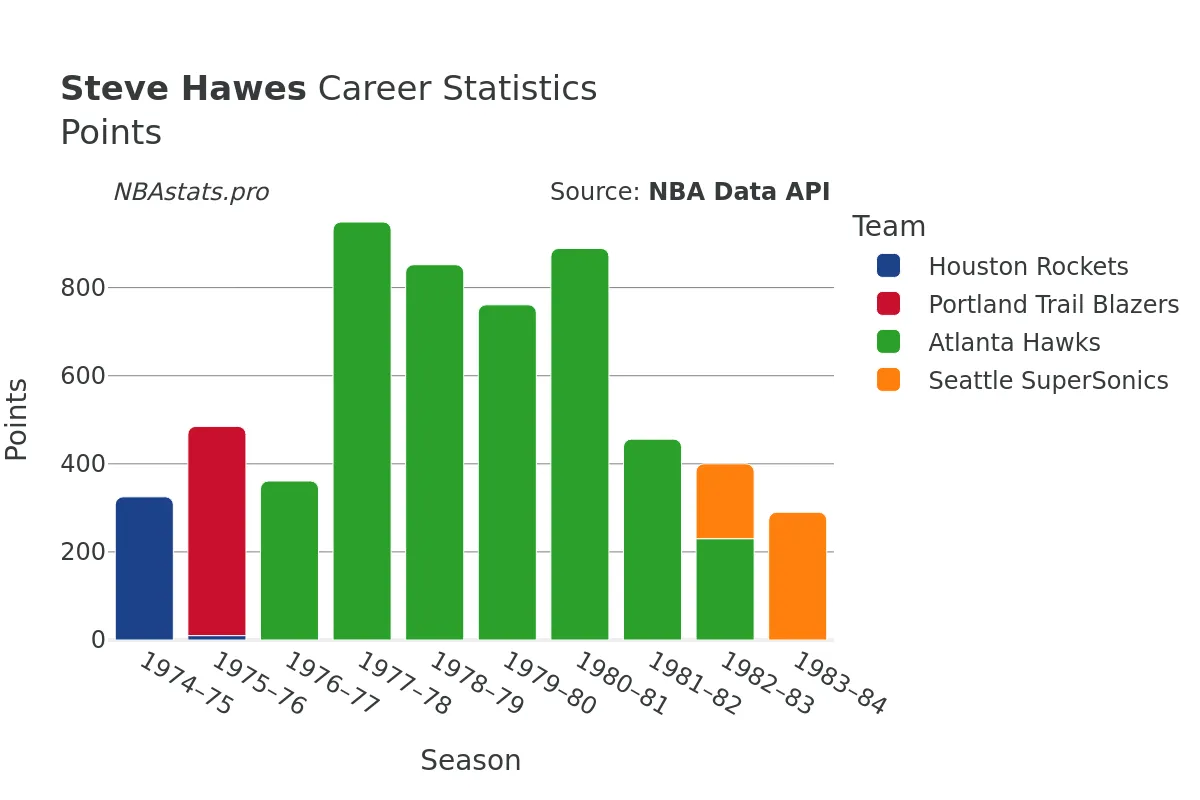
In terms of scoring, Hawes totaled 6,653 points throughout his time in the NBA, highlighting his ability to put the ball in the basket consistently. His well-rounded game, encompassing scoring, rebounding, passing, and defense, made him a valuable and integral part of the teams he played for.
As we delve deeper into the numbers and charts that encapsulate Steve Hawes' career, we are presented with a wealth of data that paints a vivid picture of his impact on the court. From his shooting efficiency to his rebounding tenacity and defensive prowess, every statistic tells a story of a player who approached the game with skill, determination, and a relentless work ethic.
For fans of the game looking to gain a deeper understanding of the intricacies of Hawes' playing style and contributions to his teams, exploring the detailed statistics and charts associated with his career will undoubtedly provide valuable insights and shed light on the legacy he left behind in the NBA.
Join us as we take a closer look at the numbers behind the game, unraveling the tale of Steve Hawes' basketball journey and the impact he made on the teams and cities he represented throughout his remarkable career.
Read more
Games Played
Points
Assists
Rebounds
Steals
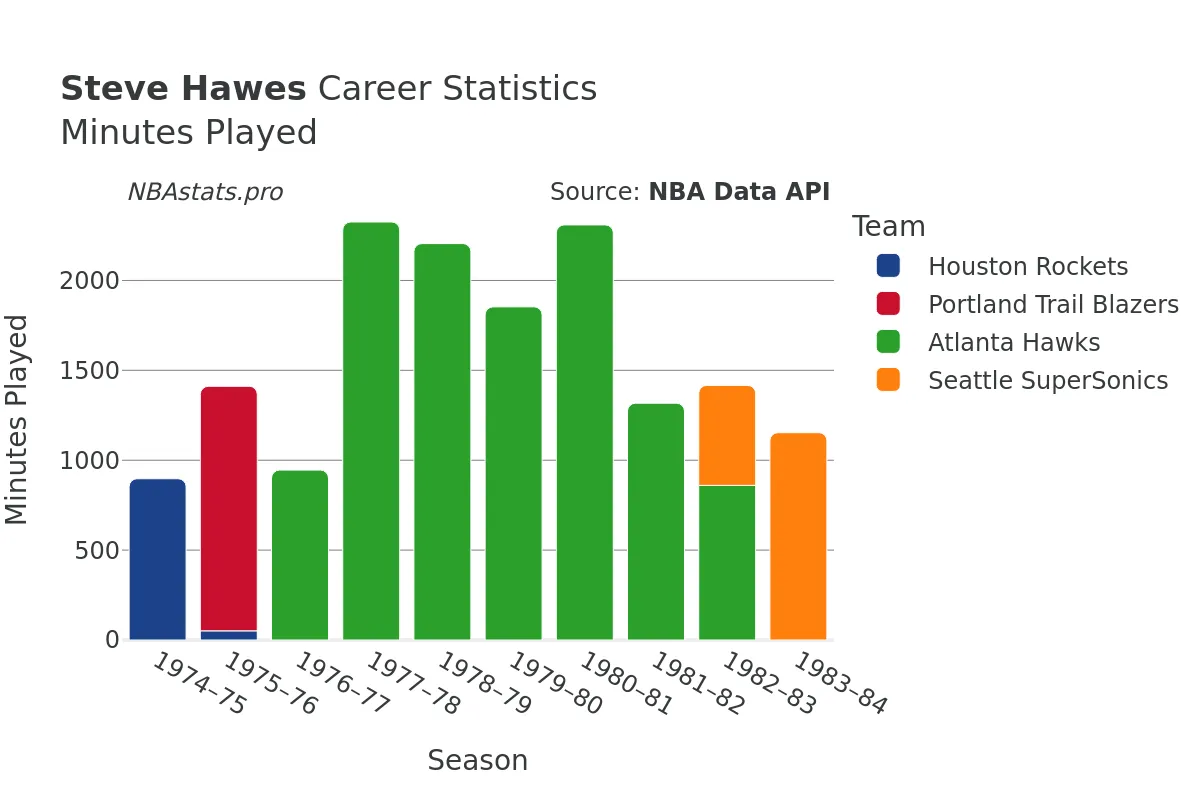
Minutes Played
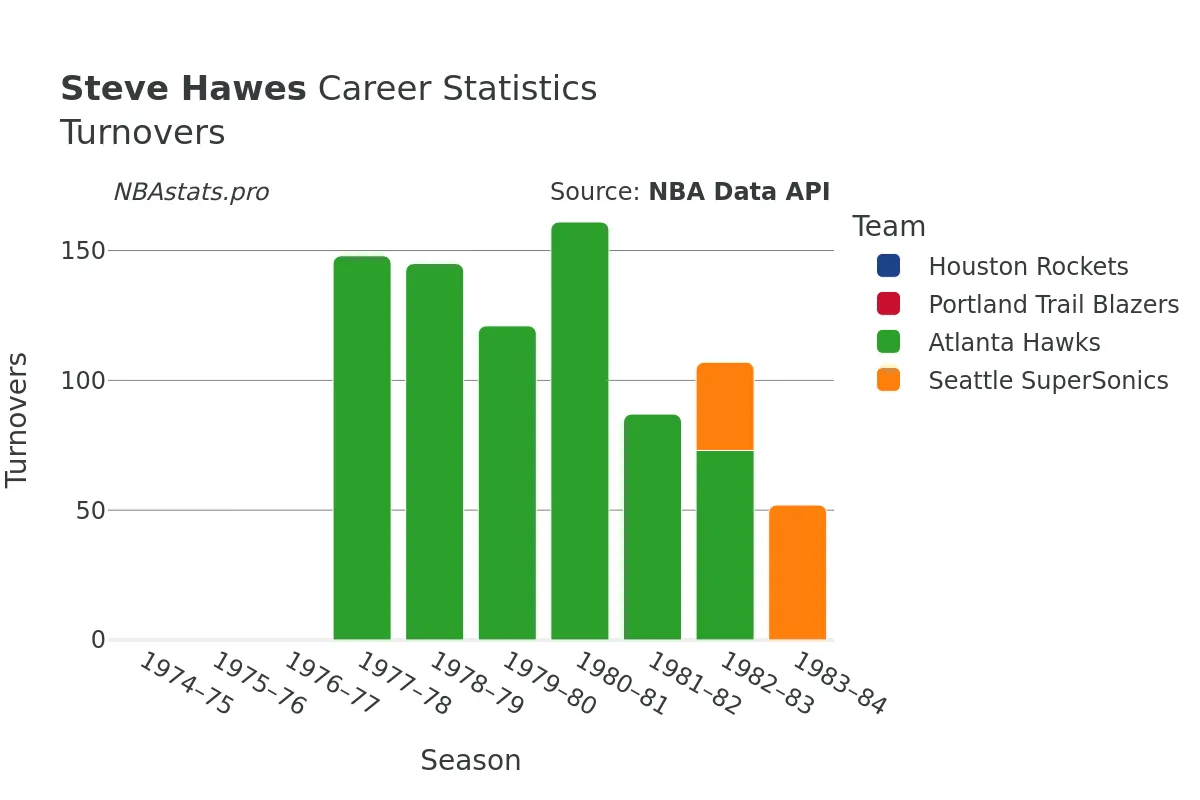
Turnovers
Blocks
Steve Hawes Career Stats Table
| SEASON | TEAM | AGE | GP | GS | MIN | FGM | FGA | FG % | FG3M | FG3A | FG3 % | FTM | FTA | FT % | OREB | DREB | REB | AST | STL | BLK | TOV | PF | PTS | |
|---|---|---|---|---|---|---|---|---|---|---|---|---|---|---|---|---|---|---|---|---|---|---|---|---|
| 1 | 1974-75 | HOU | 25 | 55 | nan | 897 | 140 | 279 | 50.2% | nan | nan | nan% | 45 | 55 | 81.8% | 80 | 195 | 275 | 88 | 36 | 36 | nan | 99 | 325 |
| 2 | 1975-76 | HOU | 26 | 6 | nan | 51 | 5 | 13 | 38.5% | nan | nan | nan% | 0 | 0 | 0.0% | 5 | 13 | 18 | 10 | 0 | 0 | nan | 6 | 10 |
| 3 | 1975-76 | POR | 26 | 66 | nan | 1,360 | 194 | 390 | 49.7% | nan | nan | nan% | 87 | 120 | 72.5% | 166 | 313 | 479 | 105 | 44 | 25 | nan | 163 | 475 |
| 4 | 1975-76 | TOT | 26 | 72 | nan | 1,411 | 199 | 403 | 49.4% | nan | nan | nan% | 87 | 120 | 72.5% | 171 | 326 | 497 | 115 | 44 | 25 | nan | 169 | 485 |
| 5 | 1976-77 | ATL | 27 | 44 | nan | 945 | 147 | 305 | 48.2% | nan | nan | nan% | 67 | 88 | 76.1% | 78 | 183 | 261 | 63 | 36 | 24 | nan | 141 | 361 |
| 6 | 1977-78 | ATL | 28 | 75 | nan | 2,325 | 387 | 854 | 45.3% | nan | nan | nan% | 175 | 214 | 81.8% | 180 | 510 | 690 | 190 | 78 | 57 | 148 | 230 | 949 |
| 7 | 1978-79 | ATL | 29 | 81 | nan | 2,205 | 372 | 756 | 49.2% | nan | nan | nan% | 108 | 132 | 81.8% | 190 | 401 | 591 | 184 | 79 | 47 | 145 | 264 | 852 |
| 8 | 1979-80 | ATL | 30 | 82 | nan | 1,853 | 304 | 605 | 50.2% | 3 | 8 | 37.5% | 150 | 182 | 82.4% | 148 | 348 | 496 | 144 | 74 | 29 | 121 | 205 | 761 |
| 9 | 1980-81 | ATL | 31 | 74 | nan | 2,309 | 333 | 637 | 52.3% | 1 | 4 | 25.0% | 222 | 278 | 79.9% | 165 | 396 | 561 | 168 | 73 | 32 | 161 | 289 | 889 |
| 10 | 1981-82 | ATL | 32 | 49 | 42 | 1,317 | 178 | 370 | 48.1% | 4 | 10 | 40.0% | 96 | 126 | 76.2% | 89 | 231 | 320 | 142 | 36 | 34 | 87 | 156 | 456 |
| 11 | 1982-83 | ATL | 33 | 46 | 3 | 860 | 91 | 244 | 37.3% | 2 | 14 | 14.3% | 46 | 62 | 74.2% | 53 | 175 | 228 | 59 | 29 | 8 | 73 | 110 | 230 |
| 12 | 1982-83 | SEA | 33 | 31 | 1 | 556 | 72 | 146 | 49.3% | 3 | 7 | 42.9% | 23 | 32 | 71.9% | 28 | 105 | 133 | 36 | 9 | 6 | 34 | 79 | 170 |
| 13 | 1982-83 | TOT | 33 | 77 | 4 | 1,416 | 163 | 390 | 41.8% | 5 | 21 | 23.8% | 69 | 94 | 73.4% | 81 | 280 | 361 | 95 | 38 | 14 | 107 | 189 | 400 |
| 14 | 1983-84 | SEA | 34 | 79 | 0 | 1,153 | 114 | 237 | 48.1% | 1 | 4 | 25.0% | 61 | 78 | 78.2% | 50 | 170 | 220 | 99 | 24 | 16 | 52 | 144 | 290 |
Max Min
NBA Alltime Leaders
Games Played
Robert Parish: 1,611Kareem Abdul-Jabbar: 1,560
Vince Carter: 1,541
Dirk Nowitzki: 1,522
John Stockton: 1,504
Points
LeBron James: 40,474Kareem Abdul-Jabbar: 38,387
Karl Malone: 36,928
Kobe Bryant: 33,643
Michael Jordan: 32,292
Steals
John Stockton: 3,265Jason Kidd: 2,684
Chris Paul: 2,614
Michael Jordan: 2,514
Gary Payton: 2,445
Free Throws Made
Karl Malone: 9,787Moses Malone: 8,531
LeBron James: 8,390
Kobe Bryant: 8,378
Oscar Robertson: 7,694