Ron Anderson Stats: NBA Career

Ron Anderson may not be a household name for casual basketball fans, but for those who truly understand the game and appreciate the grit and determination of a true competitor, his legacy is worth recognizing. Over the span of a decade in the NBA, Anderson showcased his skills and versatility while playing for five different teams, leaving an indelible mark on each franchise he represented.
Anderson's NBA journey began in the 1984-85 season when he made his debut at the age of 26 with the Cleve...land Cavaliers. From there, he went on to suit up for the Indiana Pacers, Philadelphia 76ers, Brooklyn Nets, and Washington Wizards, showcasing his ability to adapt to different systems and contributing in various roles throughout his career.
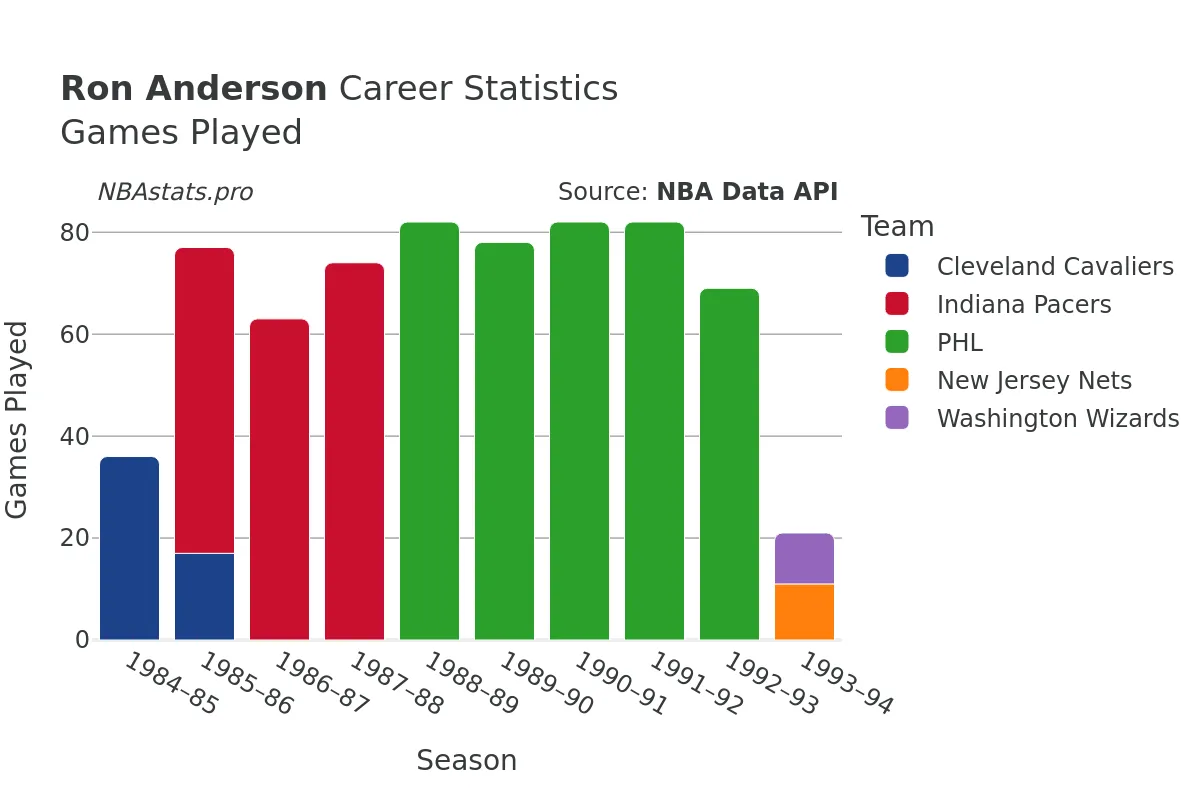
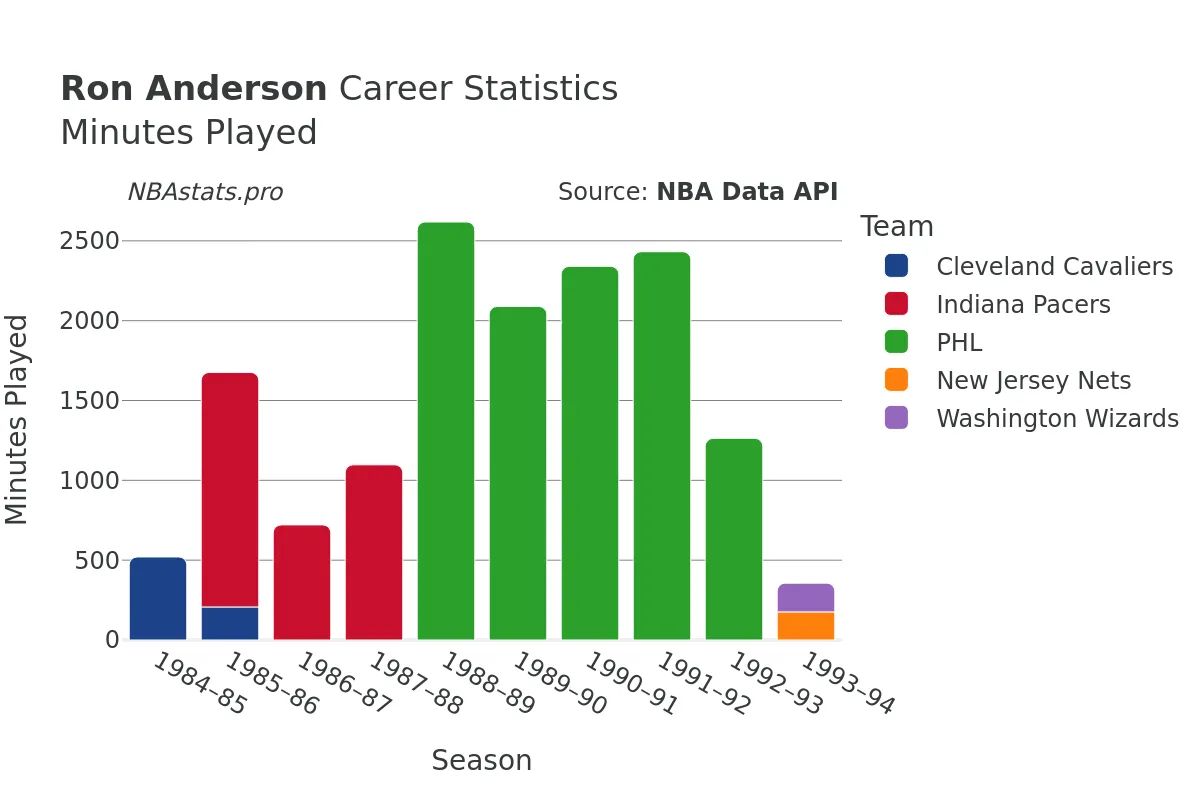
Standing at 6 feet 7 inches, Anderson was a forward known for his scoring prowess and tenacious rebounding abilities. Over the course of his career, he played a total of 762 games, amassing an impressive 17,144 minutes on the court. His offensive impact was undeniable, with 3,281 field goals made out of 6,953 attempted, boasting an impressive field goal percentage of 47.1%.
When it came to his free throw shooting, Anderson was just as reliable, sinking 1,183 out of 1,475 attempts, showcasing his consistency and composure from the charity stripe. His ability to score efficiently from both inside and outside the paint made him a valuable asset to any team he played for.
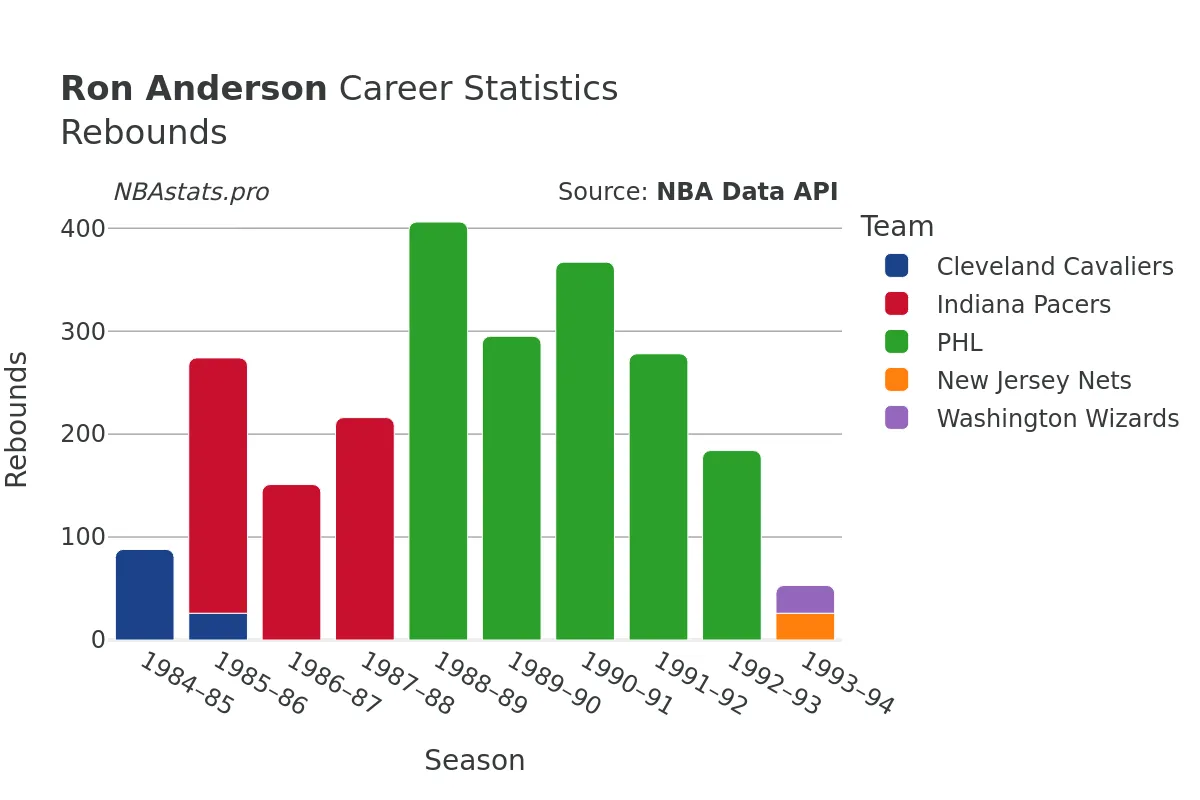
While Anderson's offensive contributions were significant, his impact was not limited to scoring alone. A tenacious rebounder, he pulled down a total of 2,639 rebounds during his career, with 1,637 coming on the defensive end and 1,002 on the offensive glass. His presence in the paint and ability to create second-chance opportunities for his team made him a force to be reckoned with under the boards.
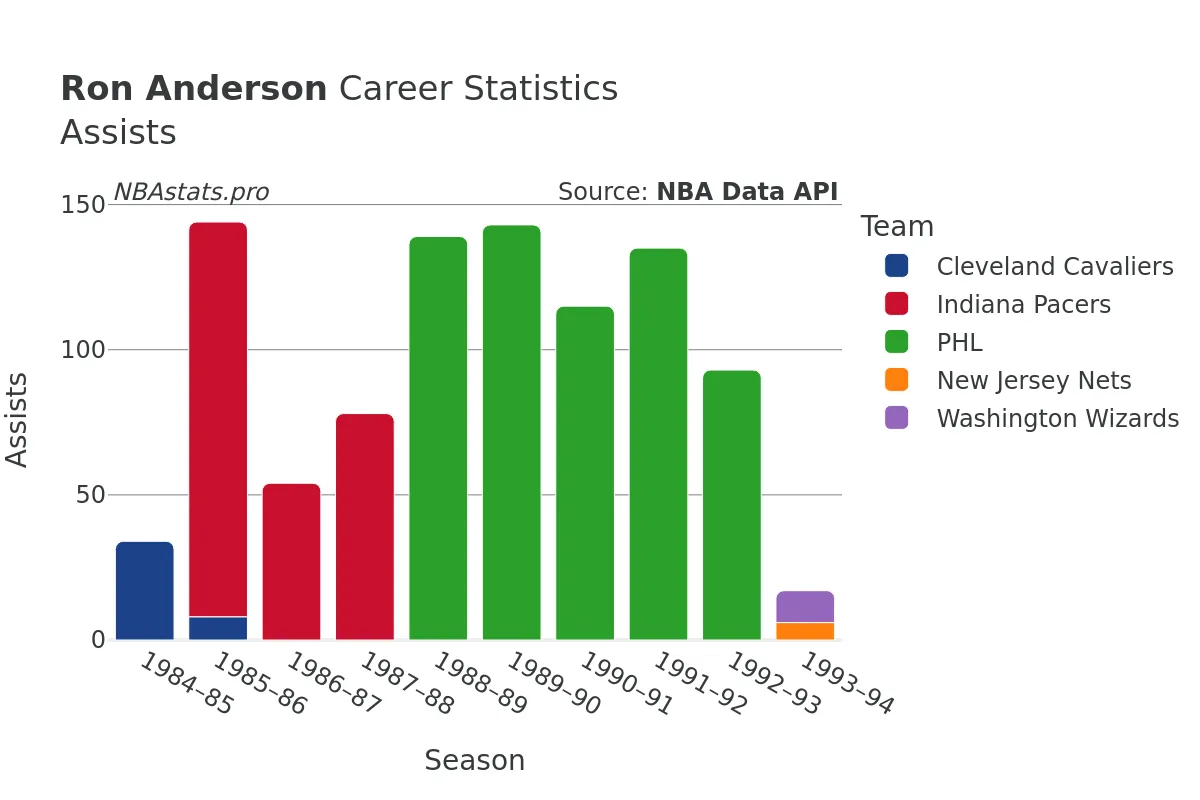
In addition to his scoring and rebounding prowess, Anderson also showcased his playmaking abilities, dishing out 1,113 assists over the course of his career. His court vision and ability to set up his teammates for scoring opportunities added another dimension to his game, making him a well-rounded player on both ends of the floor.
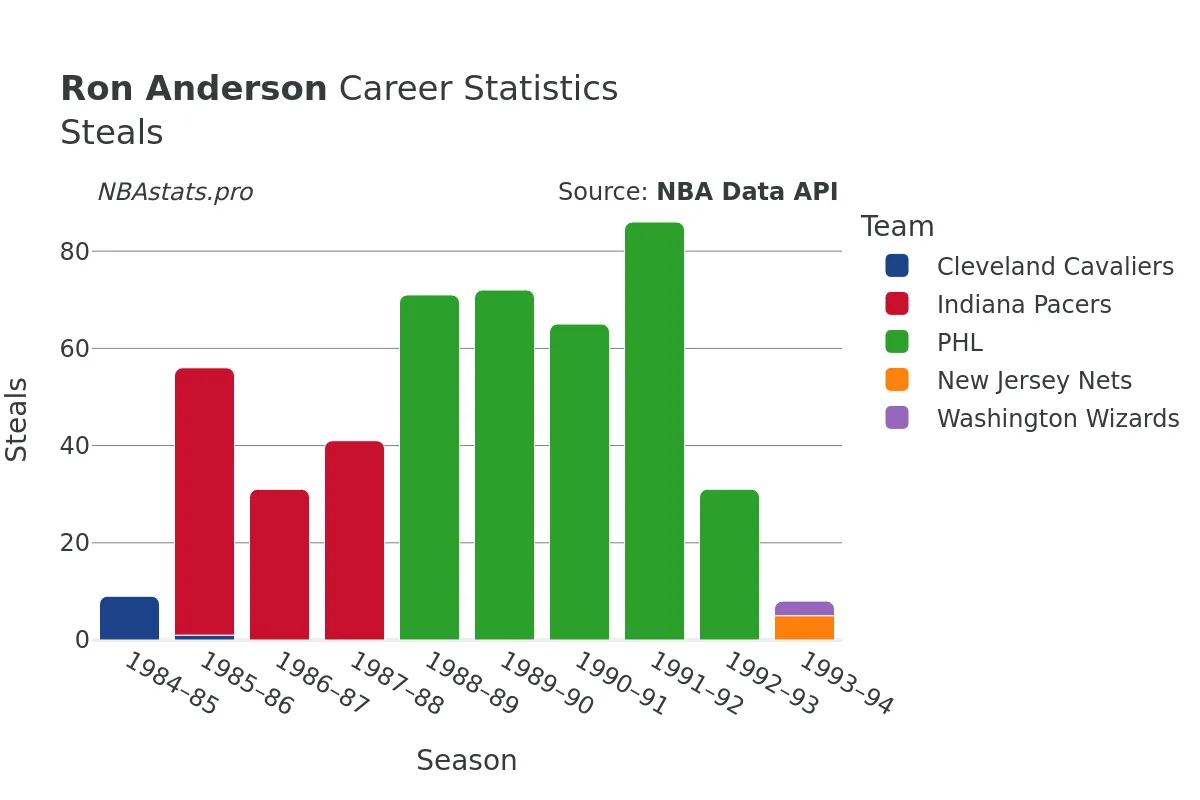
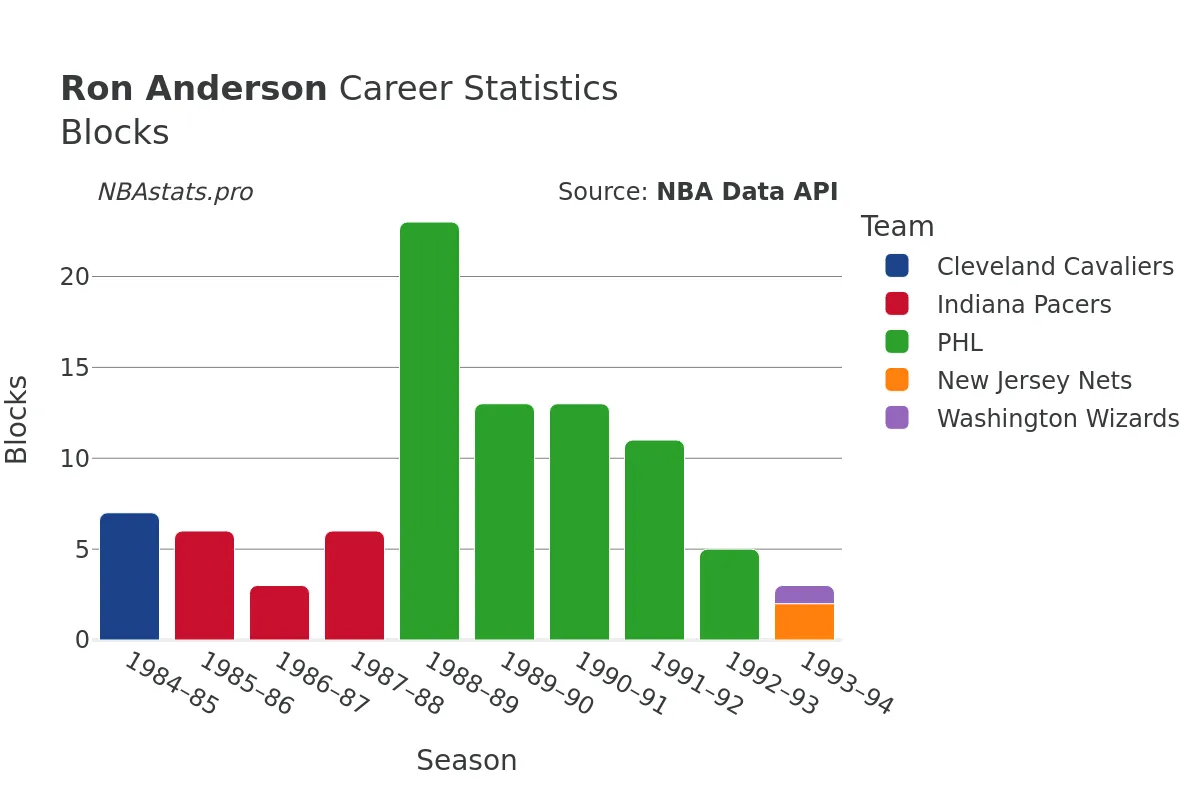
Defensively, Anderson was a disruptor, tallying 534 steals and 99 blocks throughout his career. His ability to anticipate plays, create turnovers, and protect the rim showcased his commitment to making an impact on both ends of the floor.
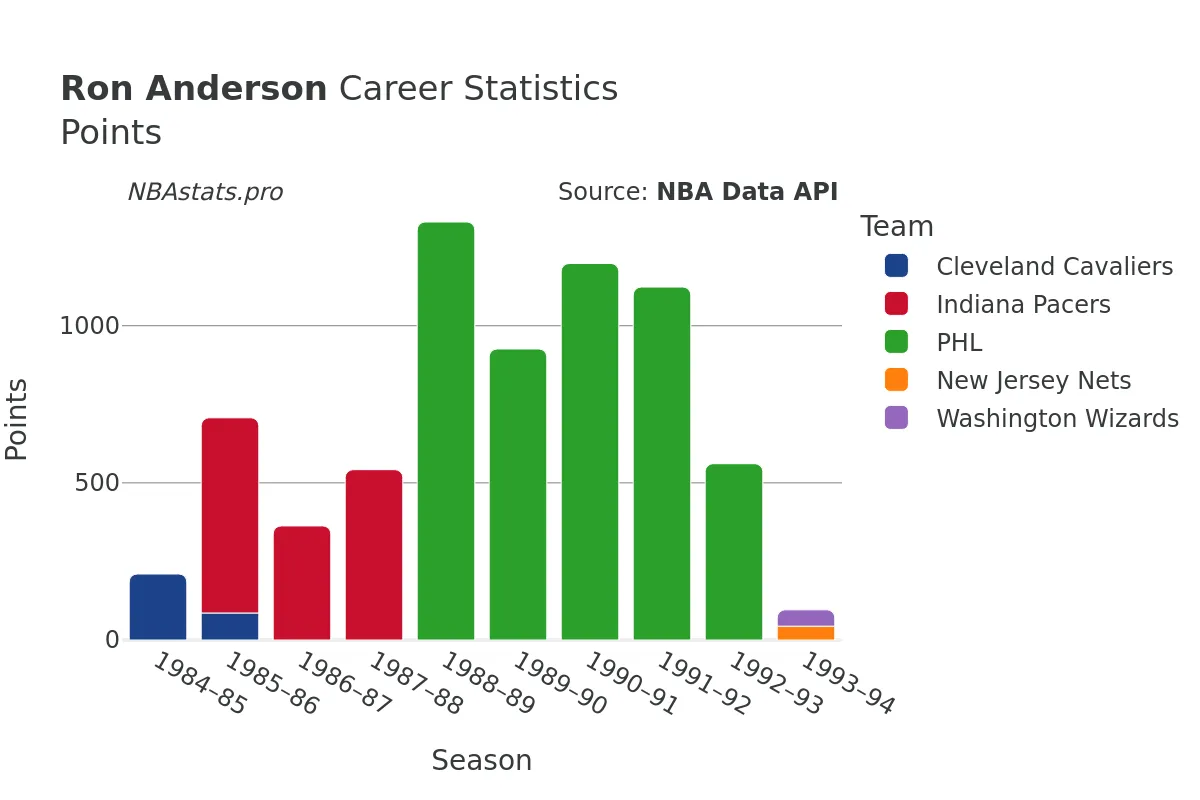
In total, Anderson amassed 7,859 points throughout his career, leaving a lasting impression with his scoring ability, rebounding tenacity, playmaking skills, and defensive prowess. Although he may not have been a perennial All-Star, his contributions to the game and the teams he played for are undeniable.
As you delve deeper into the statistics and charts that highlight Ron Anderson's career, you'll gain a greater appreciation for the skill, dedication, and passion he brought to the court every time he laced up his sneakers. His journey through the NBA serves as a reminder of the talent and depth of each player's contribution to the rich tapestry of basketball history.
Read more
Games Played
Points
Assists
Rebounds
Steals
Minutes Played
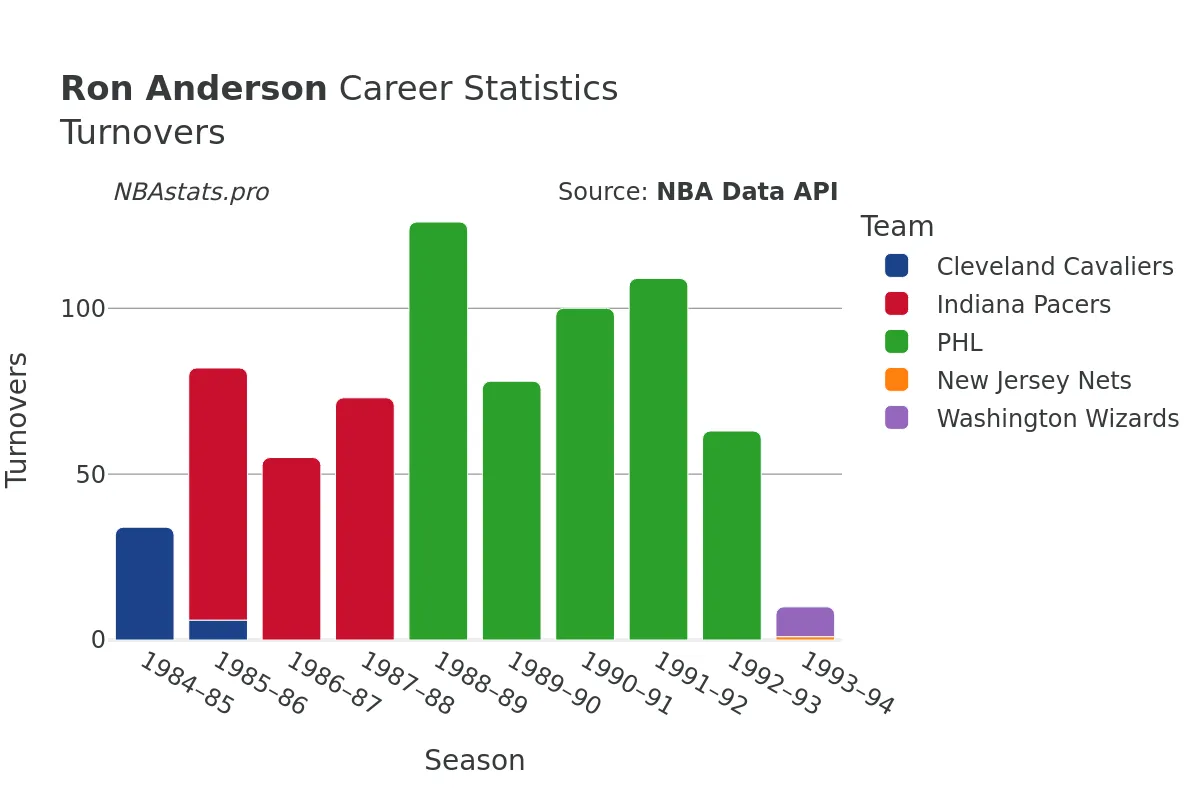
Turnovers
Blocks
Ron Anderson Career Stats Table
| SEASON | TEAM | AGE | GP | GS | MIN | FGM | FGA | FG % | FG3M | FG3A | FG3 % | FTM | FTA | FT % | OREB | DREB | REB | AST | STL | BLK | TOV | PF | PTS | |
|---|---|---|---|---|---|---|---|---|---|---|---|---|---|---|---|---|---|---|---|---|---|---|---|---|
| 1 | 1984-85 | CLE | 26 | 36 | 7 | 520 | 84 | 195 | 43.1% | 1 | 2 | 50.0% | 41 | 50 | 82.0% | 39 | 49 | 88 | 34 | 9 | 7 | 34 | 40 | 210 |
| 2 | 1985-86 | CLE | 27 | 17 | 3 | 207 | 37 | 74 | 50.0% | 0 | 1 | 0.0% | 12 | 16 | 75.0% | 5 | 21 | 26 | 8 | 1 | 0 | 6 | 20 | 86 |
| 3 | 1985-86 | IND | 27 | 60 | 27 | 1,469 | 273 | 554 | 49.3% | 2 | 8 | 25.0% | 73 | 111 | 65.8% | 125 | 123 | 248 | 136 | 55 | 6 | 76 | 105 | 621 |
| 4 | 1985-86 | TOT | 27 | 77 | 30 | 1,676 | 310 | 628 | 49.4% | 2 | 9 | 22.2% | 85 | 127 | 66.9% | 130 | 144 | 274 | 144 | 56 | 6 | 82 | 125 | 707 |
| 5 | 1986-87 | IND | 28 | 63 | 0 | 721 | 139 | 294 | 47.3% | 0 | 5 | 0.0% | 85 | 108 | 78.7% | 73 | 78 | 151 | 54 | 31 | 3 | 55 | 65 | 363 |
| 6 | 1987-88 | IND | 29 | 74 | 1 | 1,097 | 217 | 436 | 49.8% | 0 | 2 | 0.0% | 108 | 141 | 76.6% | 89 | 127 | 216 | 78 | 41 | 6 | 73 | 98 | 542 |
| 7 | 1988-89 | PHL | 30 | 82 | 12 | 2,618 | 566 | 1,152 | 49.1% | 2 | 11 | 18.2% | 196 | 229 | 85.6% | 167 | 239 | 406 | 139 | 71 | 23 | 126 | 166 | 1,330 |
| 8 | 1989-90 | PHL | 31 | 78 | 3 | 2,089 | 379 | 841 | 45.1% | 3 | 21 | 14.3% | 165 | 197 | 83.8% | 81 | 214 | 295 | 143 | 72 | 13 | 78 | 143 | 926 |
| 9 | 1990-91 | PHL | 32 | 82 | 13 | 2,340 | 512 | 1,055 | 48.5% | 9 | 43 | 20.9% | 165 | 198 | 83.3% | 103 | 264 | 367 | 115 | 65 | 13 | 100 | 163 | 1,198 |
| 10 | 1991-92 | PHL | 33 | 82 | 11 | 2,432 | 469 | 1,008 | 46.5% | 42 | 127 | 33.1% | 143 | 163 | 87.7% | 96 | 182 | 278 | 135 | 86 | 11 | 109 | 128 | 1,123 |
| 11 | 1992-93 | PHL | 34 | 69 | 0 | 1,263 | 225 | 544 | 41.4% | 39 | 120 | 32.5% | 72 | 89 | 80.9% | 62 | 122 | 184 | 93 | 31 | 5 | 63 | 75 | 561 |
| 12 | 1993-94 | NJN | 35 | 11 | 2 | 176 | 15 | 43 | 34.9% | 4 | 12 | 33.3% | 10 | 12 | 83.3% | 8 | 18 | 26 | 6 | 5 | 2 | 1 | 9 | 44 |
| 13 | 1993-94 | WAS | 35 | 10 | 0 | 180 | 20 | 43 | 46.5% | 3 | 14 | 21.4% | 9 | 11 | 81.8% | 8 | 19 | 27 | 11 | 3 | 1 | 9 | 7 | 52 |
| 14 | 1993-94 | TOT | 35 | 21 | 2 | 356 | 35 | 86 | 40.7% | 7 | 26 | 26.9% | 19 | 23 | 82.6% | 16 | 37 | 53 | 17 | 8 | 3 | 10 | 16 | 96 |
Max Min
NBA Alltime Leaders
Games Played
Robert Parish: 1,611Kareem Abdul-Jabbar: 1,560
Vince Carter: 1,541
Dirk Nowitzki: 1,522
John Stockton: 1,504
Points
LeBron James: 40,474Kareem Abdul-Jabbar: 38,387
Karl Malone: 36,928
Kobe Bryant: 33,643
Michael Jordan: 32,292
Steals
John Stockton: 3,265Jason Kidd: 2,684
Chris Paul: 2,614
Michael Jordan: 2,514
Gary Payton: 2,445
Free Throws Made
Karl Malone: 9,787Moses Malone: 8,531
LeBron James: 8,390
Kobe Bryant: 8,378
Oscar Robertson: 7,694