Ray Allen Stats: NBA Career

Ray Allen: The Sharpshooter Extraordinaire
When it comes to pure shooting prowess in the NBA, few players can match the legendary Ray Allen. Throughout his illustrious career, Allen showcased a deadly combination of precision, finesse, and clutch shooting that solidified his status as one of the greatest marksmen the league has ever seen. With stints in four different teams and an array of accomplishments under his belt, Ray Allen's impact on the game of basketball is truly immeasurable.
Ray A...llen began his NBA journey in the 1996-97 season with the Milwaukee Bucks, where he quickly made a name for himself as a dynamic scorer. Known for his smooth shooting stroke and ability to score from anywhere on the court, Allen became a feared offensive weapon for opposing teams. His tenure with the Bucks laid the foundation for what would be a remarkable career spanning nearly two decades.
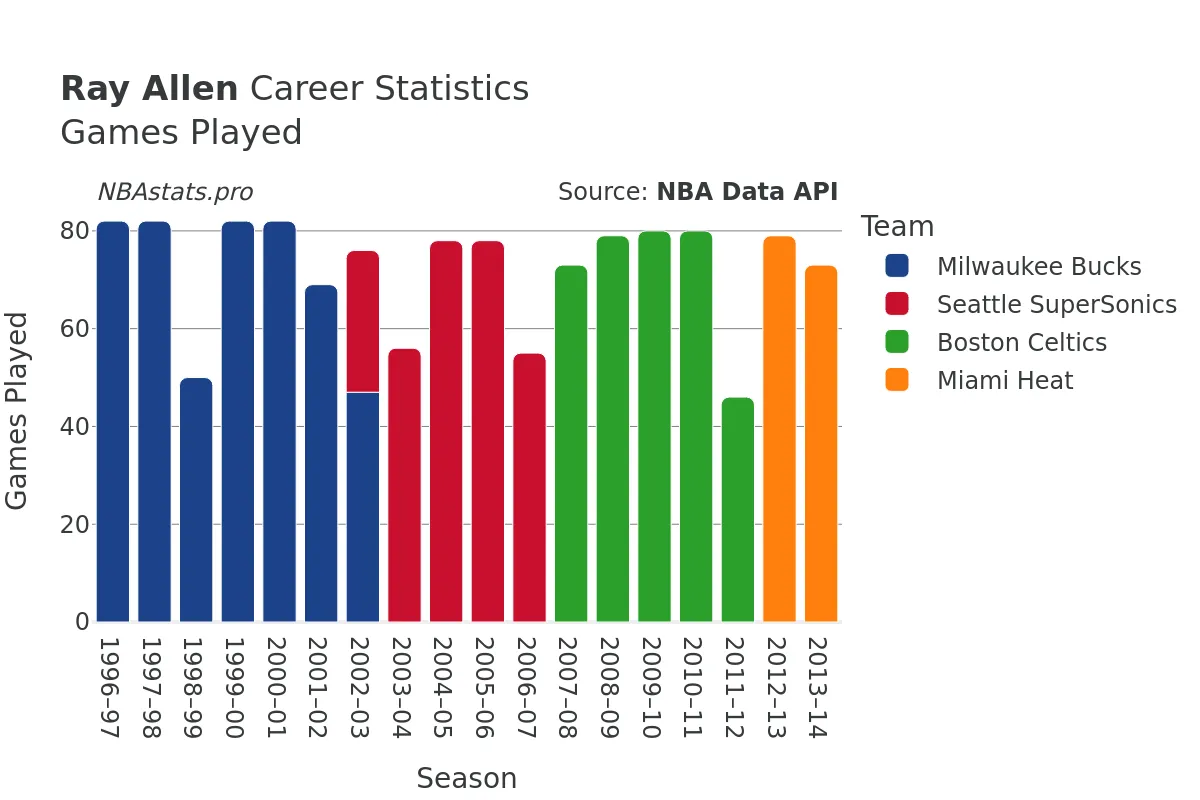
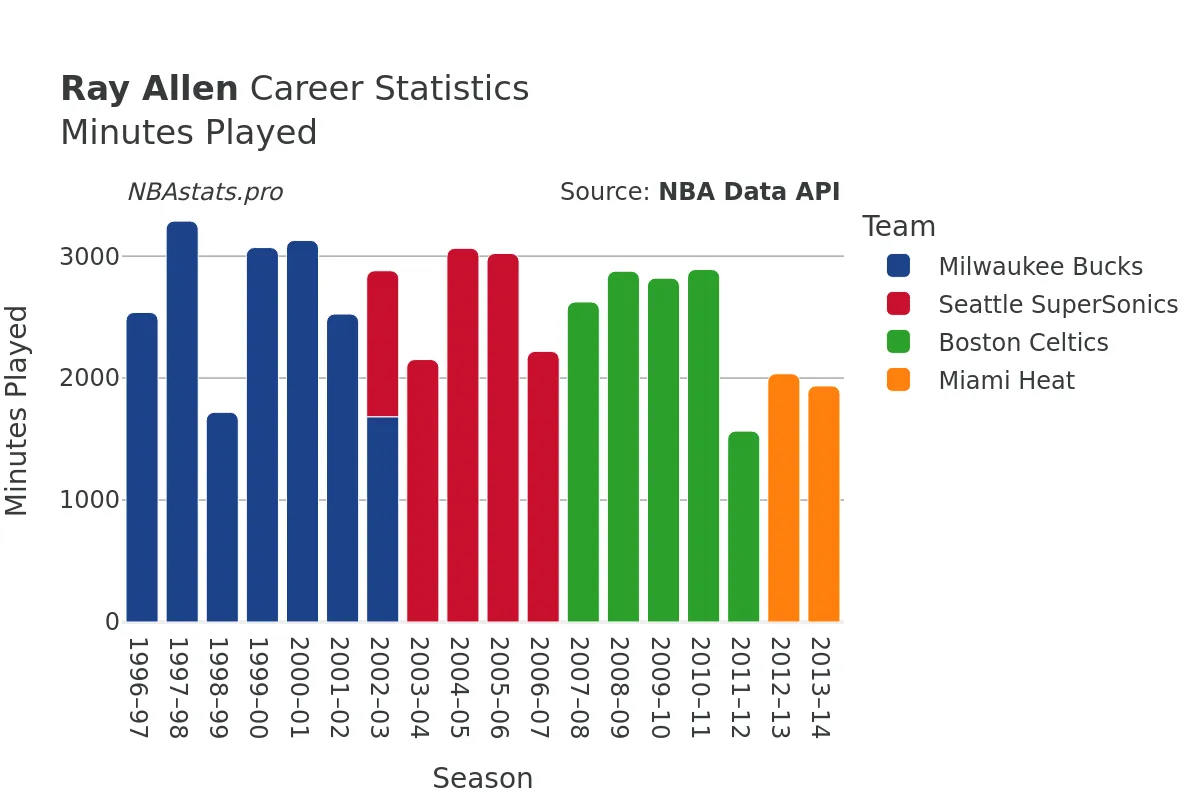
Over the course of his career, Ray Allen showcased remarkable consistency and durability, appearing in a total of 1376 games and logging an impressive 49,230 minutes on the court. His scoring prowess was evident in his 20,318 field goals attempted, of which he made 9,165, boasting a solid shooting percentage of 45.1%. Allen's ability to knock down shots in crucial moments earned him the reputation of a clutch performer, with countless game-winning shots to his name.
A true marksman from the free-throw line as well, Ray Allen's precision was unmatched. He attempted 5,265 free throws and converted 4,714 of them, translating to an impressive free throw percentage. His dedication to perfecting his craft was evident in every shot he took, making him a reliable scorer in crunch time situations.
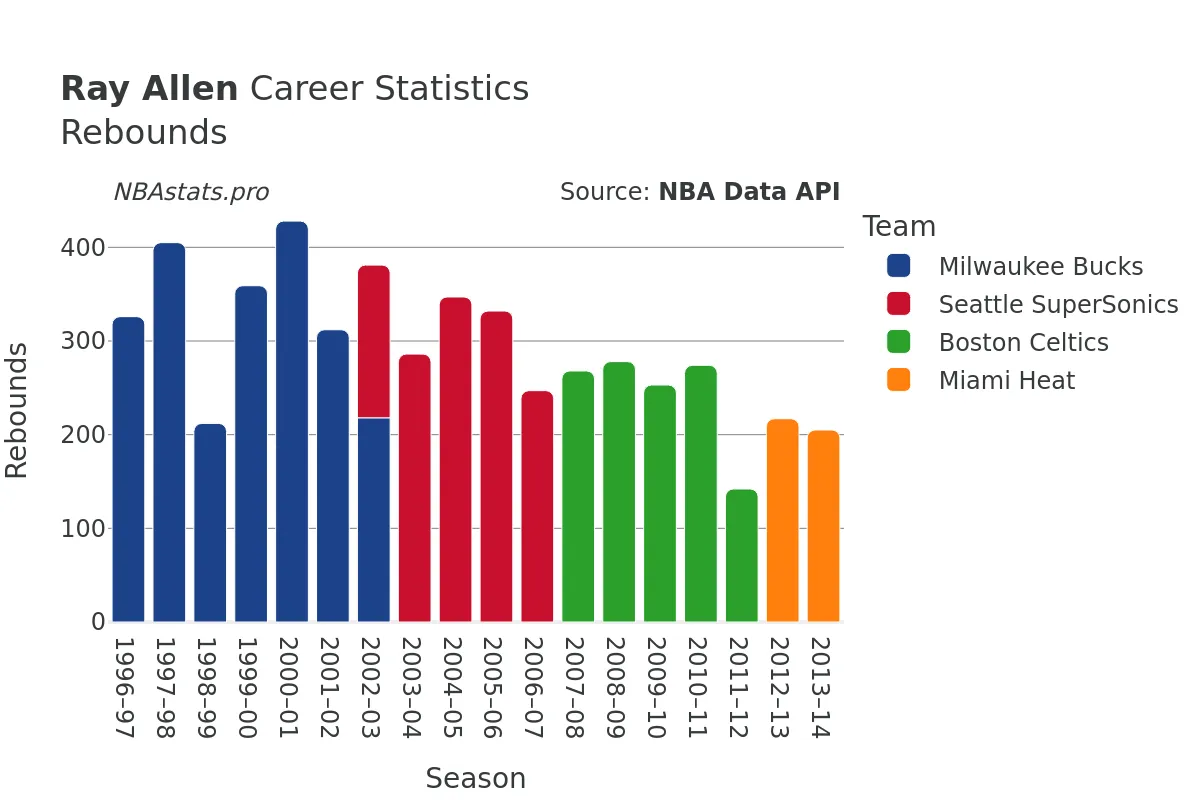
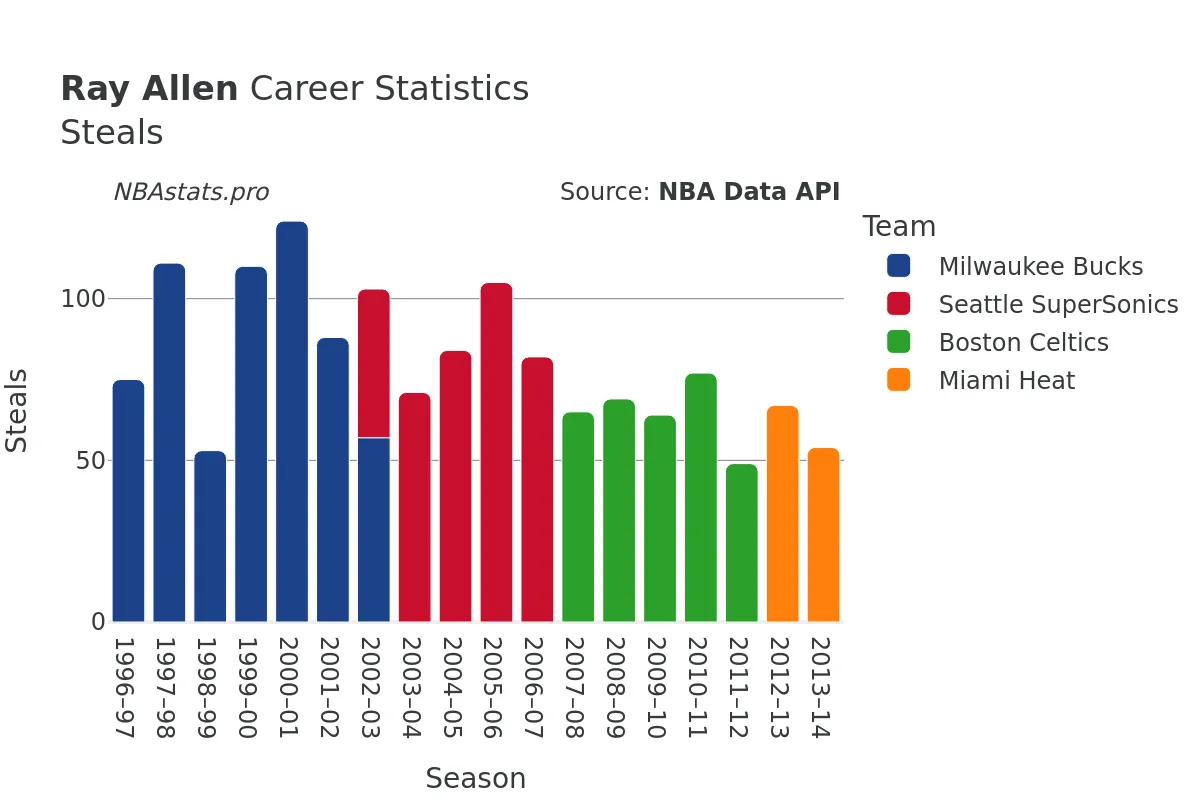
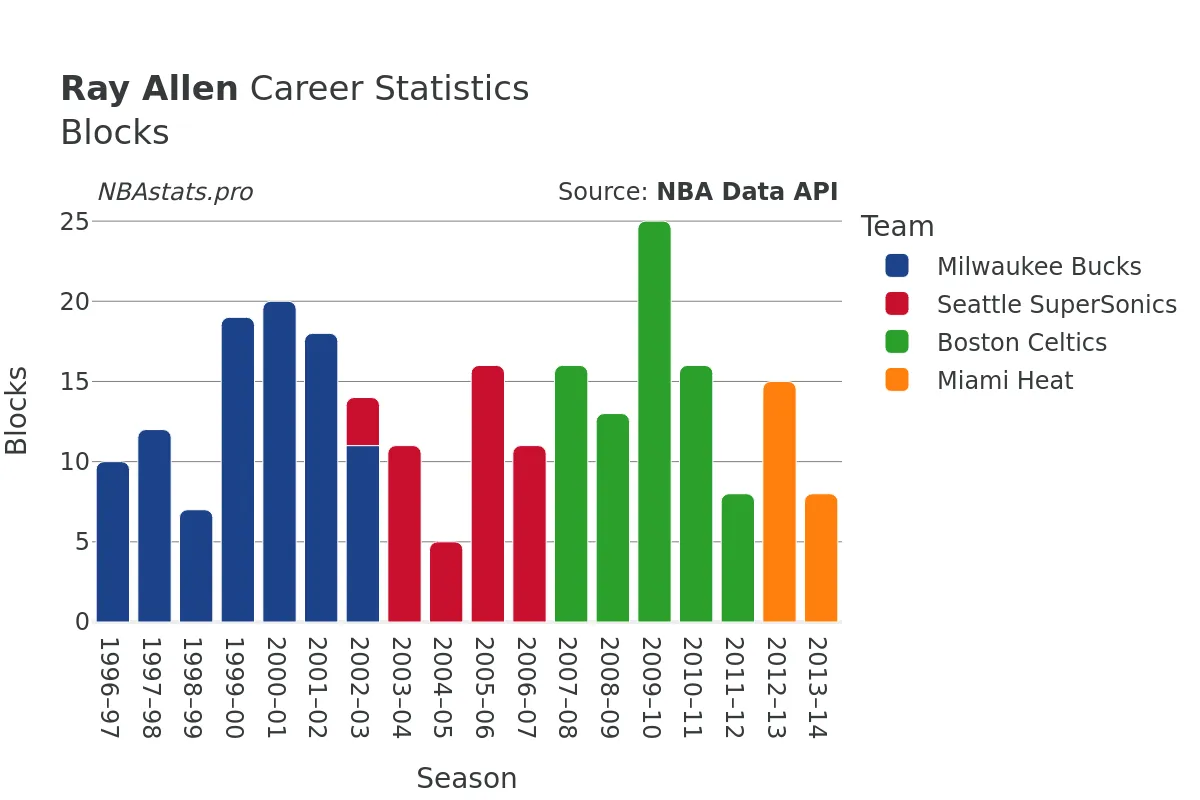
Beyond his scoring abilities, Ray Allen was a well-rounded player who made significant contributions in other facets of the game. His prowess on the boards saw him grab a total of 5,653 rebounds, showcasing his tenacity and versatility on the court. Allen's defensive instincts were also sharp, as evidenced by his 1,554 steals and 258 blocks throughout his career, demonstrating his commitment to making an impact on both ends of the floor.
In addition to his individual achievements, Ray Allen found team success as well, winning championships with the Boston Celtics in 2008 and the Miami Heat in 2013. His ability to elevate his game in the playoffs and deliver stellar performances on the biggest stages solidified his legacy as a future Hall of Famer. Whether it was draining game-winning shots or making crucial defensive stops, Allen always rose to the occasion when his team needed him most.
As a basketball analyst, delving into Ray Allen's career statistics offers a fascinating glimpse into the mind of a player who revolutionized the art of shooting in the NBA. His numbers paint a portrait of a player who was not only exceptionally skilled but also dedicated to continuous improvement and excellence in all aspects of the game. Exploring the intricacies of his stats allows fans and analysts alike to appreciate the magnitude of Allen's impact on the sport and understand why he remains a revered figure in basketball history.
In conclusion, Ray Allen's career is a testament to the power of hard work, determination, and a relentless pursuit of greatness. His influence on the game of basketball extends far beyond the court, inspiring future generations of players to strive for excellence and push the boundaries of what is possible. For those seeking to unravel the story behind the numbers and truly understand the essence of Ray Allen's basketball legacy, delving into his statistics is a journey well worth taking.
Read more
Games Played
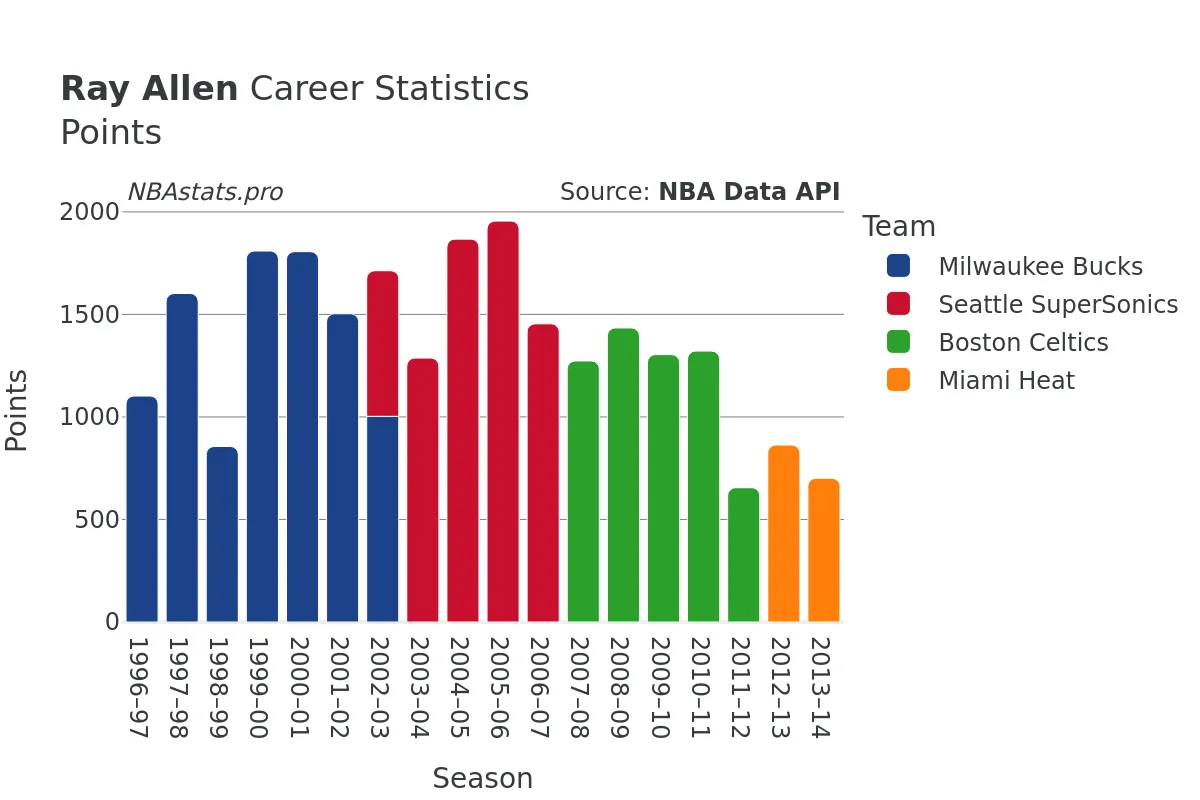
Points
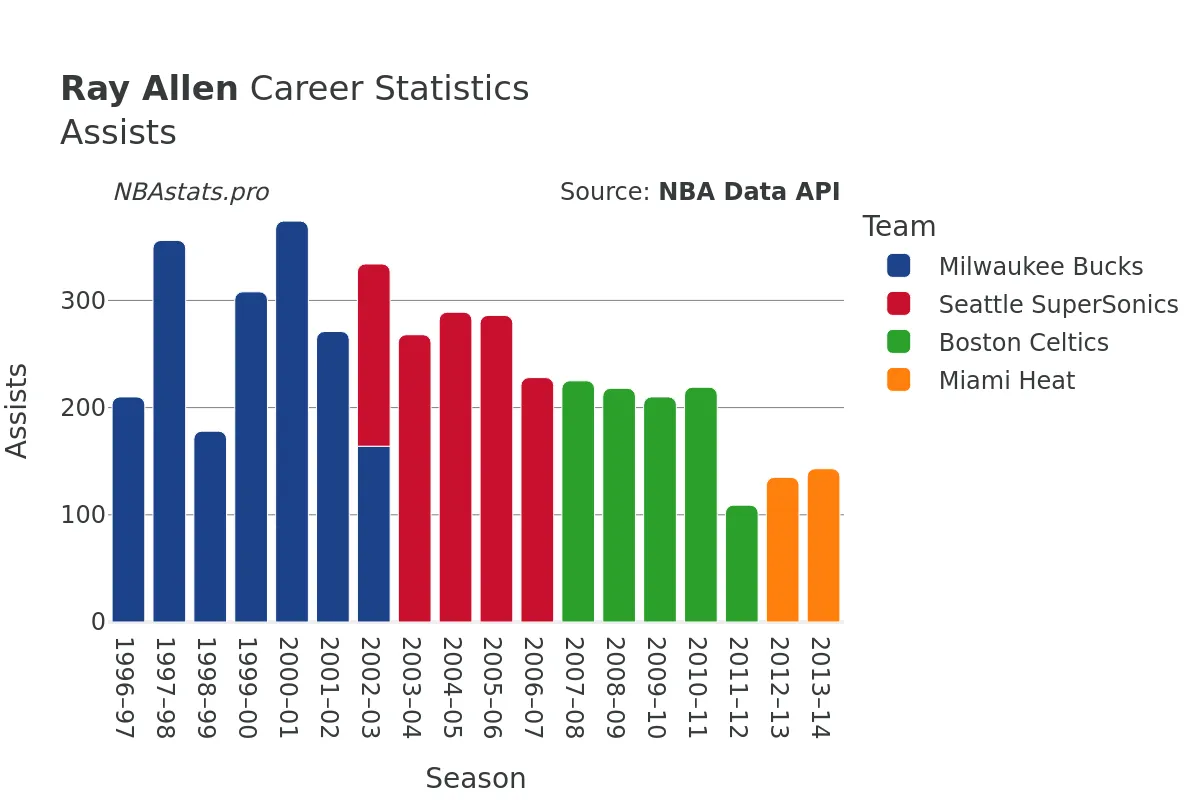
Assists
Rebounds
Steals
Minutes Played
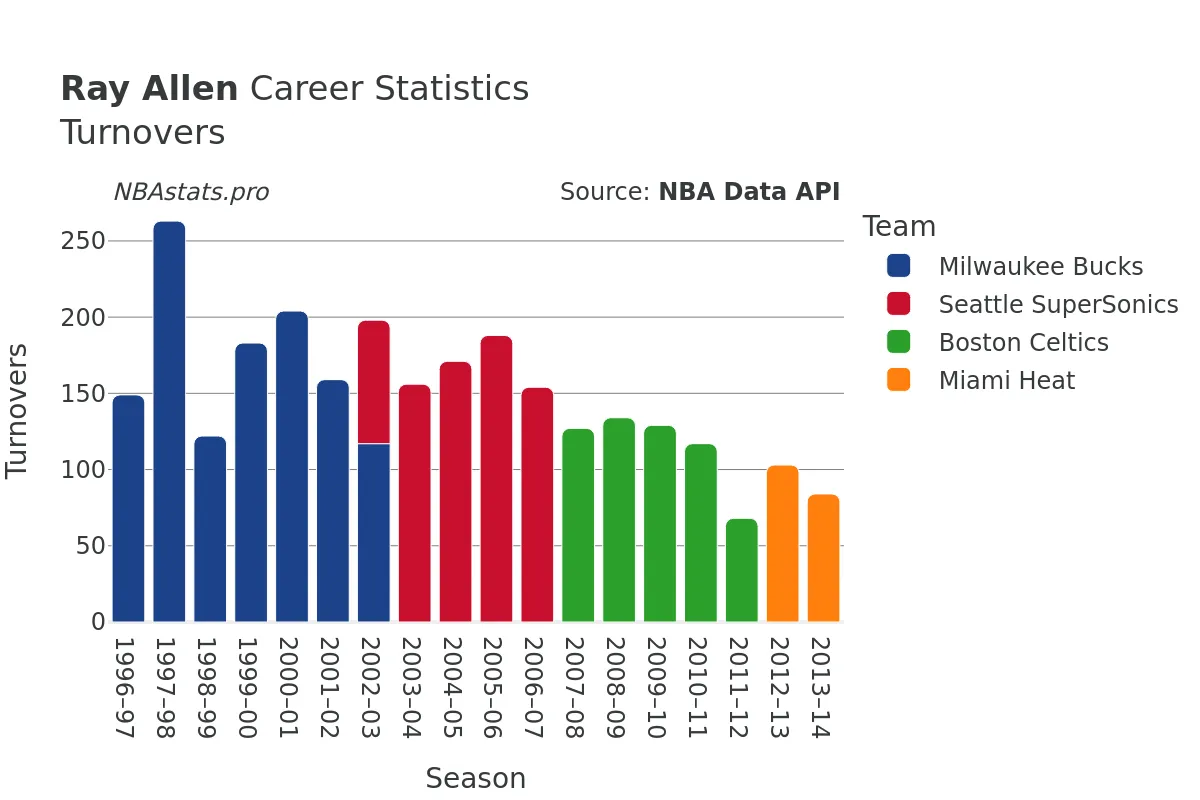
Turnovers
Blocks
Ray Allen Career Stats Table
| SEASON | TEAM | AGE | GP | GS | MIN | FGM | FGA | FG % | FG3M | FG3A | FG3 % | FTM | FTA | FT % | OREB | DREB | REB | AST | STL | BLK | TOV | PF | PTS | |
|---|---|---|---|---|---|---|---|---|---|---|---|---|---|---|---|---|---|---|---|---|---|---|---|---|
| 1 | 1996-97 | MIL | 21 | 82 | 81 | 2,538 | 390 | 908 | 43.0% | 117 | 298 | 39.3% | 205 | 249 | 82.3% | 97 | 229 | 326 | 210 | 75 | 10 | 149 | 218 | 1,102 |
| 2 | 1997-98 | MIL | 22 | 82 | 82 | 3,287 | 563 | 1,315 | 42.8% | 134 | 368 | 36.4% | 342 | 391 | 87.5% | 127 | 278 | 405 | 356 | 111 | 12 | 263 | 244 | 1,602 |
| 3 | 1998-99 | MIL | 23 | 50 | 50 | 1,719 | 303 | 673 | 45.0% | 74 | 208 | 35.6% | 176 | 195 | 90.3% | 57 | 155 | 212 | 178 | 53 | 7 | 122 | 117 | 856 |
| 4 | 1999-00 | MIL | 24 | 82 | 82 | 3,070 | 642 | 1,411 | 45.5% | 172 | 407 | 42.3% | 353 | 398 | 88.7% | 83 | 276 | 359 | 308 | 110 | 19 | 183 | 187 | 1,809 |
| 5 | 2000-01 | MIL | 25 | 82 | 82 | 3,129 | 628 | 1,309 | 48.0% | 202 | 467 | 43.3% | 348 | 392 | 88.8% | 101 | 327 | 428 | 374 | 124 | 20 | 204 | 192 | 1,806 |
| 6 | 2001-02 | MIL | 26 | 69 | 67 | 2,525 | 530 | 1,148 | 46.2% | 229 | 528 | 43.4% | 214 | 245 | 87.3% | 81 | 231 | 312 | 271 | 88 | 18 | 159 | 157 | 1,503 |
| 7 | 2002-03 | MIL | 27 | 47 | 46 | 1,683 | 351 | 803 | 43.7% | 123 | 311 | 39.5% | 178 | 195 | 91.3% | 45 | 173 | 218 | 164 | 57 | 11 | 117 | 149 | 1,003 |
| 8 | 2002-03 | SEA | 27 | 29 | 29 | 1,197 | 247 | 560 | 44.1% | 78 | 222 | 35.1% | 138 | 150 | 92.0% | 49 | 114 | 163 | 170 | 46 | 3 | 81 | 71 | 710 |
| 9 | 2002-03 | TOT | 27 | 76 | 75 | 2,880 | 598 | 1,363 | 43.9% | 201 | 533 | 37.7% | 316 | 345 | 91.6% | 94 | 287 | 381 | 334 | 103 | 14 | 198 | 220 | 1,713 |
| 10 | 2003-04 | SEA | 28 | 56 | 56 | 2,152 | 447 | 1,017 | 44.0% | 148 | 378 | 39.2% | 245 | 271 | 90.4% | 69 | 217 | 286 | 268 | 71 | 11 | 156 | 132 | 1,287 |
| 11 | 2004-05 | SEA | 29 | 78 | 78 | 3,064 | 640 | 1,494 | 42.8% | 209 | 556 | 37.6% | 378 | 428 | 88.3% | 79 | 268 | 347 | 289 | 84 | 5 | 171 | 167 | 1,867 |
| 12 | 2005-06 | SEA | 30 | 78 | 78 | 3,022 | 681 | 1,500 | 45.4% | 269 | 653 | 41.2% | 324 | 359 | 90.3% | 71 | 261 | 332 | 286 | 105 | 16 | 188 | 151 | 1,955 |
| 13 | 2006-07 | SEA | 31 | 55 | 55 | 2,219 | 505 | 1,153 | 43.8% | 165 | 443 | 37.2% | 279 | 309 | 90.3% | 57 | 190 | 247 | 228 | 82 | 11 | 154 | 113 | 1,454 |
| 14 | 2007-08 | BOS | 32 | 73 | 73 | 2,624 | 439 | 986 | 44.5% | 180 | 452 | 39.8% | 215 | 237 | 90.7% | 75 | 193 | 268 | 225 | 65 | 16 | 127 | 147 | 1,273 |
| 15 | 2008-09 | BOS | 33 | 79 | 79 | 2,876 | 499 | 1,040 | 48.0% | 199 | 486 | 40.9% | 237 | 249 | 95.2% | 66 | 212 | 278 | 218 | 69 | 13 | 134 | 157 | 1,434 |
| 16 | 2009-10 | BOS | 34 | 80 | 80 | 2,819 | 464 | 973 | 47.7% | 145 | 399 | 36.3% | 231 | 253 | 91.3% | 45 | 208 | 253 | 210 | 64 | 25 | 129 | 182 | 1,304 |
| 17 | 2010-11 | BOS | 35 | 80 | 80 | 2,890 | 480 | 978 | 49.1% | 168 | 378 | 44.4% | 193 | 219 | 88.1% | 51 | 223 | 274 | 219 | 77 | 16 | 117 | 147 | 1,321 |
| 18 | 2011-12 | BOS | 36 | 46 | 42 | 1,565 | 226 | 493 | 45.8% | 106 | 234 | 45.3% | 97 | 106 | 91.5% | 14 | 128 | 142 | 109 | 49 | 8 | 68 | 83 | 655 |
| 19 | 2012-13 | MIA | 37 | 79 | 0 | 2,035 | 292 | 651 | 44.9% | 139 | 332 | 41.9% | 140 | 158 | 88.6% | 40 | 177 | 217 | 135 | 67 | 15 | 103 | 129 | 863 |
| 20 | 2013-14 | MIA | 38 | 73 | 9 | 1,936 | 240 | 543 | 44.2% | 116 | 309 | 37.5% | 105 | 116 | 90.5% | 23 | 182 | 205 | 143 | 54 | 8 | 84 | 115 | 701 |
Max Min
NBA Alltime Leaders
Games Played
Robert Parish: 1,611Kareem Abdul-Jabbar: 1,560
Vince Carter: 1,541
Dirk Nowitzki: 1,522
John Stockton: 1,504
Points
LeBron James: 40,474Kareem Abdul-Jabbar: 38,387
Karl Malone: 36,928
Kobe Bryant: 33,643
Michael Jordan: 32,292
Steals
John Stockton: 3,265Jason Kidd: 2,684
Chris Paul: 2,614
Michael Jordan: 2,514
Gary Payton: 2,445
Free Throws Made
Karl Malone: 9,787Moses Malone: 8,531
LeBron James: 8,390
Kobe Bryant: 8,378
Oscar Robertson: 7,694