Pete Myers Stats: NBA Career

Pete Myers - The Underrated Baller from Multiple NBA Teams
Welcome to the profile of Pete Myers - an NBA player who may not be a household name but certainly left his mark on the basketball court during his career. Myers played for a total of seven teams throughout his 12 seasons in the NBA, showcasing his versatility and adaptability as a player. From the Chicago Bulls to the Charlotte Hornets, Myers brought his A-game wherever he went.
Myers began his NBA journey in the 1986-87 season and co...ntinued to play until the 1997-98 season. Despite not being a flashy or high-scoring player, Myers was known for his consistency, defensive prowess, and selfless style of play. Standing at 6 feet 6 inches, Myers primarily played as a shooting guard and small forward, using his size and skills to contribute in various aspects of the game.
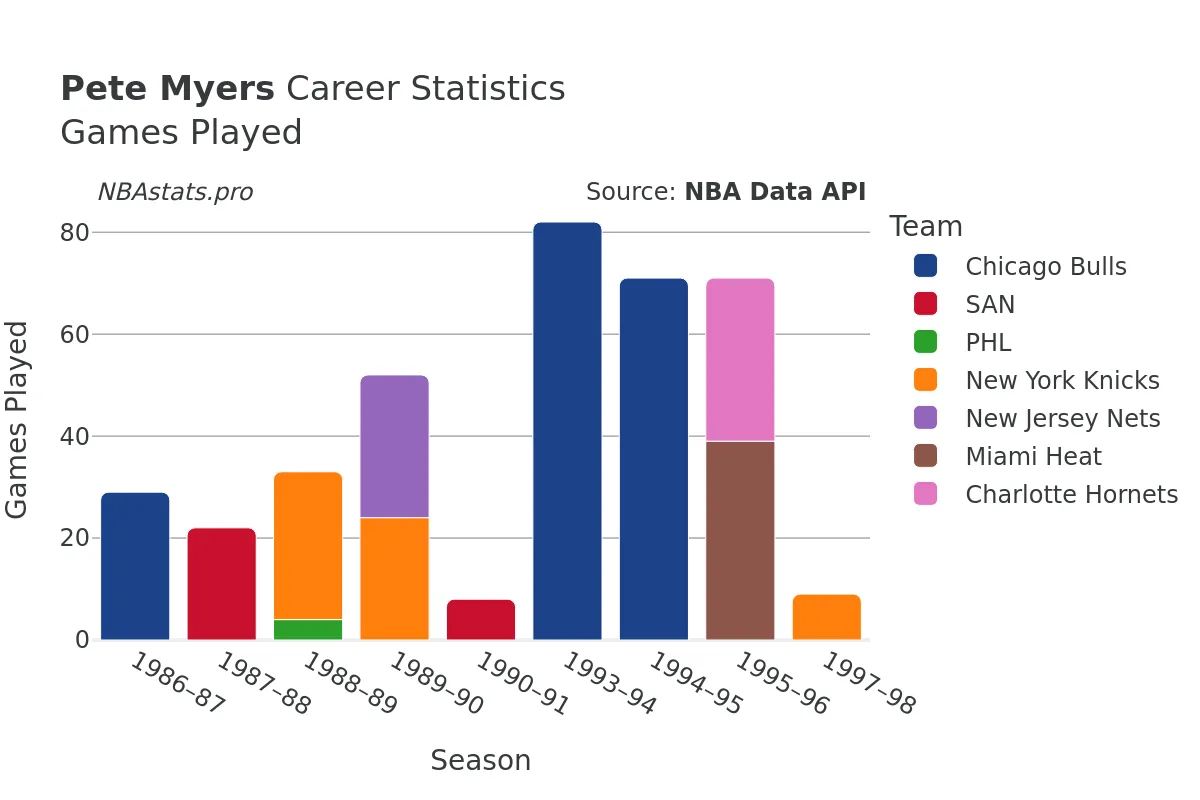
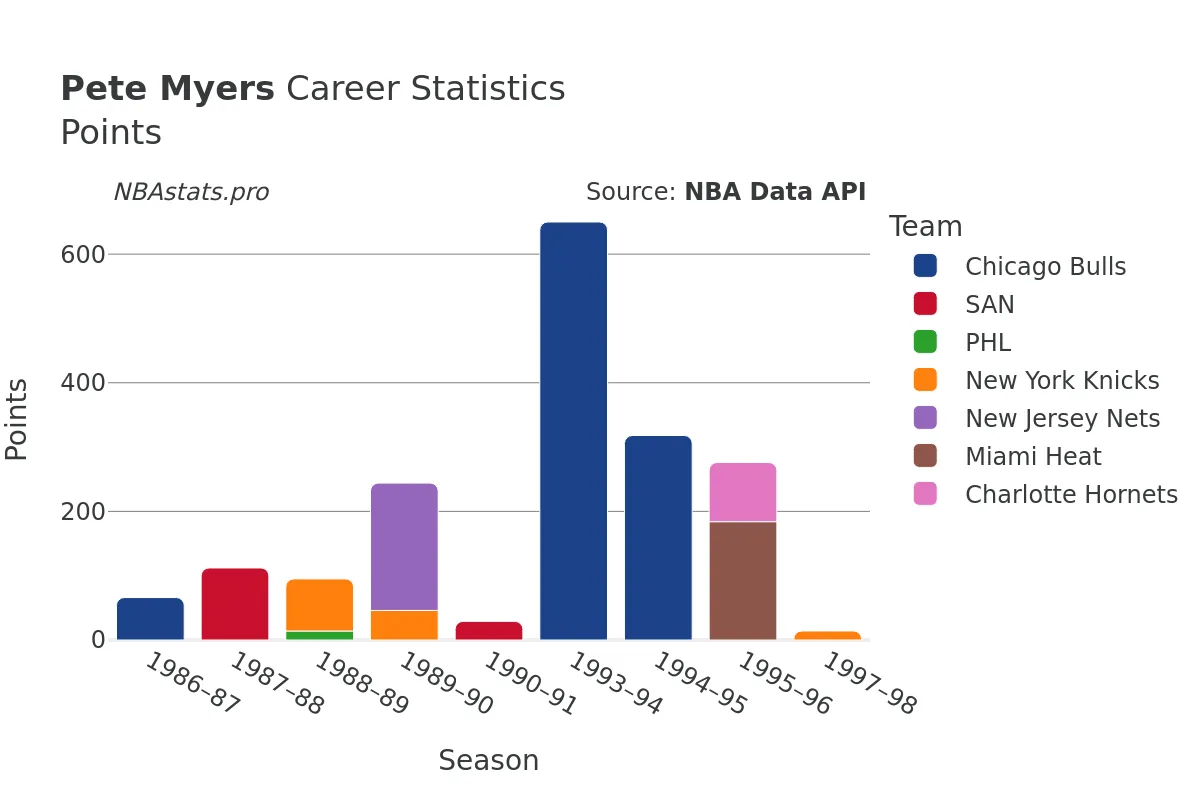
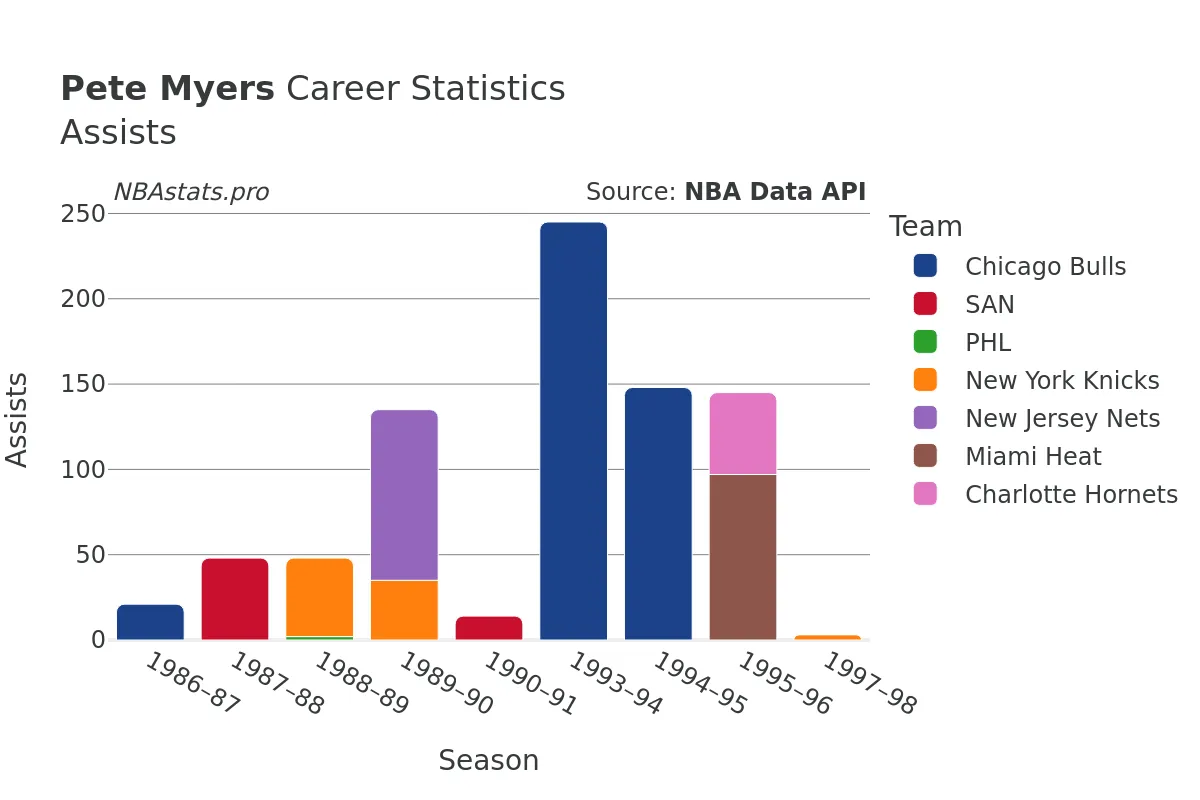
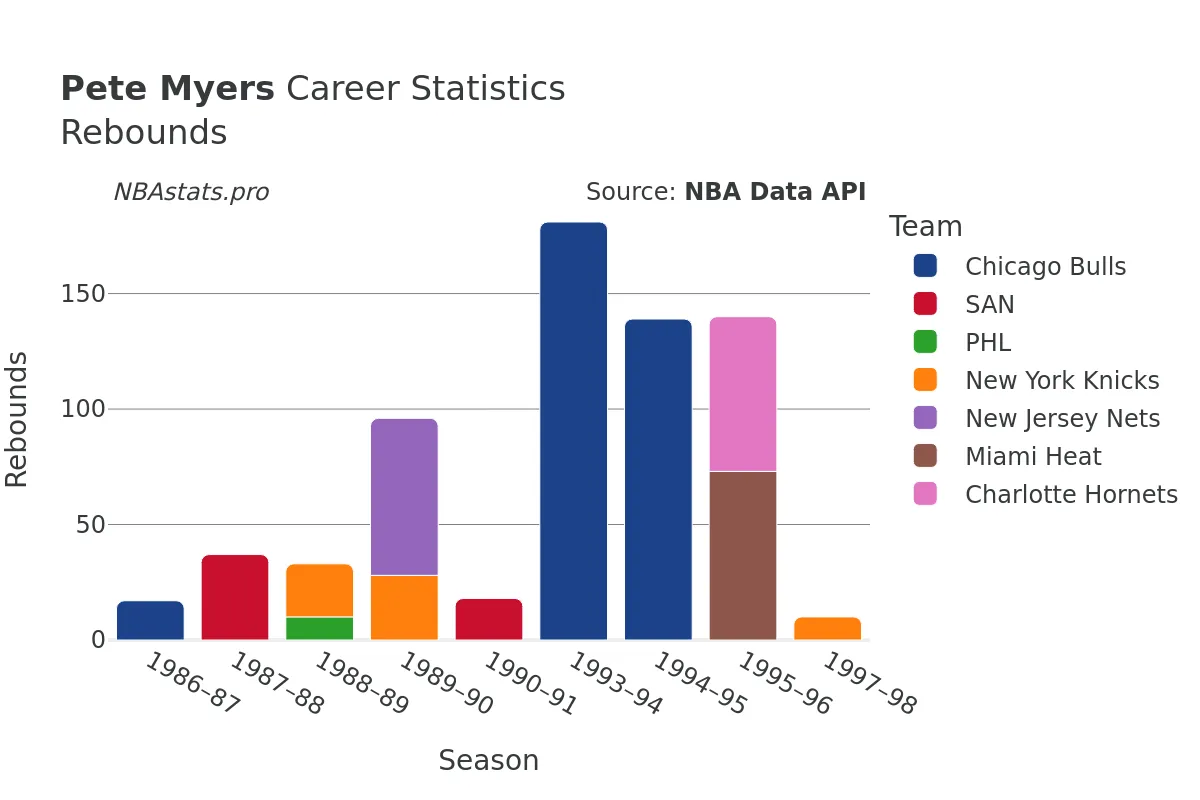
Throughout his career, Myers played a total of 533 games, accumulating 8152 minutes on the court. His offensive game was solid, with 871 goals made out of 2113 attempted, giving him a field goal percentage of 41.22%. While he wasn't the most prolific scorer, Myers made up for it with his passing and rebounding abilities. He recorded a total of 1135 assists and 940 rebounds, showcasing his well-rounded game.
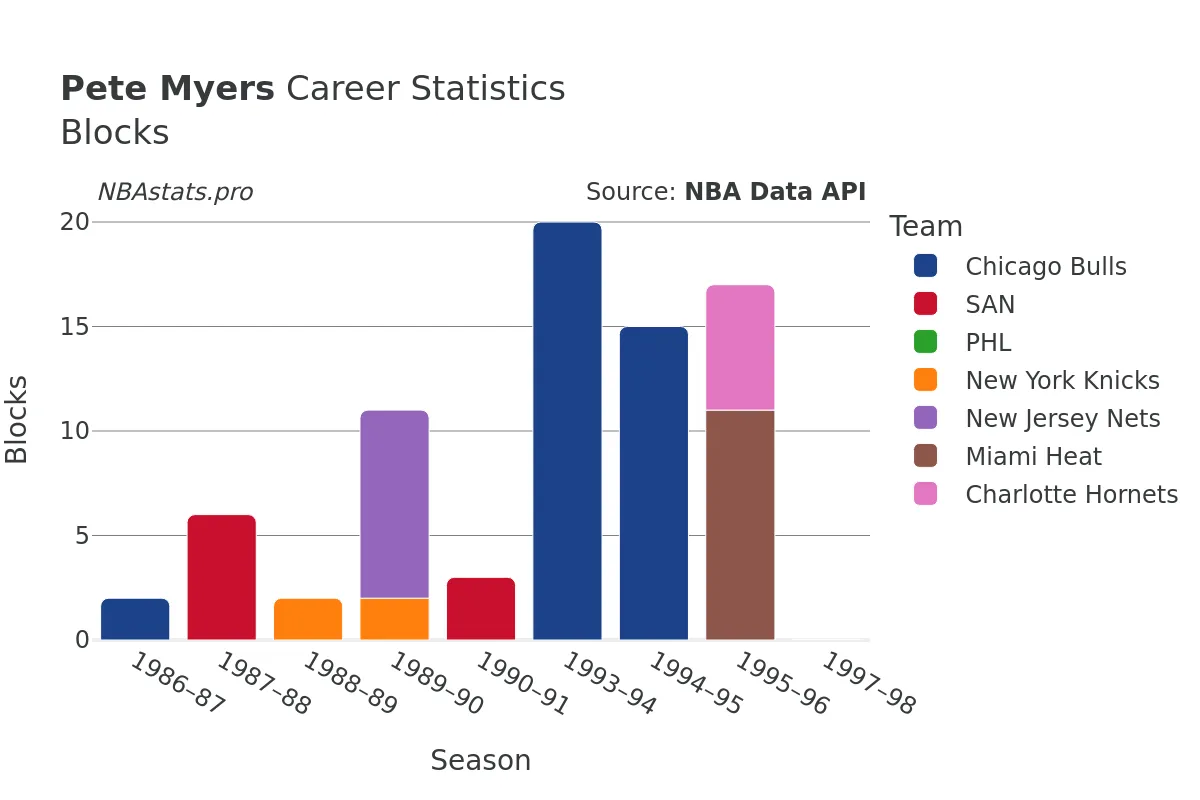
One of Myers' strengths was his defensive presence. He was a tenacious defender, known for his ability to guard multiple positions and disrupt the opponent's offense. Over his career, Myers tallied 352 steals and 106 blocks, proving to be a valuable asset on the defensive end of the court.
When it came to scoring, Myers could deliver at the free-throw line as well. With a free throw percentage of over 60%, Myers demonstrated his reliability in clutch moments and his ability to capitalize on opportunities to put points on the board.
Beyond the stats, Myers was a consummate professional and a strong locker room presence. His work ethic and team-first mentality earned him the respect of coaches, teammates, and fans alike. While he may not have been a headline-grabbing star, Myers' contributions were integral to the success of the teams he played for.
Throughout his career, Myers had the opportunity to showcase his skills in various cities across the United States. From the bustling streets of Chicago to the sunny beaches of Miami, Myers left his mark on each team and city he represented. He embraced the challenges of changing teams and roles, demonstrating his adaptability and dedication to the game.
As you delve deeper into the charts and statistics on this page, you'll gain a better understanding of the impact Pete Myers had on the court. Whether you're a fan of defense, passing, or all-around hustle, Myers' stats tell the story of a player who may not have always been in the spotlight but was instrumental to the success of his teams.
So, grab a seat, dive into the numbers, and appreciate the career of Pete Myers - a player who exemplified hard work, determination, and the true essence of basketball.
Read more
Games Played
Points
Assists
Rebounds
Steals
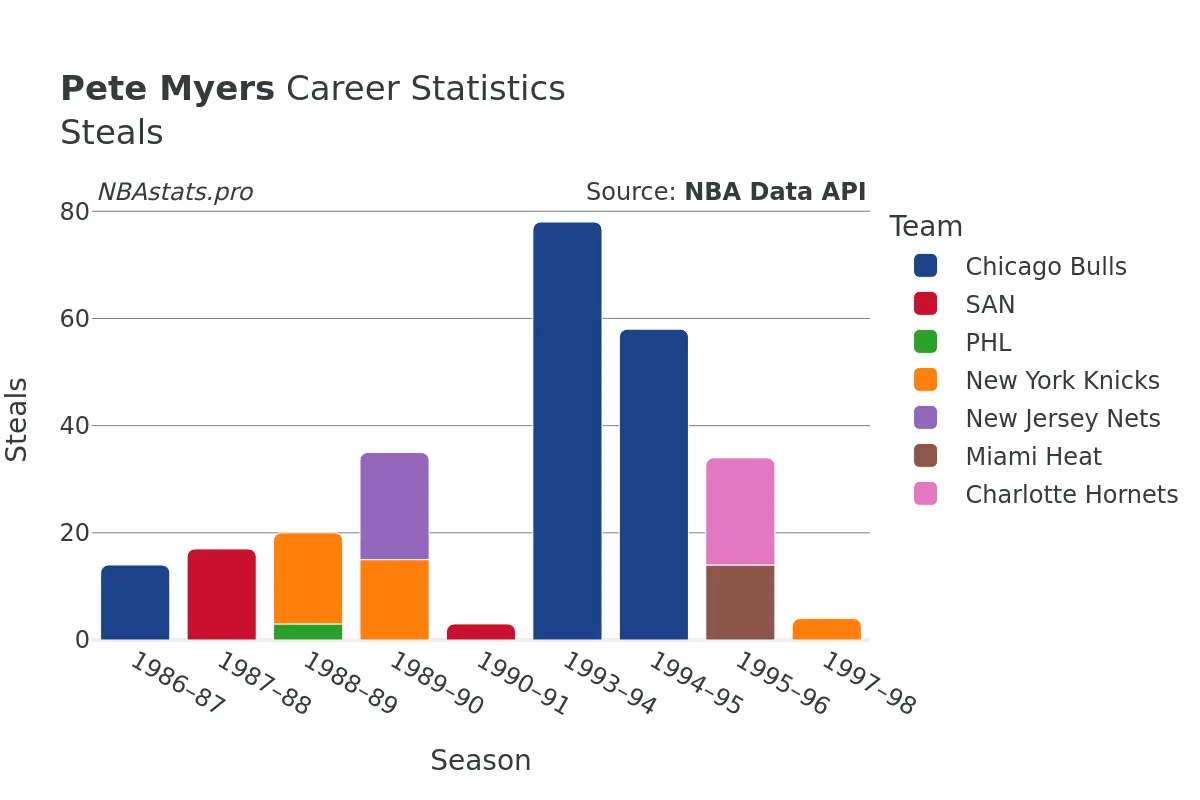
Minutes Played
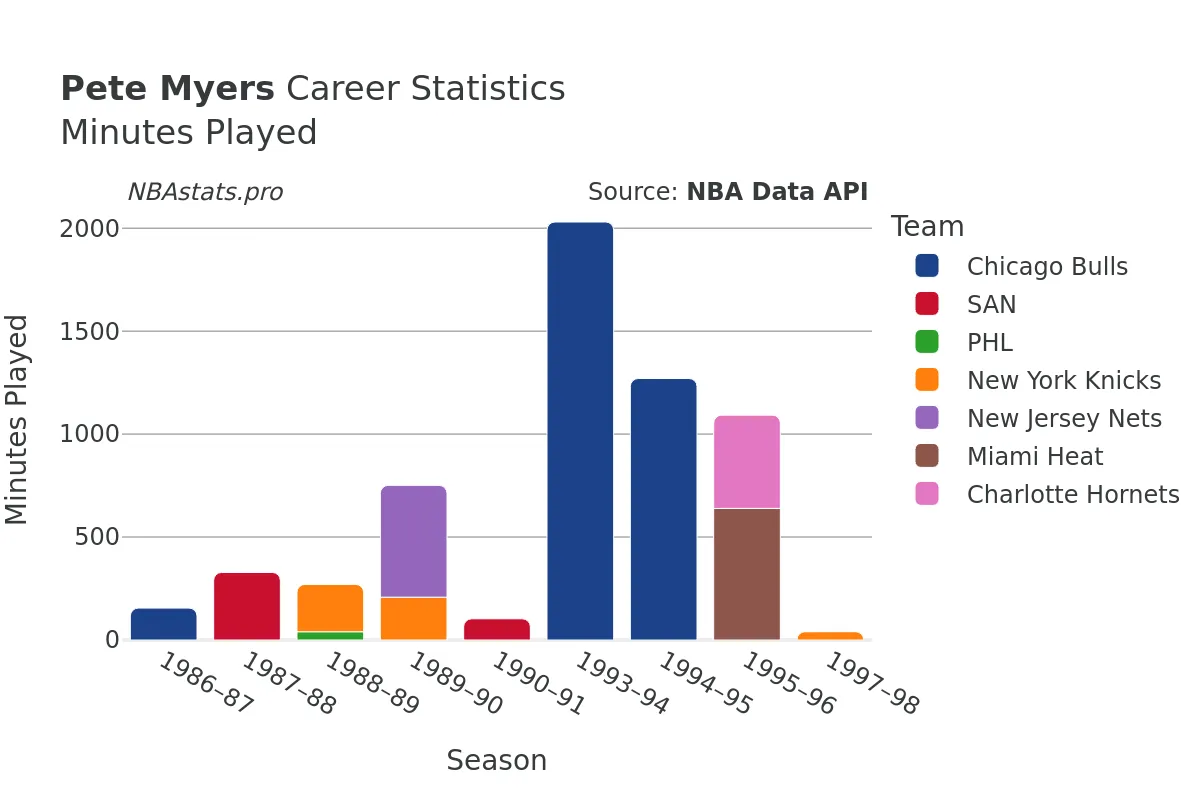
Turnovers
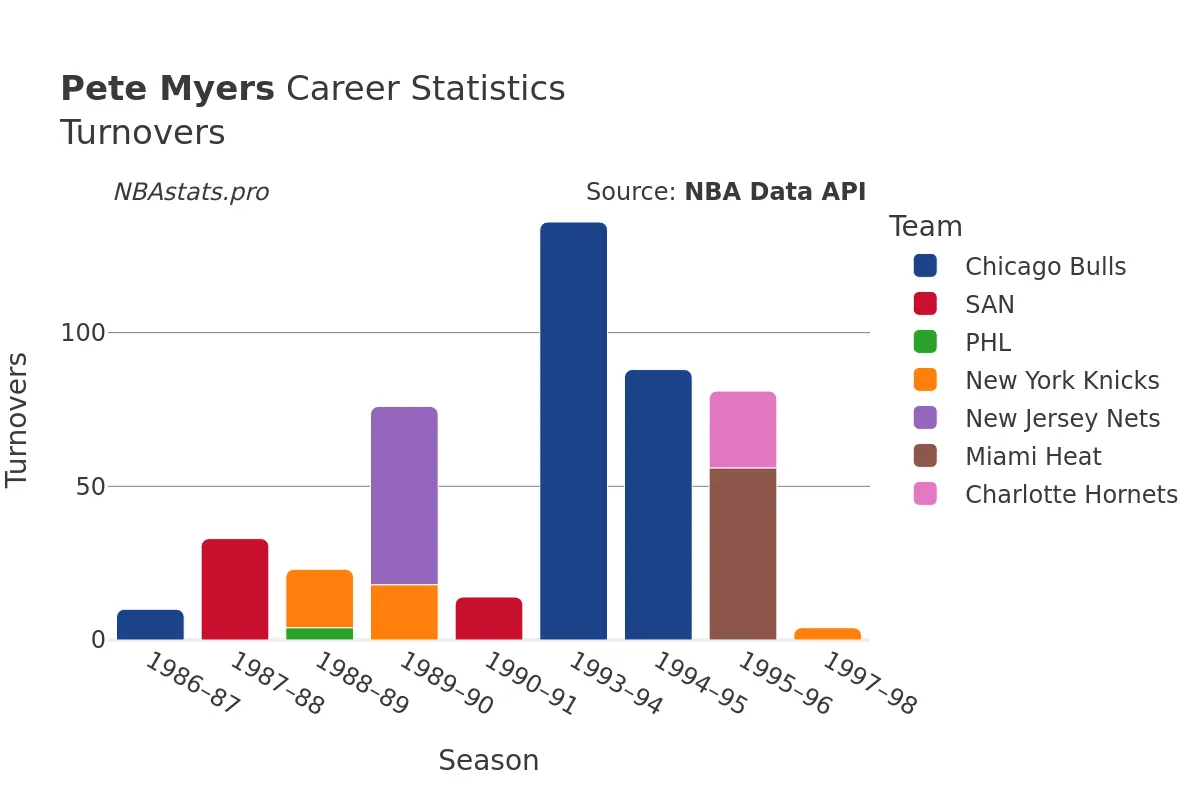
Blocks
Pete Myers Career Stats Table
| SEASON | TEAM | AGE | GP | GS | MIN | FGM | FGA | FG % | FG3M | FG3A | FG3 % | FTM | FTA | FT % | OREB | DREB | REB | AST | STL | BLK | TOV | PF | PTS | |
|---|---|---|---|---|---|---|---|---|---|---|---|---|---|---|---|---|---|---|---|---|---|---|---|---|
| 1 | 1986-87 | CHI | 23 | 29 | 0 | 155 | 19 | 52 | 36.5% | 0 | 6 | 0.0% | 28 | 43 | 65.1% | 8 | 9 | 17 | 21 | 14 | 2 | 10 | 25 | 66 |
| 2 | 1987-88 | SAN | 24 | 22 | 0 | 328 | 43 | 95 | 45.3% | 0 | 4 | 0.0% | 26 | 39 | 66.7% | 11 | 26 | 37 | 48 | 17 | 6 | 33 | 30 | 112 |
| 3 | 1988-89 | PHL | 25 | 4 | 0 | 40 | 6 | 12 | 50.0% | 0 | 0 | 0.0% | 2 | 4 | 50.0% | 3 | 7 | 10 | 2 | 3 | 0 | 4 | 3 | 14 |
| 4 | 1988-89 | NYK | 25 | 29 | 0 | 230 | 25 | 61 | 41.0% | 0 | 2 | 0.0% | 31 | 44 | 70.5% | 12 | 11 | 23 | 46 | 17 | 2 | 19 | 41 | 81 |
| 5 | 1988-89 | TOT | 25 | 33 | 0 | 270 | 31 | 73 | 42.5% | 0 | 2 | 0.0% | 33 | 48 | 68.8% | 15 | 18 | 33 | 48 | 20 | 2 | 23 | 44 | 95 |
| 6 | 1989-90 | NYK | 26 | 24 | 0 | 208 | 15 | 45 | 33.3% | 0 | 1 | 0.0% | 16 | 31 | 51.6% | 10 | 18 | 28 | 35 | 15 | 2 | 18 | 39 | 46 |
| 7 | 1989-90 | NJN | 26 | 28 | 2 | 543 | 74 | 180 | 41.1% | 0 | 6 | 0.0% | 50 | 69 | 72.5% | 23 | 45 | 68 | 100 | 20 | 9 | 58 | 70 | 198 |
| 8 | 1989-90 | TOT | 26 | 52 | 2 | 751 | 89 | 225 | 39.6% | 0 | 7 | 0.0% | 66 | 100 | 66.0% | 33 | 63 | 96 | 135 | 35 | 11 | 76 | 109 | 244 |
| 9 | 1990-91 | SAN | 27 | 8 | 1 | 103 | 10 | 23 | 43.5% | 0 | 1 | 0.0% | 9 | 11 | 81.8% | 2 | 16 | 18 | 14 | 3 | 3 | 14 | 14 | 29 |
| 10 | 1993-94 | CHI | 30 | 82 | 81 | 2,030 | 253 | 556 | 45.5% | 8 | 29 | 27.6% | 136 | 194 | 70.1% | 54 | 127 | 181 | 245 | 78 | 20 | 136 | 195 | 650 |
| 11 | 1994-95 | CHI | 31 | 71 | 14 | 1,270 | 119 | 287 | 41.5% | 10 | 39 | 25.6% | 70 | 114 | 61.4% | 57 | 82 | 139 | 148 | 58 | 15 | 88 | 125 | 318 |
| 12 | 1995-96 | MIA | 32 | 39 | 1 | 639 | 62 | 160 | 38.8% | 11 | 42 | 26.2% | 49 | 76 | 64.5% | 21 | 52 | 73 | 97 | 14 | 11 | 56 | 75 | 184 |
| 13 | 1995-96 | CHH | 32 | 32 | 1 | 453 | 29 | 87 | 33.3% | 3 | 16 | 18.8% | 31 | 46 | 67.4% | 14 | 53 | 67 | 48 | 20 | 6 | 25 | 57 | 92 |
| 14 | 1995-96 | TOT | 32 | 71 | 2 | 1,092 | 91 | 247 | 36.8% | 14 | 58 | 24.1% | 80 | 122 | 65.6% | 35 | 105 | 140 | 145 | 34 | 17 | 81 | 132 | 276 |
| 15 | 1997-98 | NYK | 34 | 9 | 0 | 40 | 5 | 10 | 50.0% | 0 | 0 | 0.0% | 4 | 6 | 66.7% | 5 | 5 | 10 | 3 | 4 | 0 | 4 | 7 | 14 |
Max Min
NBA Alltime Leaders
Games Played
Robert Parish: 1,611Kareem Abdul-Jabbar: 1,560
Vince Carter: 1,541
Dirk Nowitzki: 1,522
John Stockton: 1,504
Points
LeBron James: 40,474Kareem Abdul-Jabbar: 38,387
Karl Malone: 36,928
Kobe Bryant: 33,643
Michael Jordan: 32,292
Steals
John Stockton: 3,265Jason Kidd: 2,684
Chris Paul: 2,614
Michael Jordan: 2,514
Gary Payton: 2,445
Free Throws Made
Karl Malone: 9,787Moses Malone: 8,531
LeBron James: 8,390
Kobe Bryant: 8,378
Oscar Robertson: 7,694