Pete Chilcutt Stats: NBA Career

Pete Chilcutt: The Unsung Hero of the Court
When it comes to NBA basketball players, the spotlight often shines on the high-scoring superstars, the flashy dunkers, and the sharpshooters from beyond the arc. But every team needs its unsung heroes, the players who may not always make the headlines but whose contributions are crucial to the team's success. One such player who exemplifies this role is Pete Chilcutt.
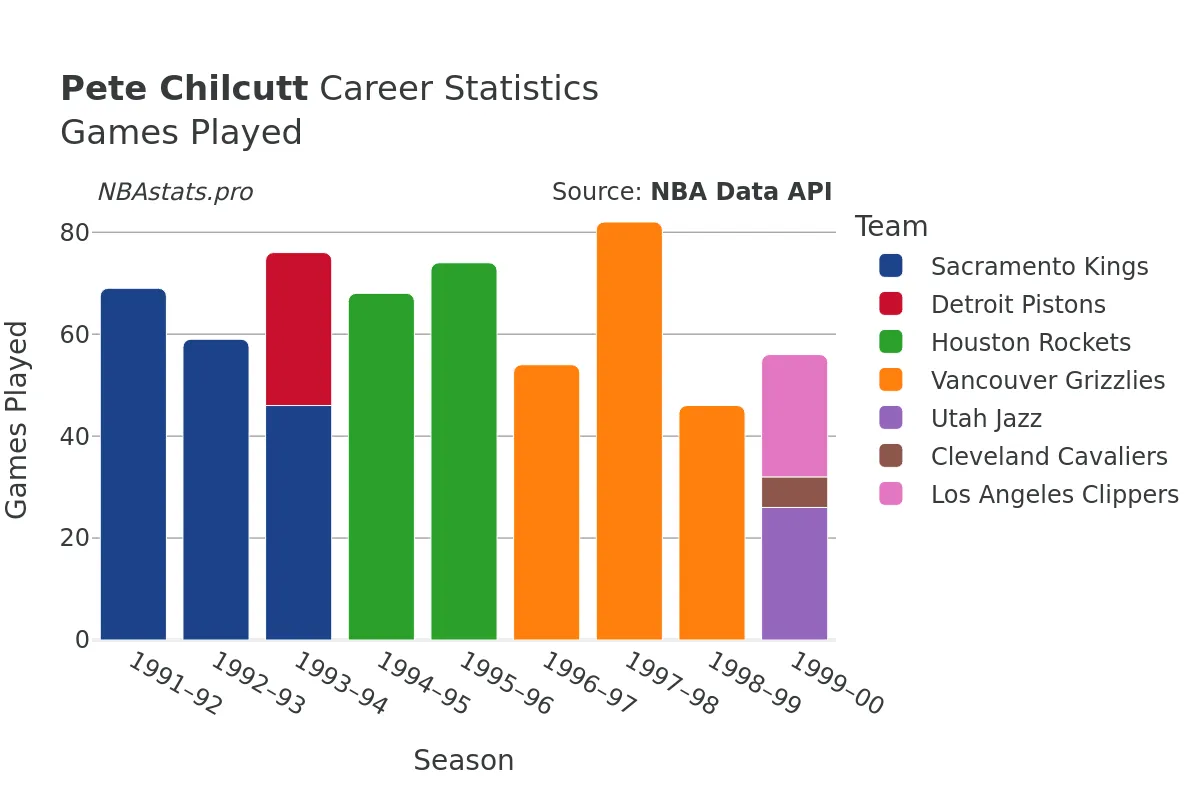
Pete Chilcutt, a versatile power forward, graced the courts of the NBA for nine se...asons, from 1991 to 2000. Despite not belonging to a single team throughout his career, Chilcutt's impact was felt in every city he played in – Sacramento, Detroit, Houston, Memphis, Utah, Cleveland, and Los Angeles.
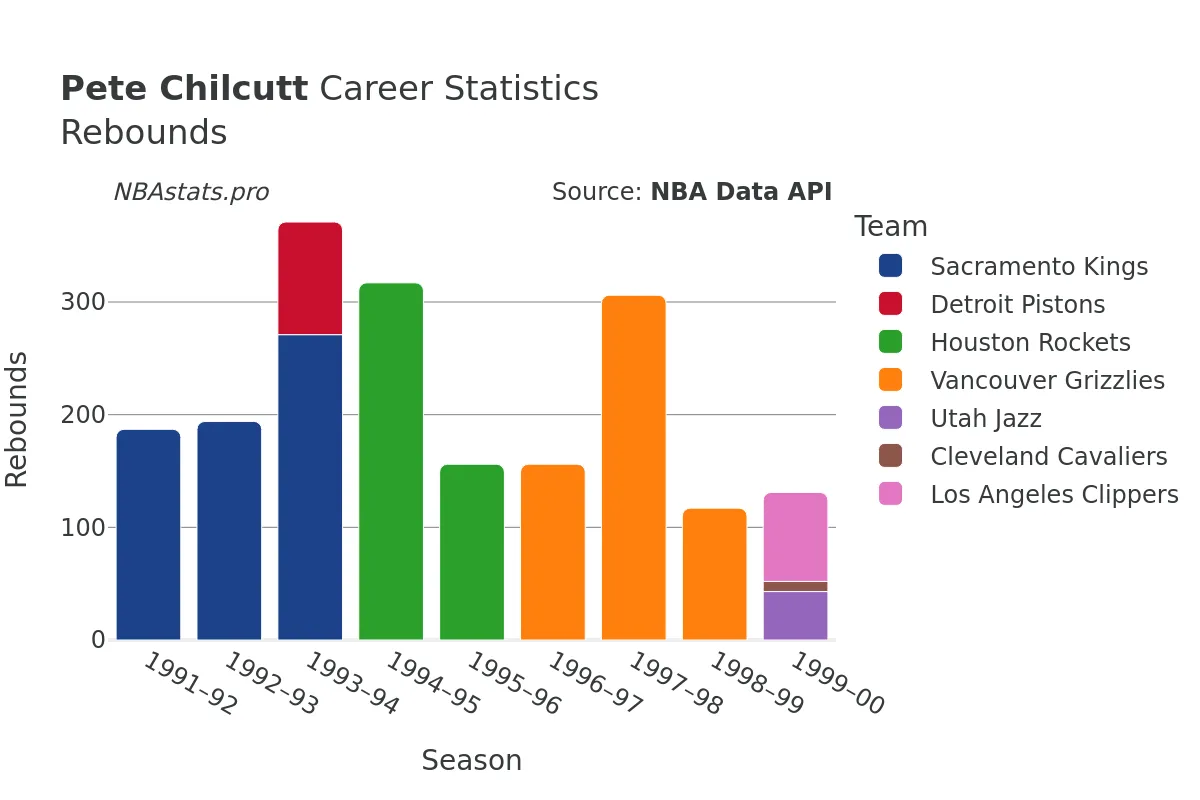
Chilcutt entered the league at the age of 23, bringing with him a unique skill set that would make him a valuable asset to any team. Standing at 6 feet 10 inches, Chilcutt's presence in the paint was formidable, as evidenced by his impressive rebounding numbers. Over the course of his career, he pulled down a total of 2437 rebounds, with 1599 of them coming on the defensive end and 838 on the offensive end.
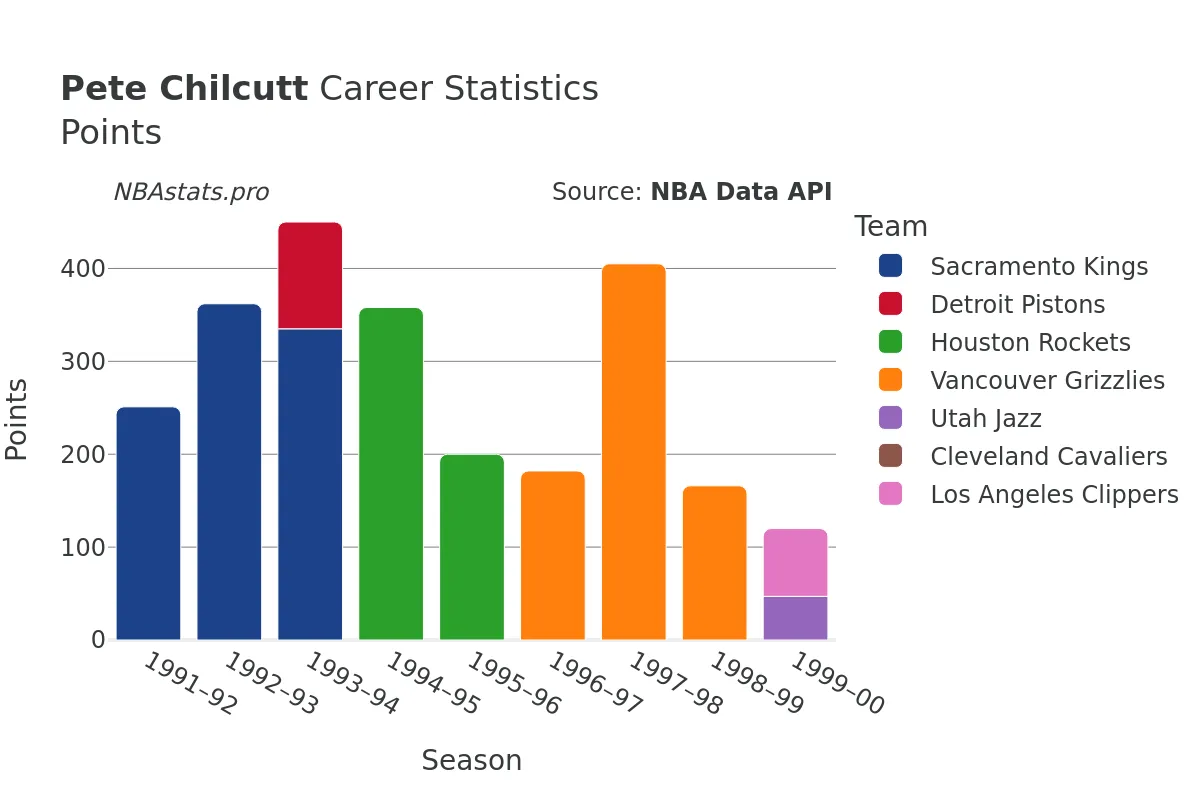
But Chilcutt was not just a force on the boards; he was also a solid scorer, with a career total of 3064 points. His shooting touch was reliable, as he made 1300 field goals out of 2943 attempts, giving him a field goal percentage of 44.17%. Additionally, Chilcutt displayed finesse at the free-throw line, making 267 out of 386 attempts, translating to a free-throw percentage that was nothing short of impressive.
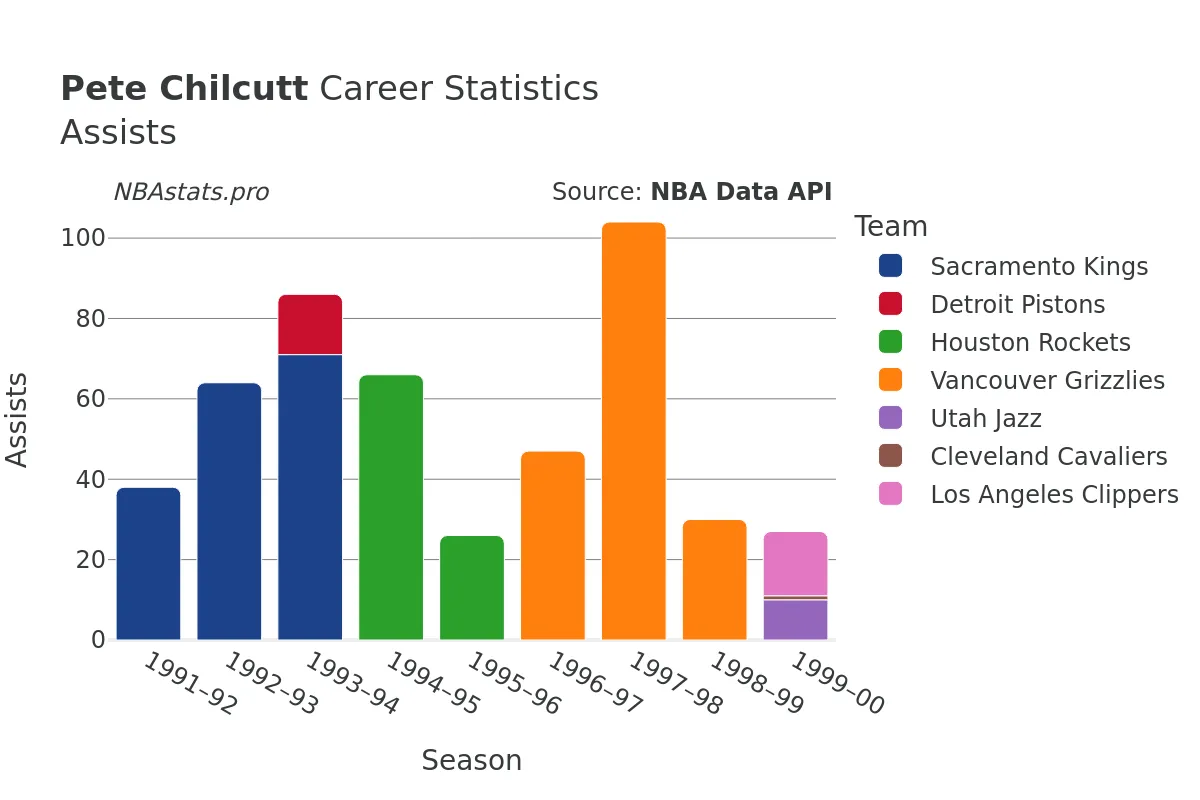
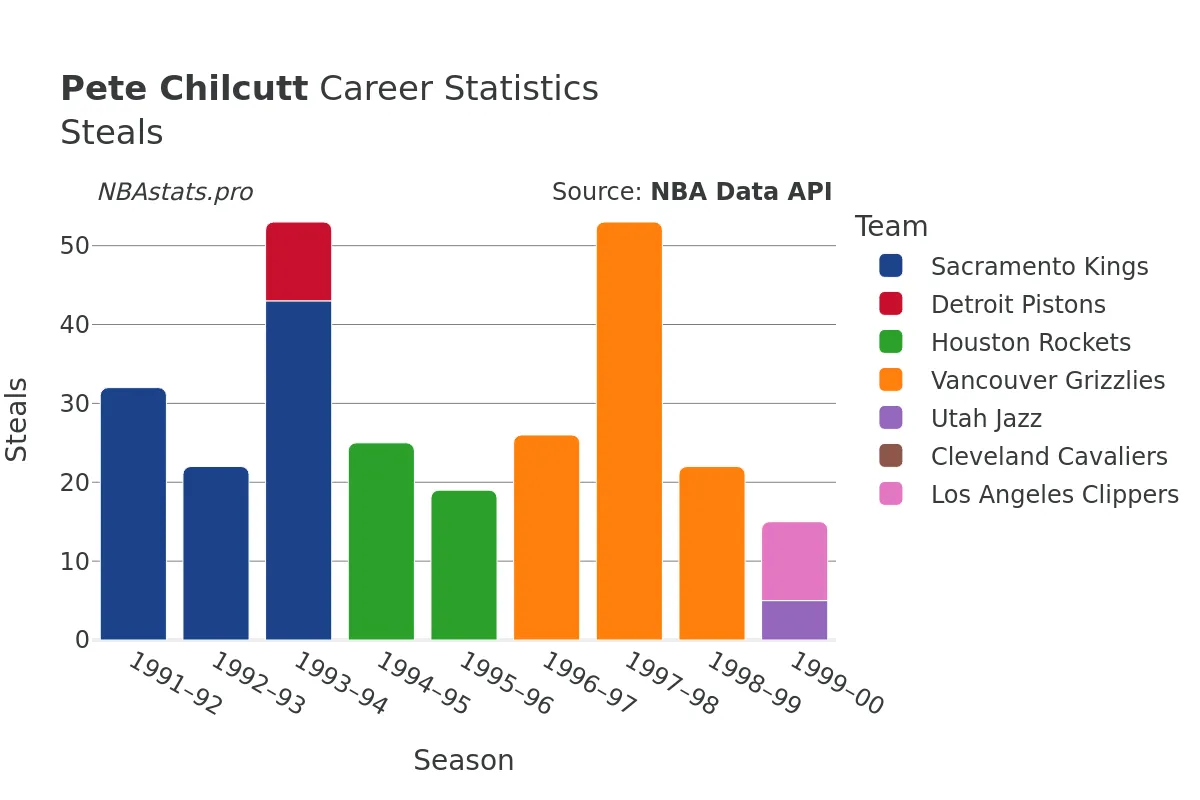
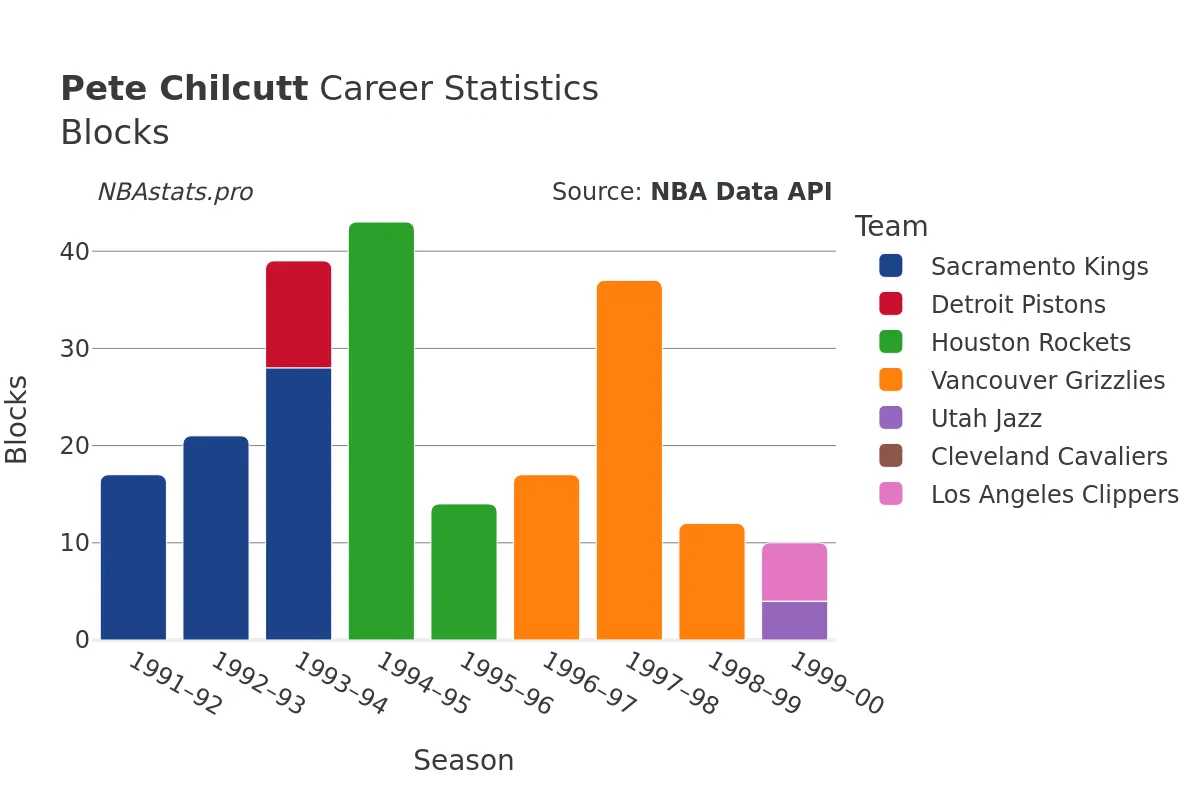
In addition to his scoring and rebounding prowess, Chilcutt was a well-rounded player who could contribute in multiple facets of the game. He recorded 601 assists, 335 steals, and 259 blocks over the course of his career, showcasing his ability to impact the game on both ends of the floor.
Despite his solid contributions on the court, Chilcutt's playing style may not have always garnered the same attention as that of the high-flying stars of his era. However, those who understood the game recognized his value and the intangibles he brought to his team. His basketball IQ, work ethic, and team-first mentality made him a valuable teammate and a player that coaches trusted to execute in crucial moments.
As a fan, analyst, or basketball enthusiast, delving into the statistical breakdown of Pete Chilcutt's career provides a deeper understanding of the player behind the numbers. His consistency, durability, and all-around contributions paint a picture of a player who may not have been the flashiest, but was undoubtedly a key piece of the puzzle for every team he suited up for.
So, whether you are exploring Chilcutt's scoring efficiency, his rebounding tenacity, or his defensive impact, the numbers tell a story of a player who may not have always been in the spotlight, but who was always making a meaningful impact on the court. Take a closer look at the stats, dive into the charts, and discover the unsung hero that was Pete Chilcutt – a player whose contributions went far beyond what meets the eye.
Read more
Games Played
Points
Assists
Rebounds
Steals
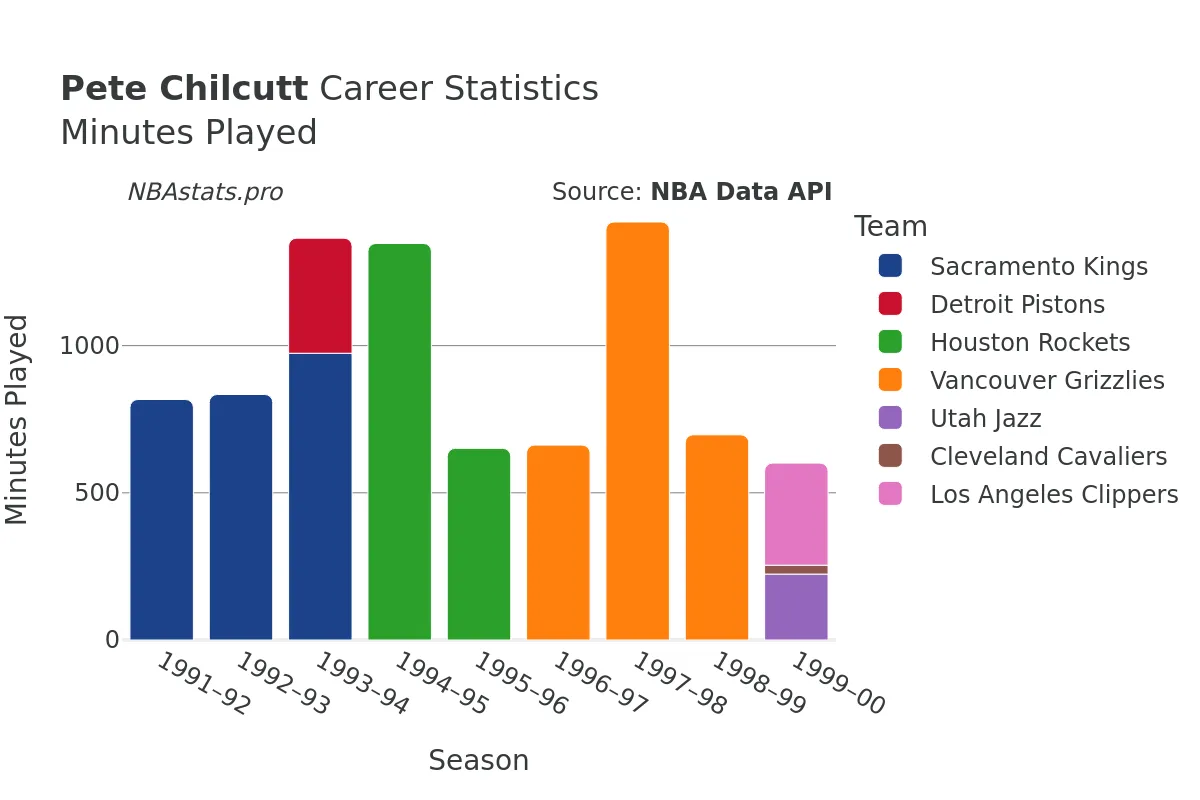
Minutes Played
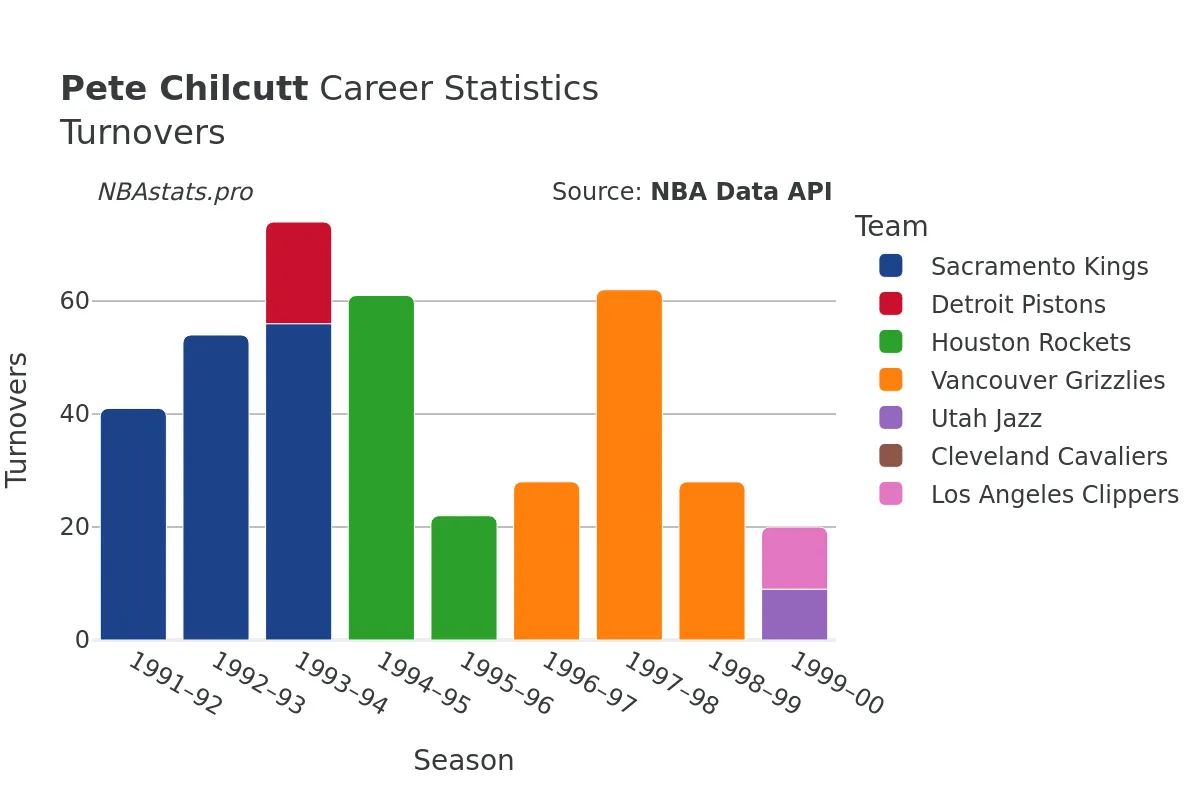
Turnovers
Blocks
Pete Chilcutt Career Stats Table
| SEASON | TEAM | AGE | GP | GS | MIN | FGM | FGA | FG % | FG3M | FG3A | FG3 % | FTM | FTA | FT % | OREB | DREB | REB | AST | STL | BLK | TOV | PF | PTS | |
|---|---|---|---|---|---|---|---|---|---|---|---|---|---|---|---|---|---|---|---|---|---|---|---|---|
| 1 | 1991-92 | SAC | 23 | 69 | 2 | 817 | 113 | 250 | 45.2% | 2 | 2 | 100.0% | 23 | 28 | 82.1% | 78 | 109 | 187 | 38 | 32 | 17 | 41 | 70 | 251 |
| 2 | 1992-93 | SAC | 24 | 59 | 9 | 834 | 165 | 340 | 48.5% | 0 | 0 | 0.0% | 32 | 46 | 69.6% | 80 | 114 | 194 | 64 | 22 | 21 | 54 | 102 | 362 |
| 3 | 1993-94 | SAC | 25 | 46 | 24 | 974 | 152 | 328 | 46.3% | 0 | 1 | 0.0% | 31 | 52 | 59.6% | 100 | 171 | 271 | 71 | 43 | 28 | 56 | 116 | 335 |
| 4 | 1993-94 | DET | 25 | 30 | 0 | 391 | 51 | 120 | 42.5% | 3 | 14 | 21.4% | 10 | 13 | 76.9% | 29 | 71 | 100 | 15 | 10 | 11 | 18 | 48 | 115 |
| 5 | 1993-94 | TOT | 25 | 76 | 24 | 1,365 | 203 | 448 | 45.3% | 3 | 15 | 20.0% | 41 | 65 | 63.1% | 129 | 242 | 371 | 86 | 53 | 39 | 74 | 164 | 450 |
| 6 | 1994-95 | HOU | 26 | 68 | 17 | 1,347 | 146 | 328 | 44.5% | 35 | 86 | 40.7% | 31 | 42 | 73.8% | 106 | 211 | 317 | 66 | 25 | 43 | 61 | 117 | 358 |
| 7 | 1995-96 | HOU | 27 | 74 | 0 | 651 | 73 | 179 | 40.8% | 37 | 98 | 37.8% | 17 | 26 | 65.4% | 51 | 105 | 156 | 26 | 19 | 14 | 22 | 65 | 200 |
| 8 | 1996-97 | VAN | 28 | 54 | 1 | 662 | 72 | 165 | 43.6% | 25 | 69 | 36.2% | 13 | 22 | 59.1% | 67 | 89 | 156 | 47 | 26 | 17 | 28 | 52 | 182 |
| 9 | 1997-98 | VAN | 29 | 82 | 0 | 1,420 | 156 | 359 | 43.5% | 54 | 130 | 41.5% | 39 | 59 | 66.1% | 77 | 229 | 306 | 104 | 53 | 37 | 62 | 158 | 405 |
| 10 | 1998-99 | VAN | 30 | 46 | 0 | 697 | 63 | 172 | 36.6% | 26 | 68 | 38.2% | 14 | 17 | 82.4% | 29 | 88 | 117 | 30 | 22 | 12 | 28 | 52 | 166 |
| 11 | 1999-00 | UTA | 31 | 26 | 0 | 224 | 22 | 62 | 35.5% | 1 | 10 | 10.0% | 2 | 2 | 100.0% | 15 | 28 | 43 | 10 | 5 | 4 | 9 | 31 | 47 |
| 12 | 1999-00 | CLE | 31 | 6 | 0 | 30 | 0 | 2 | 0.0% | 0 | 0 | 0.0% | 0 | 0 | 0.0% | 4 | 5 | 9 | 1 | 0 | 0 | 0 | 3 | 0 |
| 13 | 1999-00 | LAC | 31 | 24 | 2 | 347 | 31 | 63 | 49.2% | 5 | 16 | 31.3% | 6 | 6 | 100.0% | 27 | 52 | 79 | 16 | 10 | 6 | 11 | 39 | 73 |
| 14 | 1999-00 | TOT | 31 | 56 | 2 | 601 | 53 | 127 | 41.7% | 6 | 26 | 23.1% | 8 | 8 | 100.0% | 46 | 85 | 131 | 27 | 15 | 10 | 20 | 73 | 120 |
Max Min
NBA Alltime Leaders
Games Played
Robert Parish: 1,611Kareem Abdul-Jabbar: 1,560
Vince Carter: 1,541
Dirk Nowitzki: 1,522
John Stockton: 1,504
Points
LeBron James: 40,474Kareem Abdul-Jabbar: 38,387
Karl Malone: 36,928
Kobe Bryant: 33,643
Michael Jordan: 32,292
Steals
John Stockton: 3,265Jason Kidd: 2,684
Chris Paul: 2,614
Michael Jordan: 2,514
Gary Payton: 2,445
Free Throws Made
Karl Malone: 9,787Moses Malone: 8,531
LeBron James: 8,390
Kobe Bryant: 8,378
Oscar Robertson: 7,694