Paul Millsap Stats: NBA Career

Paul Millsap, a versatile power forward who has graced the courts of the NBA for sixteen seasons, is a player whose impact transcends statistics. With stints in five different teams spanning from Utah to Philadelphia, Millsap has left an indelible mark on the league, showcasing his exceptional skills and basketball IQ wherever he goes.
Millsap's journey in the NBA began in the 2006-07 season when he entered the league at the age of 22. From his early days with the Utah Jazz to his later years w...ith the Denver Nuggets, Brooklyn Nets, and Philadelphia 76ers, Millsap has consistently demonstrated his prowess on both ends of the floor.
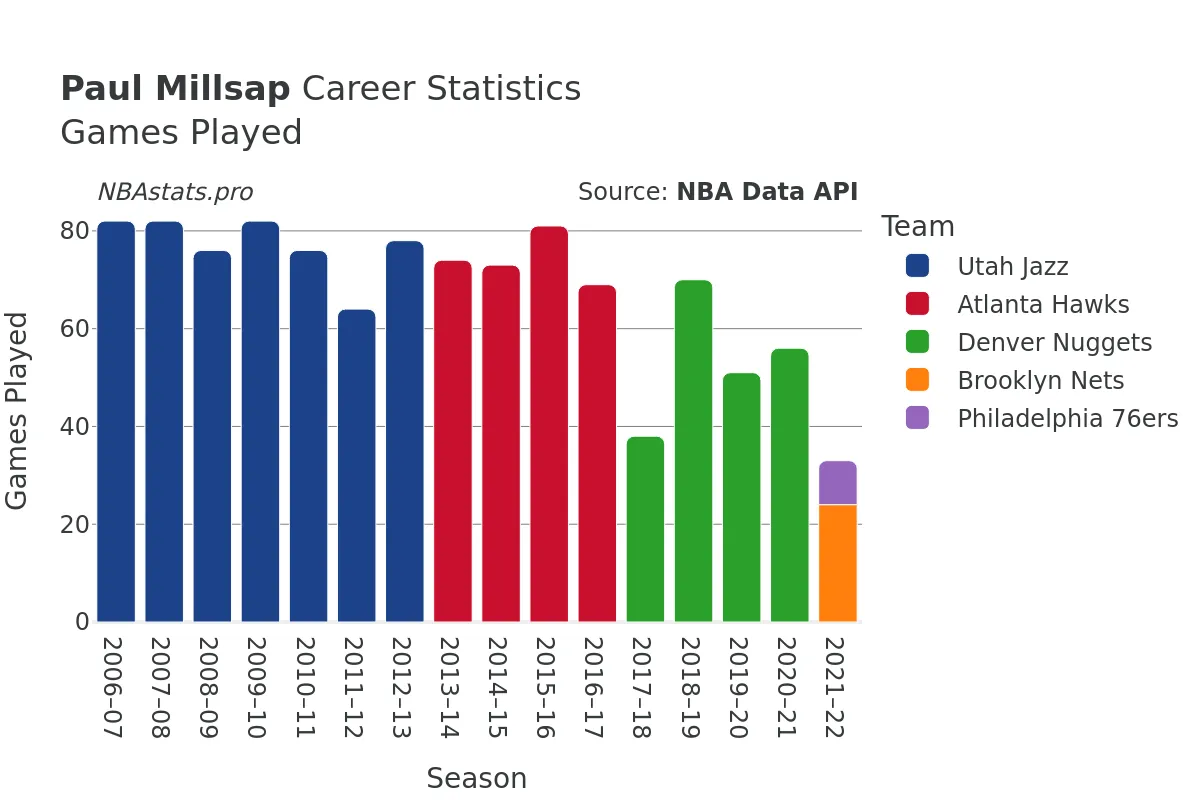
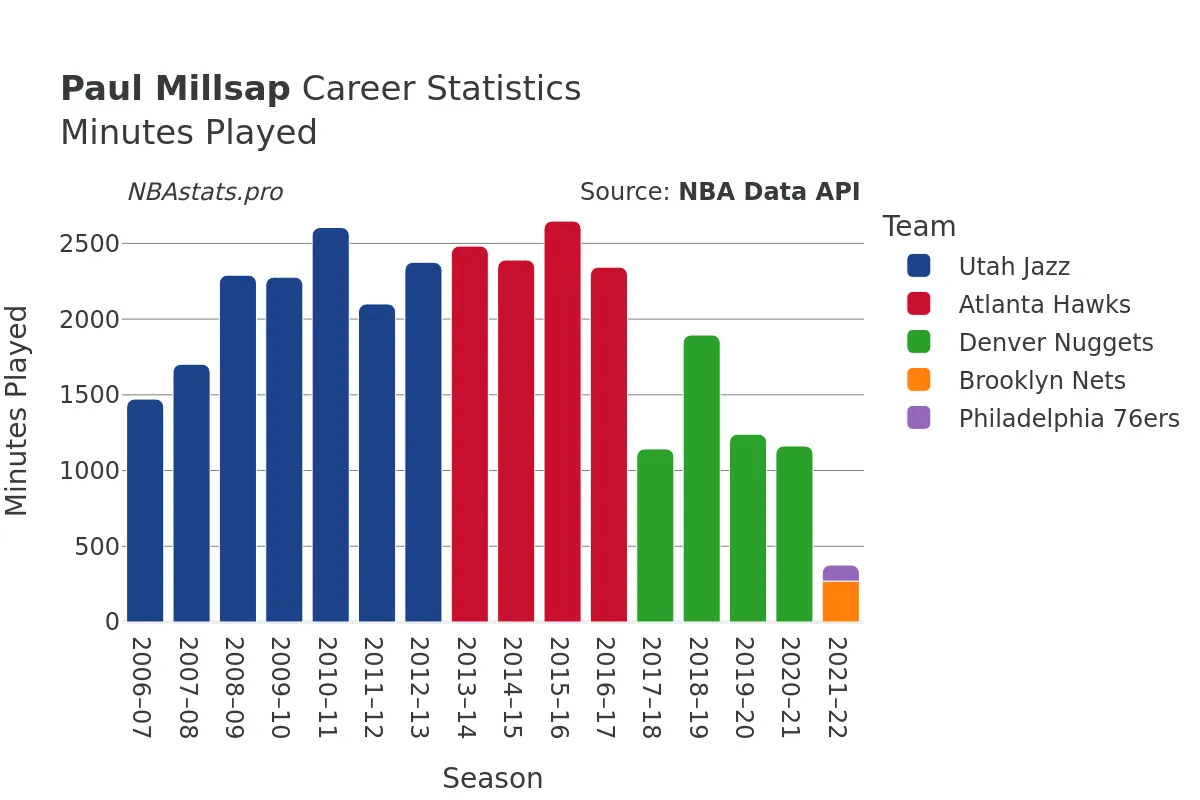
Throughout his career, Millsap has compiled an impressive stat line, playing a total of 1118 games and logging over 30,000 minutes on the court. His offensive capabilities are highlighted by his 48.79% field goal percentage, with 5500 successful attempts out of 11273 shots. Known for his ability to score in various ways, Millsap has been a reliable presence in the paint and beyond the arc, posing a constant threat to opposing defenses.
On the charity stripe, Millsap has showcased his accuracy, boasting a notable free throw percentage. With 3102 successful free throws out of 4214 attempts, he has proven his consistency and composure in crucial moments, often delivering when his team needed it most.
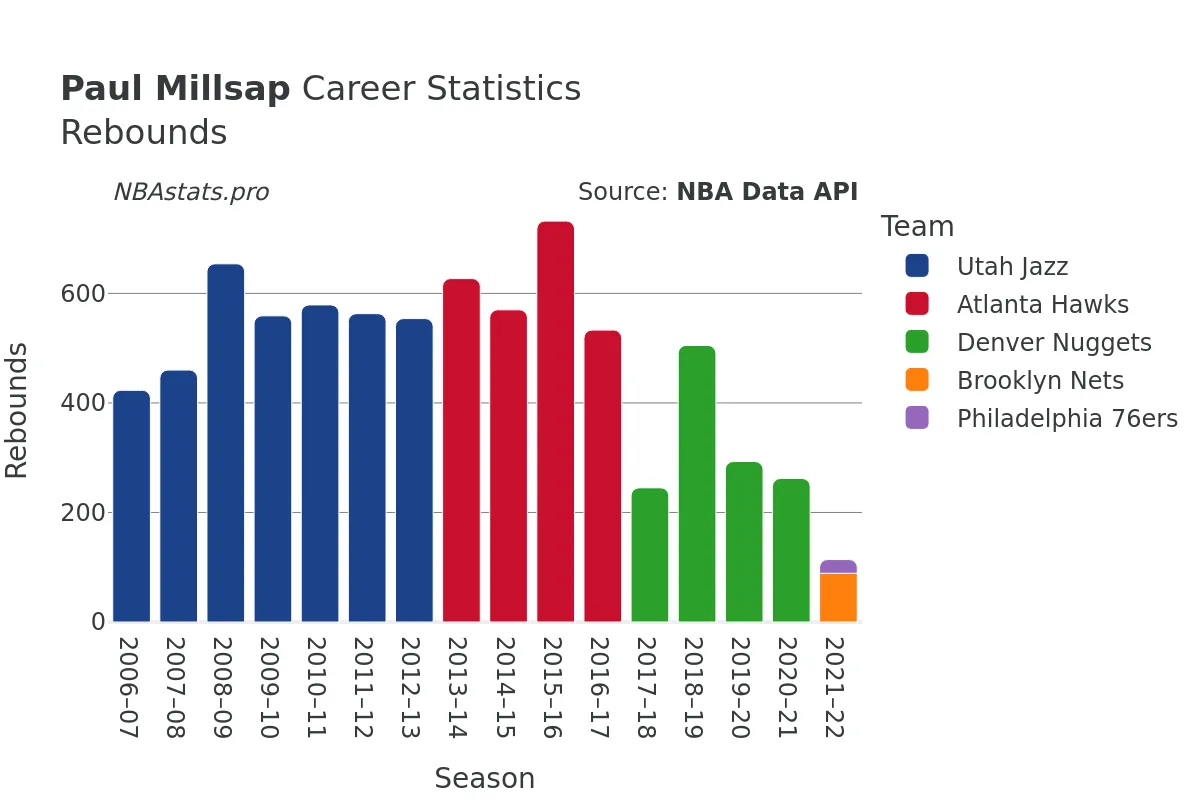
Rebounding has been another area of strength for Millsap, with a total of 7787 rebounds secured throughout his career. His tenacity on the boards, including 5403 defensive rebounds and 2384 offensive rebounds, has been instrumental in providing his teams with second-chance opportunities and controlling the pace of the game.
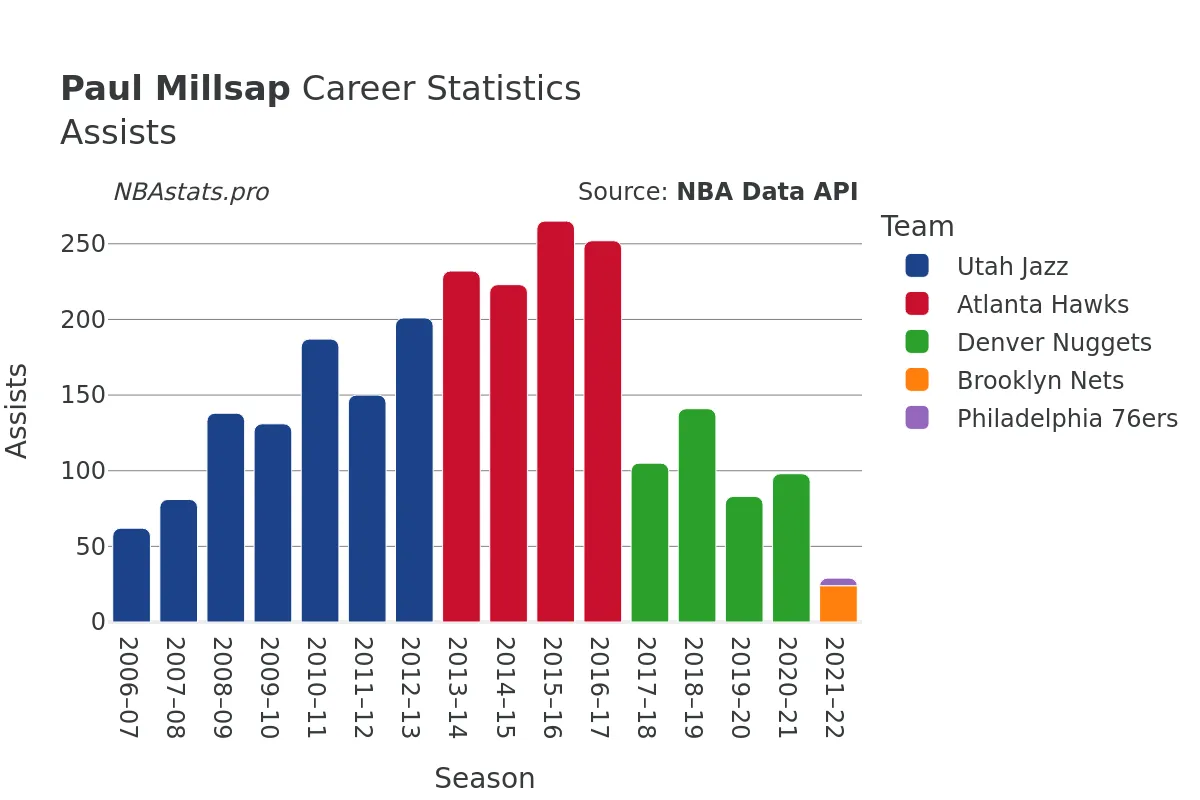
In addition to his scoring and rebounding prowess, Millsap has displayed solid playmaking skills, amassing 2407 assists over his career. His ability to find open teammates, set up scoring opportunities, and facilitate ball movement has made him a well-rounded player capable of impacting the game in multiple ways.
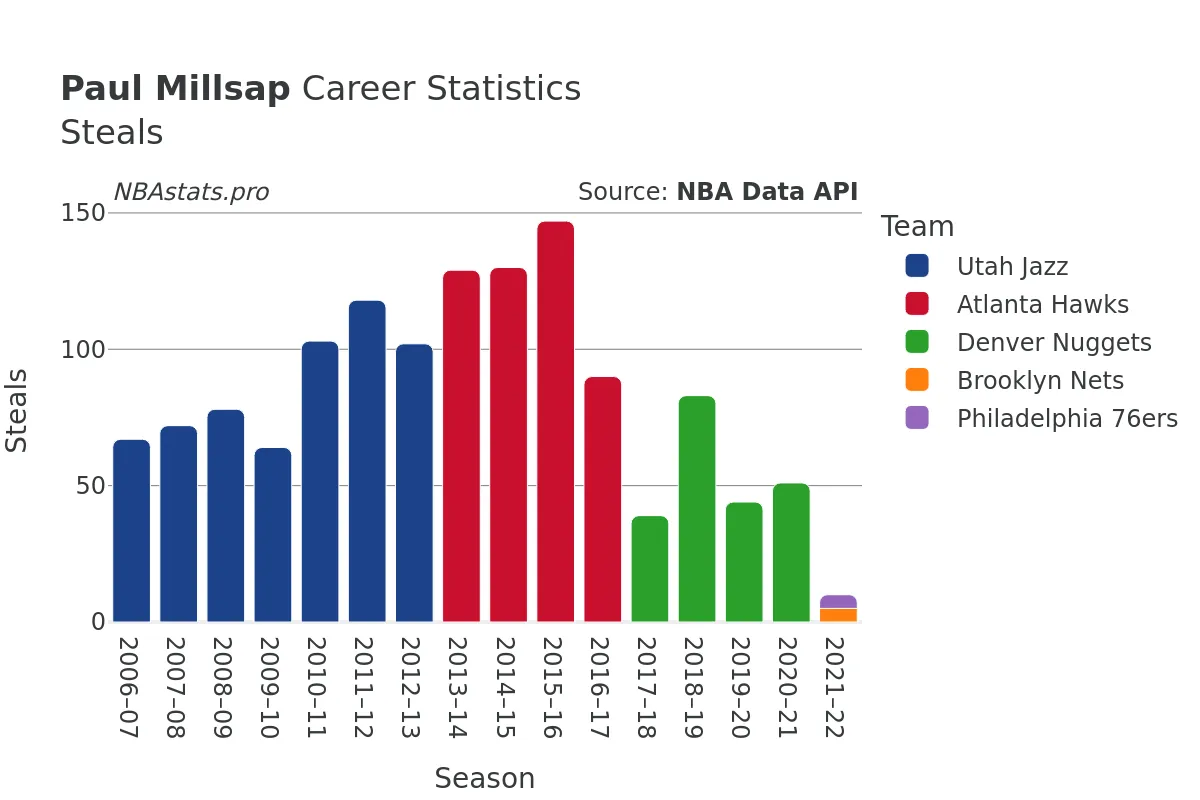
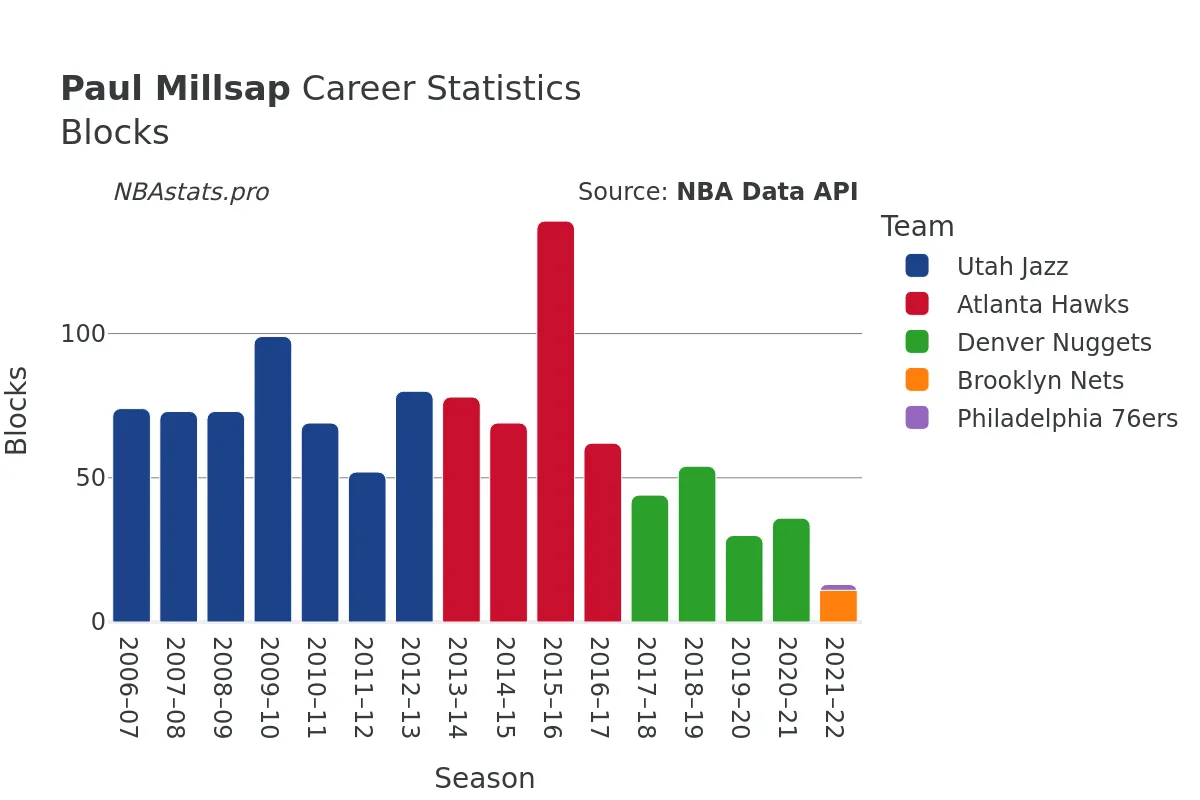
Defensively, Millsap's contributions have been equally impactful, with 1337 steals and 1058 blocks to his name. His instincts, timing, and defensive awareness have made him a formidable presence in the paint and a reliable defender against both perimeter players and big men.
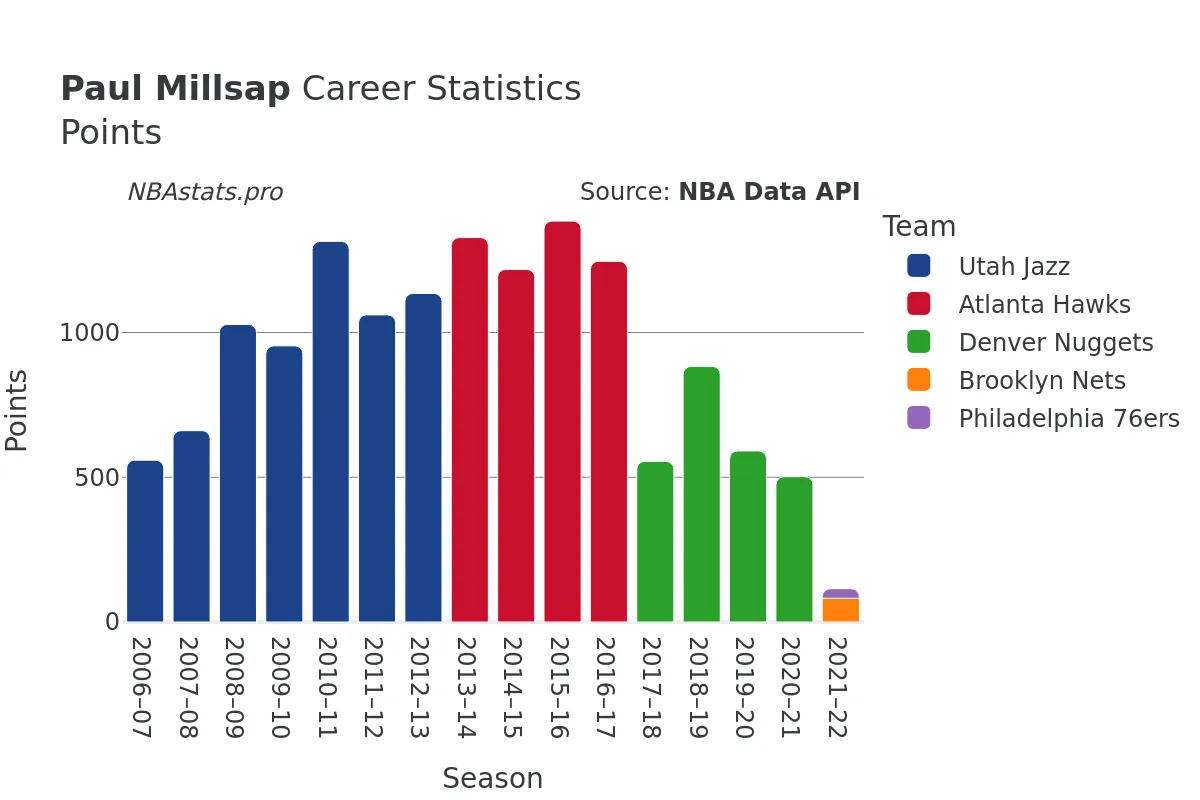
With a career total of 14651 points, Paul Millsap has proven himself as a reliable scorer, a tenacious rebounder, a skilled playmaker, and a solid defender throughout his time in the NBA. Beyond the numbers, his leadership, work ethic, and basketball intelligence have endeared him to fans and teammates alike, earning him respect as a true professional in the world of basketball.
As you delve into the detailed statistics and charts on Paul Millsap's player profile page, you will uncover the nuances of his game, appreciate his contributions to each team he played for, and understand why he is regarded as one of the most versatile power forwards of his generation. Whether you are a basketball enthusiast, a statistics aficionado, or simply a fan of the game, exploring Millsap's career trajectory will surely offer insights and revelations that illuminate the essence of this seasoned NBA veteran.
Read more
Games Played
Points
Assists
Rebounds
Steals
Minutes Played
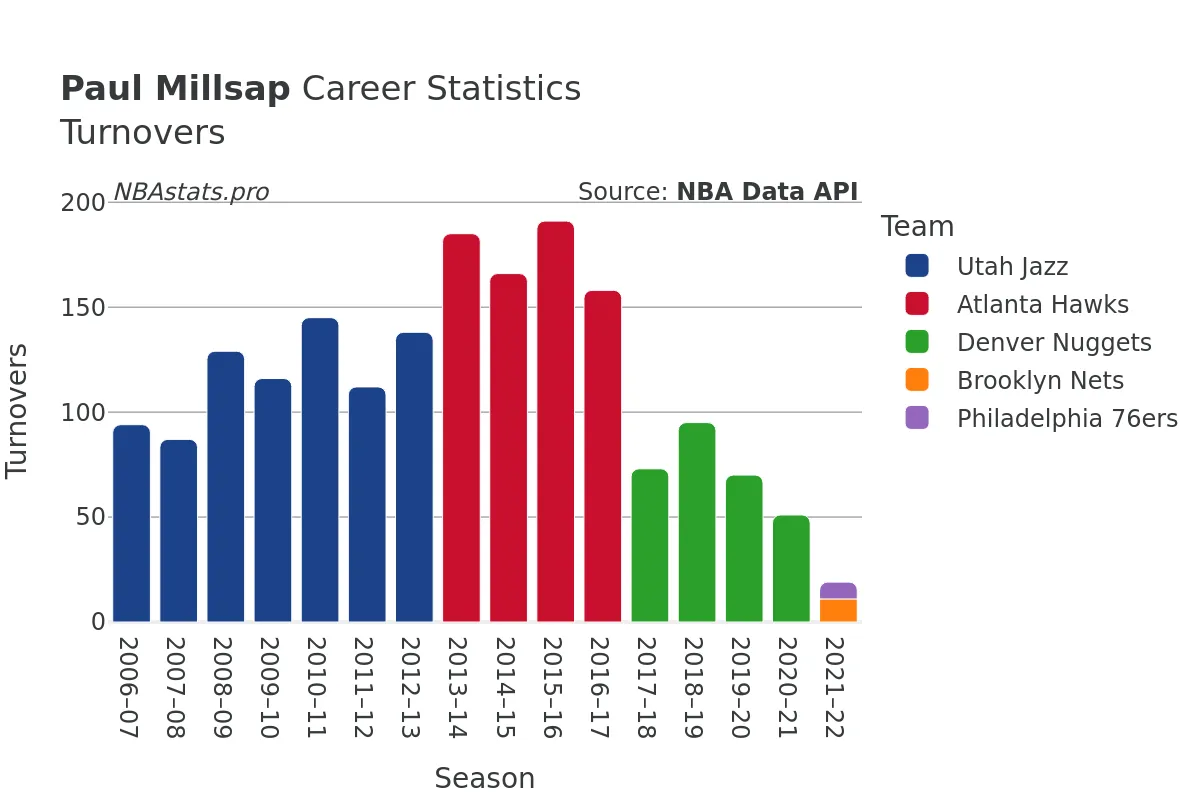
Turnovers
Blocks
Paul Millsap Career Stats Table
| SEASON | TEAM | AGE | GP | GS | MIN | FGM | FGA | FG % | FG3M | FG3A | FG3 % | FTM | FTA | FT % | OREB | DREB | REB | AST | STL | BLK | TOV | PF | PTS | |
|---|---|---|---|---|---|---|---|---|---|---|---|---|---|---|---|---|---|---|---|---|---|---|---|---|
| 1 | 2006-07 | UTA | 22 | 82 | 1 | 1,472 | 209 | 398 | 52.5% | 1 | 3 | 33.3% | 140 | 208 | 67.3% | 183 | 240 | 423 | 62 | 67 | 74 | 94 | 236 | 559 |
| 2 | 2007-08 | UTA | 23 | 82 | 2 | 1,702 | 253 | 502 | 50.4% | 0 | 4 | 0.0% | 155 | 229 | 67.7% | 167 | 293 | 460 | 81 | 72 | 73 | 87 | 269 | 661 |
| 3 | 2008-09 | UTA | 24 | 76 | 38 | 2,290 | 400 | 749 | 53.4% | 0 | 4 | 0.0% | 228 | 326 | 69.9% | 251 | 403 | 654 | 138 | 78 | 73 | 129 | 288 | 1,028 |
| 4 | 2009-10 | UTA | 25 | 82 | 8 | 2,277 | 385 | 716 | 53.8% | 1 | 9 | 11.1% | 183 | 264 | 69.3% | 186 | 373 | 559 | 131 | 64 | 99 | 116 | 285 | 954 |
| 5 | 2010-11 | UTA | 26 | 76 | 76 | 2,605 | 525 | 988 | 53.1% | 9 | 23 | 39.1% | 256 | 338 | 75.7% | 164 | 415 | 579 | 187 | 103 | 69 | 145 | 272 | 1,315 |
| 6 | 2011-12 | UTA | 27 | 64 | 62 | 2,100 | 426 | 861 | 49.5% | 7 | 31 | 22.6% | 202 | 255 | 79.2% | 180 | 383 | 563 | 150 | 118 | 52 | 112 | 222 | 1,061 |
| 7 | 2012-13 | UTA | 28 | 78 | 78 | 2,375 | 429 | 875 | 49.0% | 13 | 39 | 33.3% | 264 | 356 | 74.2% | 177 | 377 | 554 | 201 | 102 | 80 | 138 | 232 | 1,135 |
| 8 | 2013-14 | ATL | 29 | 74 | 73 | 2,482 | 483 | 1,047 | 46.1% | 76 | 212 | 35.8% | 286 | 391 | 73.1% | 154 | 473 | 627 | 232 | 129 | 78 | 185 | 210 | 1,328 |
| 9 | 2014-15 | ATL | 30 | 73 | 73 | 2,390 | 443 | 930 | 47.6% | 77 | 216 | 35.6% | 255 | 337 | 75.7% | 139 | 431 | 570 | 223 | 130 | 69 | 166 | 201 | 1,218 |
| 10 | 2015-16 | ATL | 31 | 81 | 81 | 2,647 | 501 | 1,066 | 47.0% | 74 | 232 | 31.9% | 309 | 408 | 75.7% | 198 | 534 | 732 | 265 | 147 | 139 | 191 | 237 | 1,385 |
| 11 | 2016-17 | ATL | 32 | 69 | 67 | 2,343 | 430 | 972 | 44.2% | 75 | 241 | 31.1% | 311 | 405 | 76.8% | 111 | 422 | 533 | 252 | 90 | 62 | 158 | 186 | 1,246 |
| 12 | 2017-18 | DEN | 33 | 38 | 37 | 1,143 | 202 | 435 | 46.4% | 39 | 113 | 34.5% | 112 | 161 | 69.6% | 65 | 180 | 245 | 105 | 39 | 44 | 73 | 99 | 555 |
| 13 | 2018-19 | DEN | 34 | 70 | 65 | 1,895 | 322 | 665 | 48.4% | 58 | 159 | 36.5% | 181 | 249 | 72.7% | 153 | 352 | 505 | 141 | 83 | 54 | 95 | 183 | 883 |
| 14 | 2019-20 | DEN | 35 | 51 | 48 | 1,240 | 211 | 438 | 48.2% | 54 | 124 | 43.5% | 115 | 141 | 81.6% | 98 | 195 | 293 | 83 | 44 | 30 | 70 | 150 | 591 |
| 15 | 2020-21 | DEN | 36 | 56 | 36 | 1,162 | 191 | 401 | 47.6% | 49 | 143 | 34.3% | 71 | 98 | 72.4% | 76 | 186 | 262 | 98 | 51 | 36 | 51 | 111 | 502 |
| 16 | 2021-22 | BKN | 37 | 24 | 0 | 270 | 32 | 85 | 37.6% | 6 | 27 | 22.2% | 12 | 17 | 70.6% | 29 | 60 | 89 | 24 | 5 | 11 | 11 | 48 | 82 |
| 17 | 2021-22 | PHI | 37 | 9 | 1 | 106 | 13 | 30 | 43.3% | 2 | 8 | 25.0% | 5 | 7 | 71.4% | 12 | 13 | 25 | 5 | 5 | 2 | 8 | 19 | 33 |
| 18 | 2021-22 | TOT | 37 | 33 | 1 | 376 | 45 | 115 | 39.1% | 8 | 35 | 22.9% | 17 | 24 | 70.8% | 41 | 73 | 114 | 29 | 10 | 13 | 19 | 67 | 115 |
Max Min
NBA Alltime Leaders
Games Played
Robert Parish: 1,611Kareem Abdul-Jabbar: 1,560
Vince Carter: 1,541
Dirk Nowitzki: 1,522
John Stockton: 1,504
Points
LeBron James: 40,474Kareem Abdul-Jabbar: 38,387
Karl Malone: 36,928
Kobe Bryant: 33,643
Michael Jordan: 32,292
Steals
John Stockton: 3,265Jason Kidd: 2,684
Chris Paul: 2,614
Michael Jordan: 2,514
Gary Payton: 2,445
Free Throws Made
Karl Malone: 9,787Moses Malone: 8,531
LeBron James: 8,390
Kobe Bryant: 8,378
Oscar Robertson: 7,694