Paul George Stats: NBA Career

Introducing Paul George: A Versatile NBA Star
Paul George, a prominent NBA player, has made a significant impact on the basketball world with his versatile skills and impressive stats. His journey through the league has seen him play for the Indiana Pacers, Oklahoma City Thunder, and currently, the Los Angeles Clippers, showcasing his adaptability and prowess on the court. Let's delve into the numbers and explore what makes Paul George a standout player in the NBA.
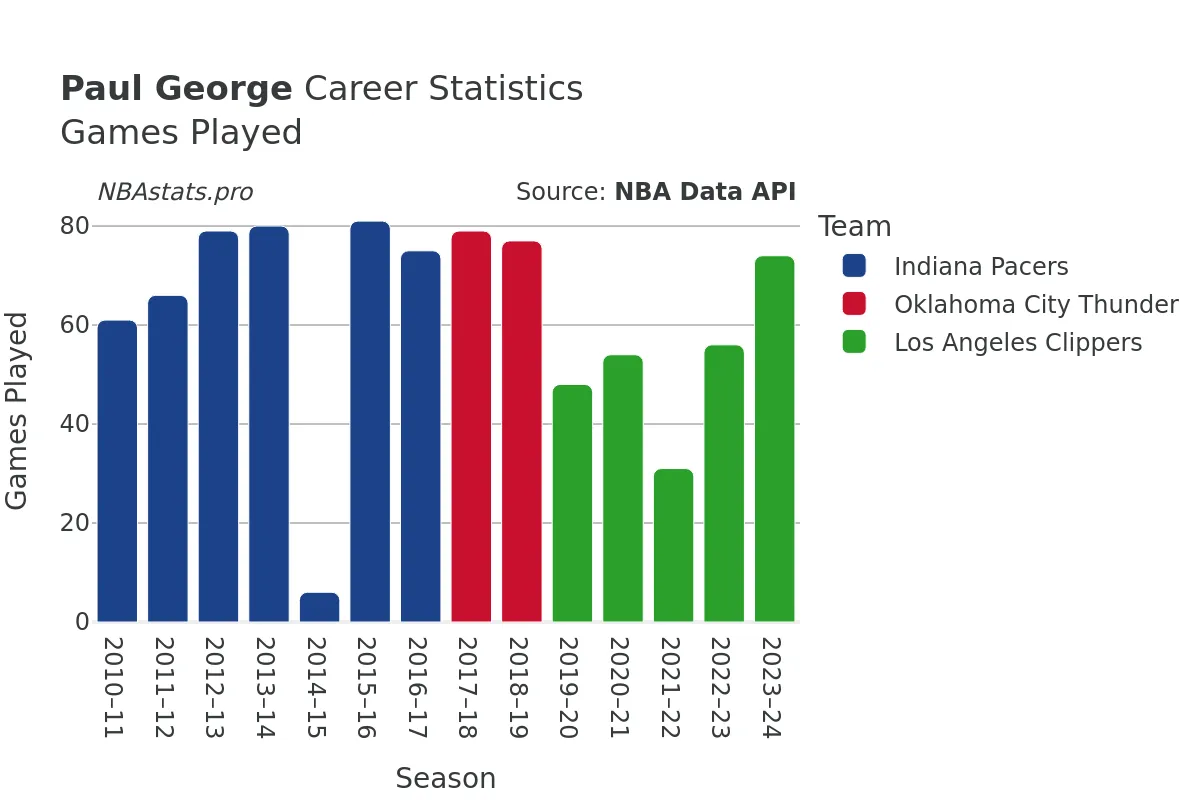
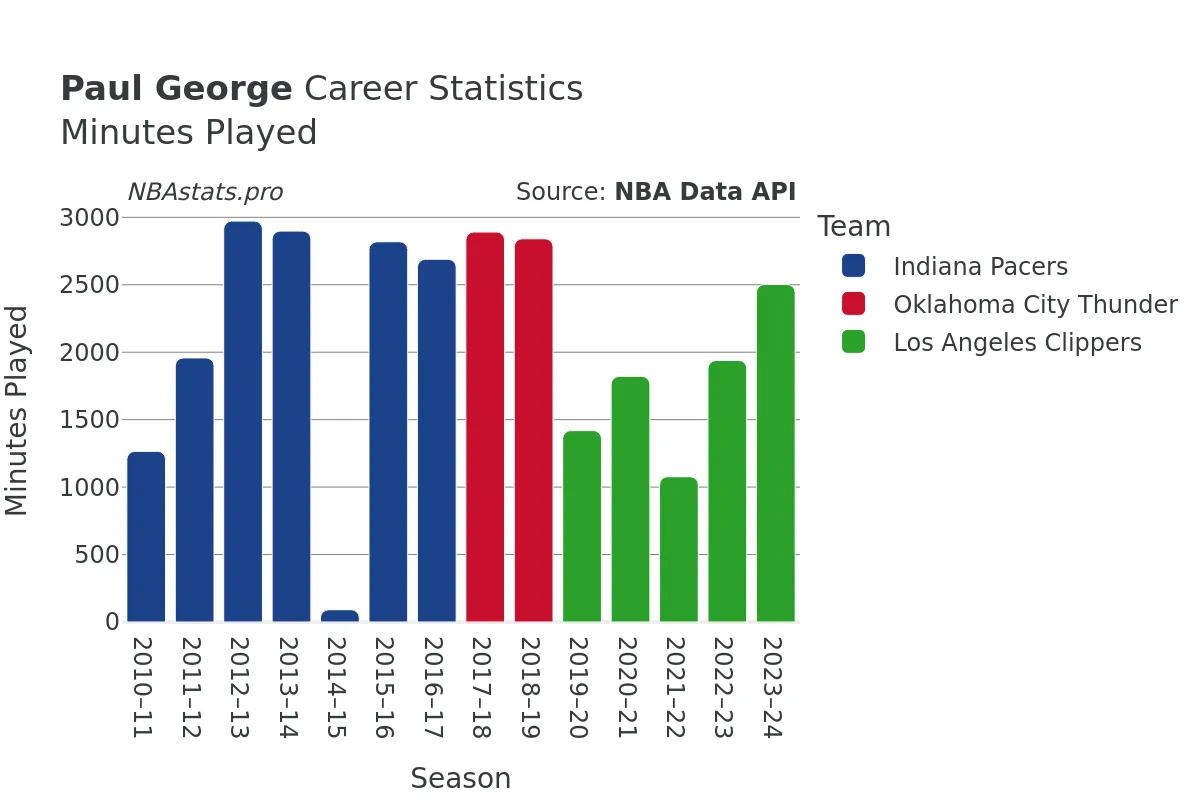
Paul George's career took of...f in the 2010-11 season when he made his debut at the young age of 21. Since then, he has been a consistent and valuable asset to his teams, racking up an impressive 867 games played over the years. His dedication and resilience are evident in the substantial 29,182 minutes he has spent on the court, contributing to his team's success.
A mark of a great player is their scoring ability, and Paul George does not disappoint in this aspect. With 13,983 goals attempted and 6,155 goals made, he maintains a solid field goal percentage of approximately 44%. This efficiency highlights his scoring prowess and ability to make an impact in crucial moments during games.
Not only is Paul George a threat from the field, but he also excels at the free-throw line. With 4,063 free throws attempted and an impressive 3,469 made, he demonstrates consistency and composure when given opportunities to score from the charity stripe. His free-throw percentage indicates his reliability in crucial moments and underscores his value as a clutch performer.
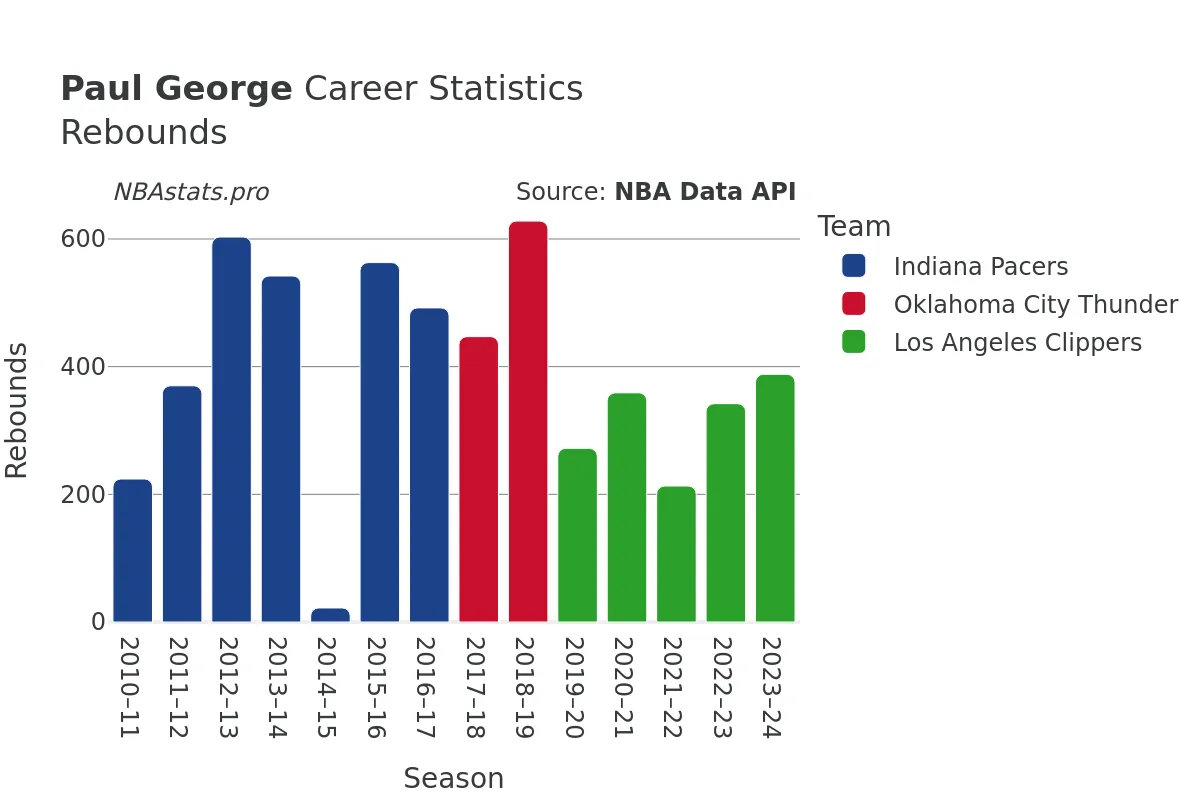
Rebounding is another facet of Paul George's game where he shines brightly. Amassing a total of 5,465 rebounds throughout his career, he proves to be a force to be reckoned with on the boards. His ability to secure both defensive and offensive rebounds - 4,739 and 726, respectively - showcases his tenacity and determination in battling for possession, further solidifying his all-around skill set.
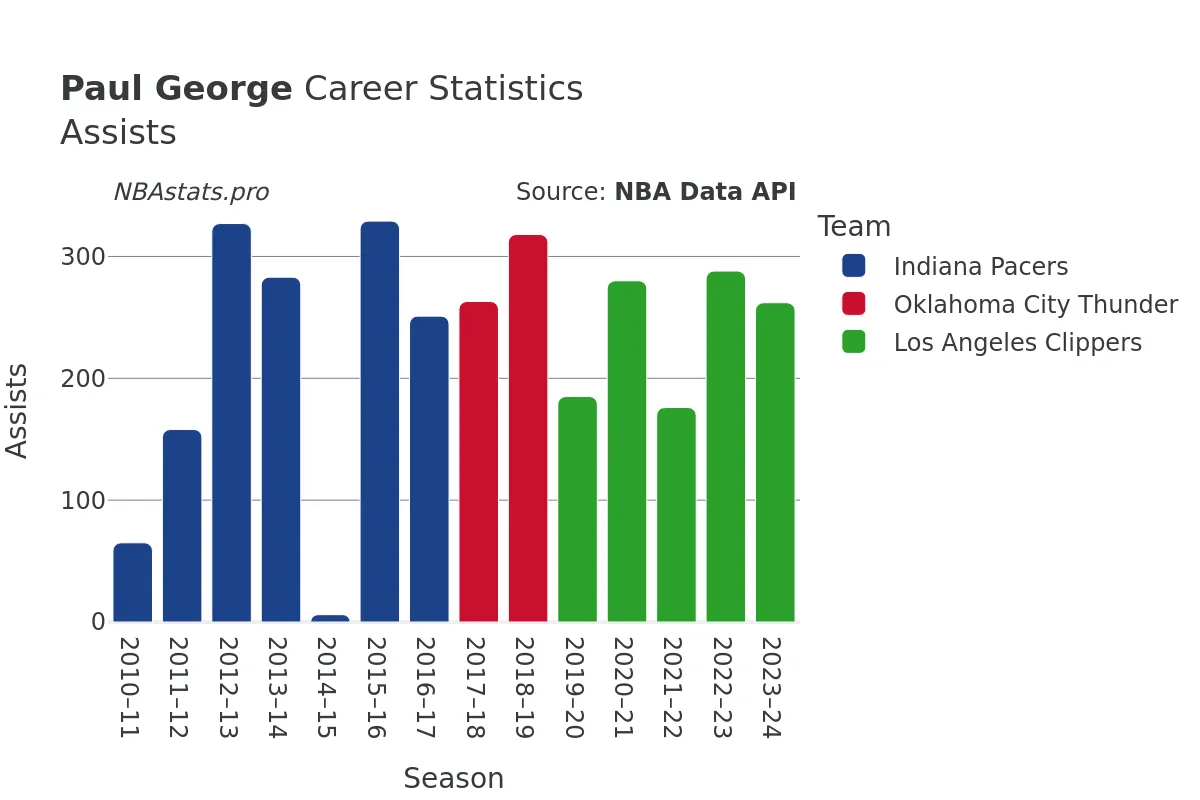
When it comes to facilitating plays and involving his teammates, Paul George is a maestro on the court. With 3,191 assists to his name, he displays a keen basketball IQ and playmaking ability that elevates his team's performance. His vision and unselfishness make him a valuable asset in setting up scoring opportunities for his teammates and ensuring overall team success.
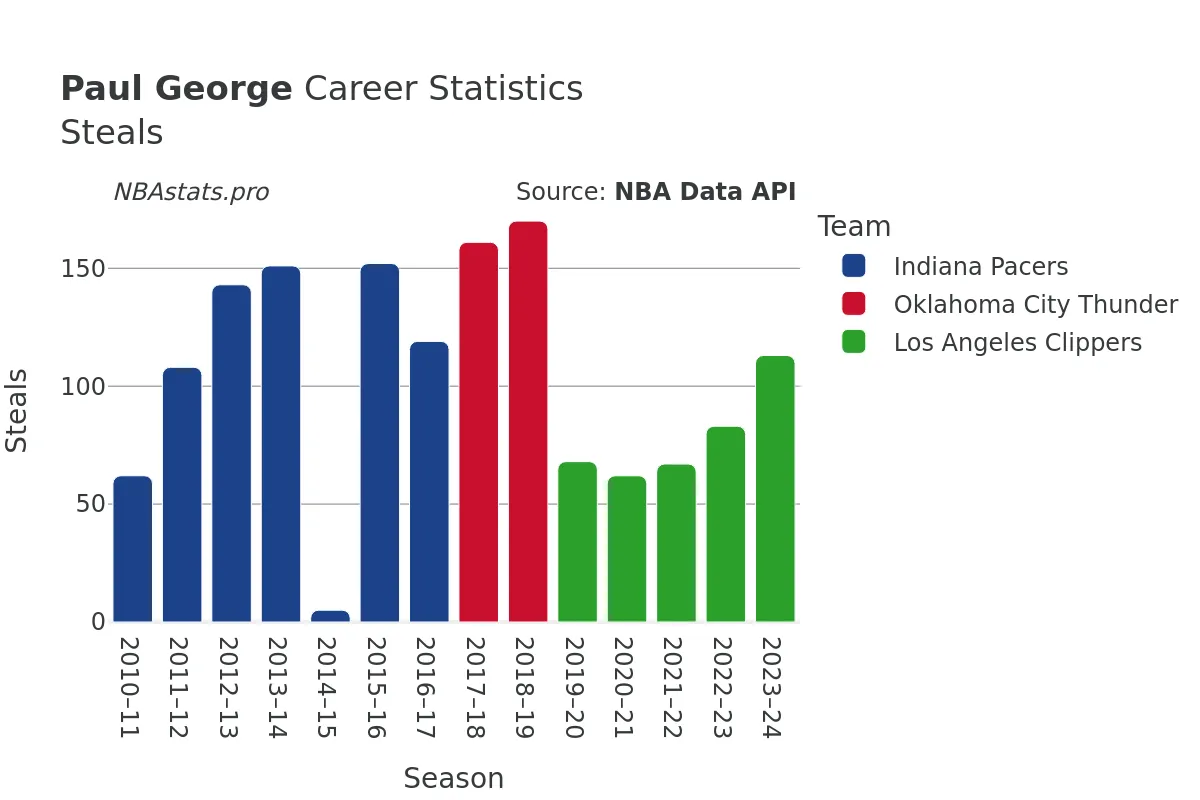
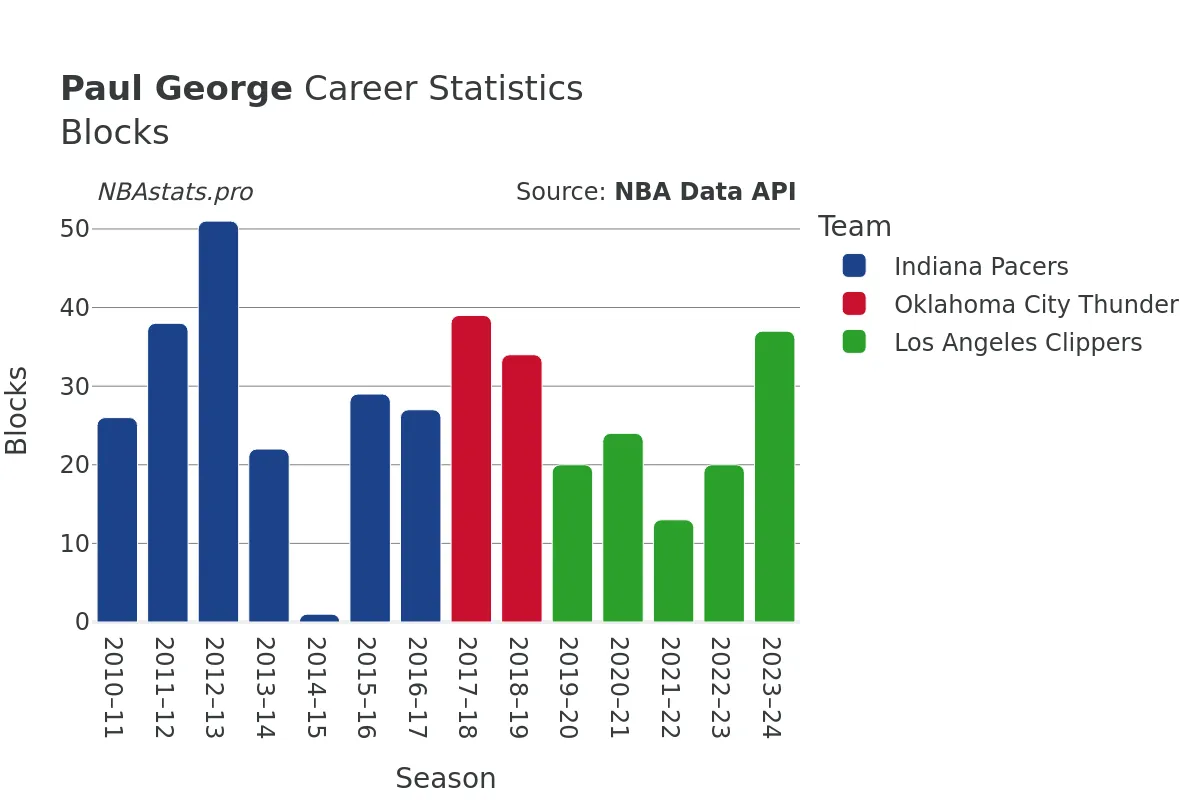
Defensively, Paul George is a stalwart with 1,464 steals and 381 blocks in his career. His defensive prowess and knack for disrupting opponents' plays make him a formidable force on the court. His ability to generate turnovers and provide crucial stops highlight his impact on both ends of the floor and solidify his reputation as a two-way player.
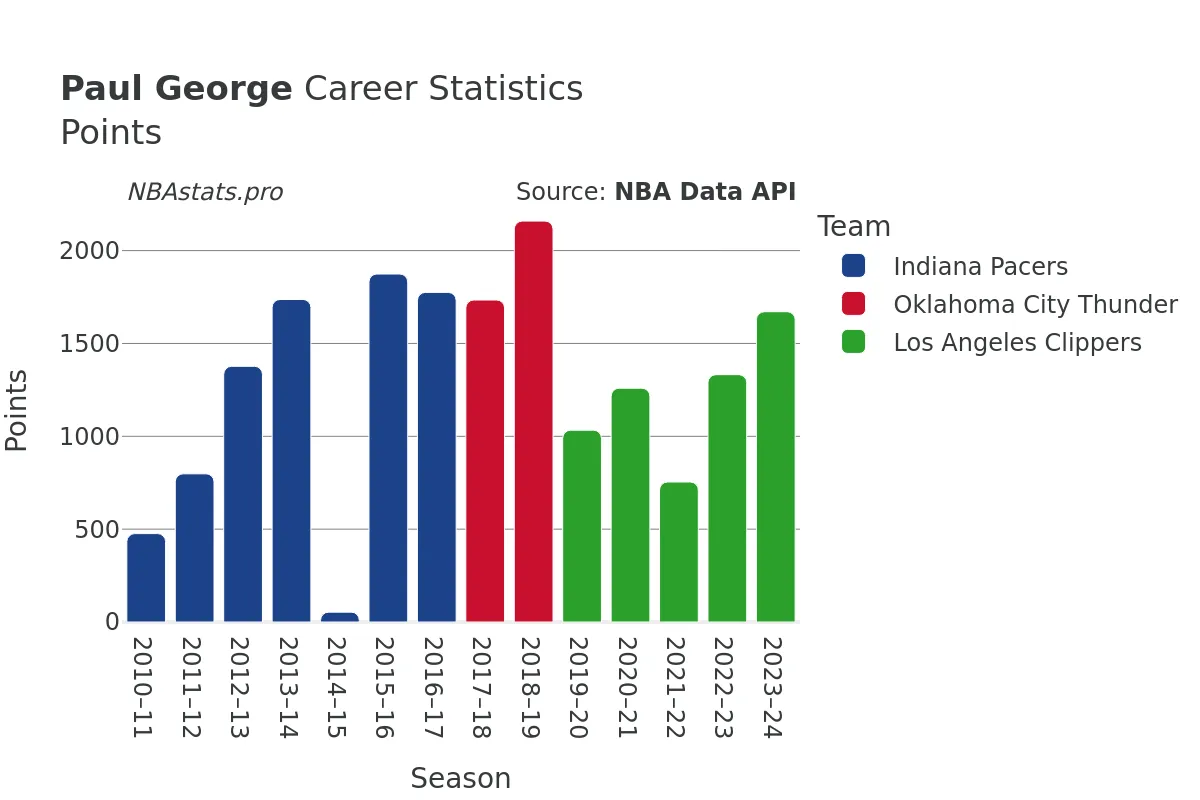
In terms of scoring, Paul George has amassed an impressive 18,032 points throughout his career, further underscoring his offensive prowess and ability to put up numbers consistently. His scoring proficiency, combined with his contributions in rebounding, assists, steals, and blocks, paints a comprehensive picture of a well-rounded player who excels in multiple facets of the game.
As Paul George continues to make his mark in the NBA, his dedication to the sport and relentless pursuit of excellence set him apart as a true basketball star. His journey through different teams and cities has shaped him into the player he is today, and his impact on the court is undeniable. Dive into the charts and statistics to gain a deeper understanding of Paul George's impressive career and the legacy he continues to build in the world of basketball.
Read more
Games Played
Points
Assists
Rebounds
Steals
Minutes Played
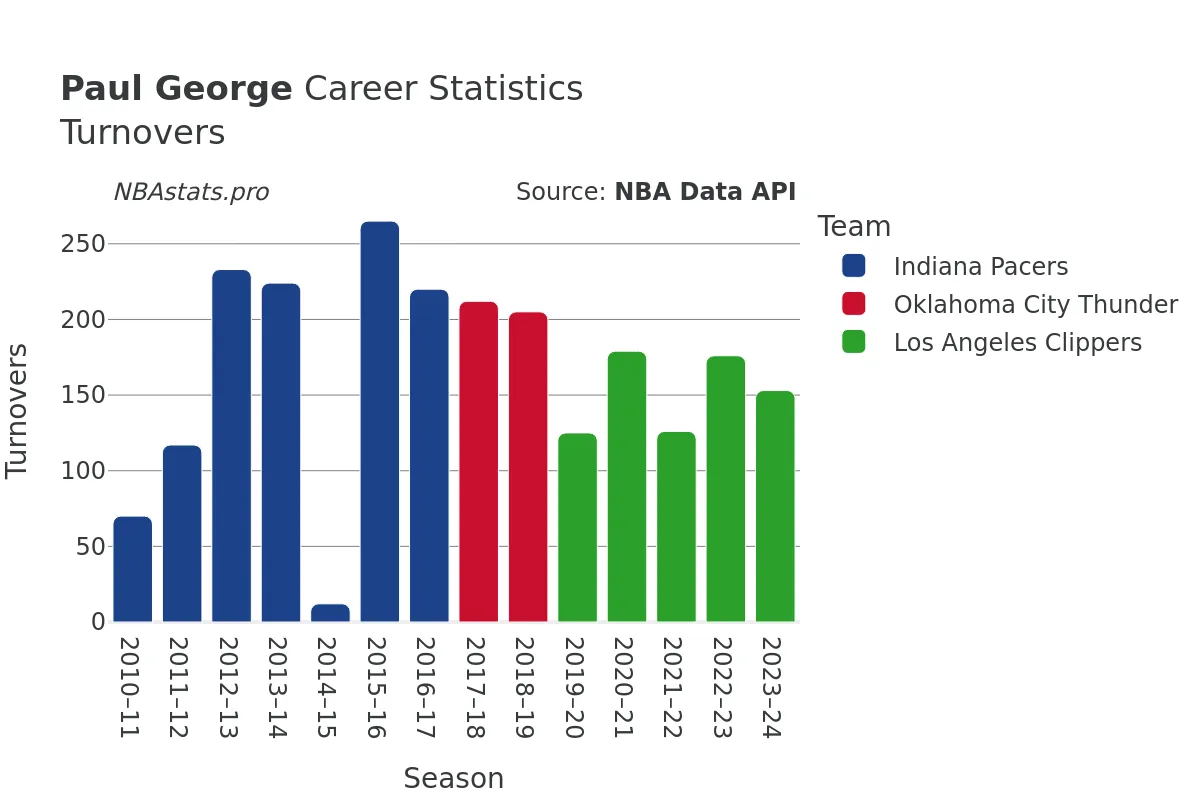
Turnovers
Blocks
Paul George Career Stats Table
| SEASON | TEAM | AGE | GP | GS | MIN | FGM | FGA | FG % | FG3M | FG3A | FG3 % | FTM | FTA | FT % | OREB | DREB | REB | AST | STL | BLK | TOV | PF | PTS | |
|---|---|---|---|---|---|---|---|---|---|---|---|---|---|---|---|---|---|---|---|---|---|---|---|---|
| 1 | 2010-11 | IND | 21 | 61 | 19 | 1,265 | 179 | 395 | 45.3% | 41 | 138 | 29.7% | 77 | 101 | 76.2% | 37 | 187 | 224 | 65 | 62 | 26 | 70 | 127 | 476 |
| 2 | 2011-12 | IND | 22 | 66 | 66 | 1,958 | 281 | 639 | 44.0% | 90 | 234 | 38.5% | 146 | 182 | 80.2% | 56 | 314 | 370 | 158 | 108 | 38 | 117 | 191 | 798 |
| 3 | 2012-13 | IND | 23 | 79 | 79 | 2,972 | 493 | 1,176 | 41.9% | 170 | 469 | 36.2% | 221 | 274 | 80.7% | 88 | 515 | 603 | 327 | 143 | 51 | 233 | 227 | 1,377 |
| 4 | 2013-14 | IND | 24 | 80 | 80 | 2,898 | 577 | 1,362 | 42.4% | 182 | 500 | 36.4% | 401 | 464 | 86.4% | 64 | 478 | 542 | 283 | 151 | 22 | 224 | 198 | 1,737 |
| 5 | 2014-15 | IND | 25 | 6 | 0 | 91 | 18 | 49 | 36.7% | 9 | 22 | 40.9% | 8 | 11 | 72.7% | 4 | 18 | 22 | 6 | 5 | 1 | 12 | 11 | 53 |
| 6 | 2015-16 | IND | 26 | 81 | 81 | 2,819 | 605 | 1,449 | 41.8% | 210 | 566 | 37.1% | 454 | 528 | 86.0% | 79 | 484 | 563 | 329 | 152 | 29 | 265 | 230 | 1,874 |
| 7 | 2016-17 | IND | 27 | 75 | 75 | 2,689 | 622 | 1,348 | 46.1% | 195 | 496 | 39.3% | 336 | 374 | 89.8% | 58 | 434 | 492 | 251 | 119 | 27 | 220 | 206 | 1,775 |
| 8 | 2017-18 | OKC | 28 | 79 | 79 | 2,891 | 576 | 1,340 | 43.0% | 244 | 609 | 40.1% | 338 | 411 | 82.2% | 72 | 375 | 447 | 263 | 161 | 39 | 212 | 233 | 1,734 |
| 9 | 2018-19 | OKC | 29 | 77 | 77 | 2,841 | 707 | 1,614 | 43.8% | 292 | 757 | 38.6% | 453 | 540 | 83.9% | 105 | 523 | 628 | 318 | 170 | 34 | 205 | 214 | 2,159 |
| 10 | 2019-20 | LAC | 30 | 48 | 48 | 1,419 | 343 | 782 | 43.9% | 157 | 381 | 41.2% | 190 | 217 | 87.6% | 24 | 248 | 272 | 185 | 68 | 20 | 125 | 113 | 1,033 |
| 11 | 2020-21 | LAC | 31 | 54 | 54 | 1,821 | 445 | 953 | 46.7% | 171 | 416 | 41.1% | 198 | 228 | 86.8% | 45 | 314 | 359 | 280 | 62 | 24 | 179 | 132 | 1,259 |
| 12 | 2021-22 | LAC | 32 | 31 | 31 | 1,077 | 268 | 636 | 42.1% | 91 | 257 | 35.4% | 127 | 148 | 85.8% | 12 | 201 | 213 | 176 | 67 | 13 | 126 | 74 | 754 |
| 13 | 2022-23 | LAC | 33 | 56 | 56 | 1,939 | 459 | 1,004 | 45.7% | 158 | 426 | 37.1% | 256 | 294 | 87.1% | 45 | 297 | 342 | 288 | 83 | 20 | 176 | 159 | 1,332 |
| 14 | 2023-24 | LAC | 34 | 74 | 74 | 2,502 | 582 | 1,236 | 47.1% | 243 | 588 | 41.3% | 264 | 291 | 90.7% | 37 | 351 | 388 | 262 | 113 | 37 | 153 | 202 | 1,671 |
Max Min
NBA Alltime Leaders
Games Played
Robert Parish: 1,611Kareem Abdul-Jabbar: 1,560
Vince Carter: 1,541
Dirk Nowitzki: 1,522
John Stockton: 1,504
Points
LeBron James: 40,474Kareem Abdul-Jabbar: 38,387
Karl Malone: 36,928
Kobe Bryant: 33,643
Michael Jordan: 32,292
Steals
John Stockton: 3,265Jason Kidd: 2,684
Chris Paul: 2,614
Michael Jordan: 2,514
Gary Payton: 2,445
Free Throws Made
Karl Malone: 9,787Moses Malone: 8,531
LeBron James: 8,390
Kobe Bryant: 8,378
Oscar Robertson: 7,694