Michael Finley Stats: NBA Career

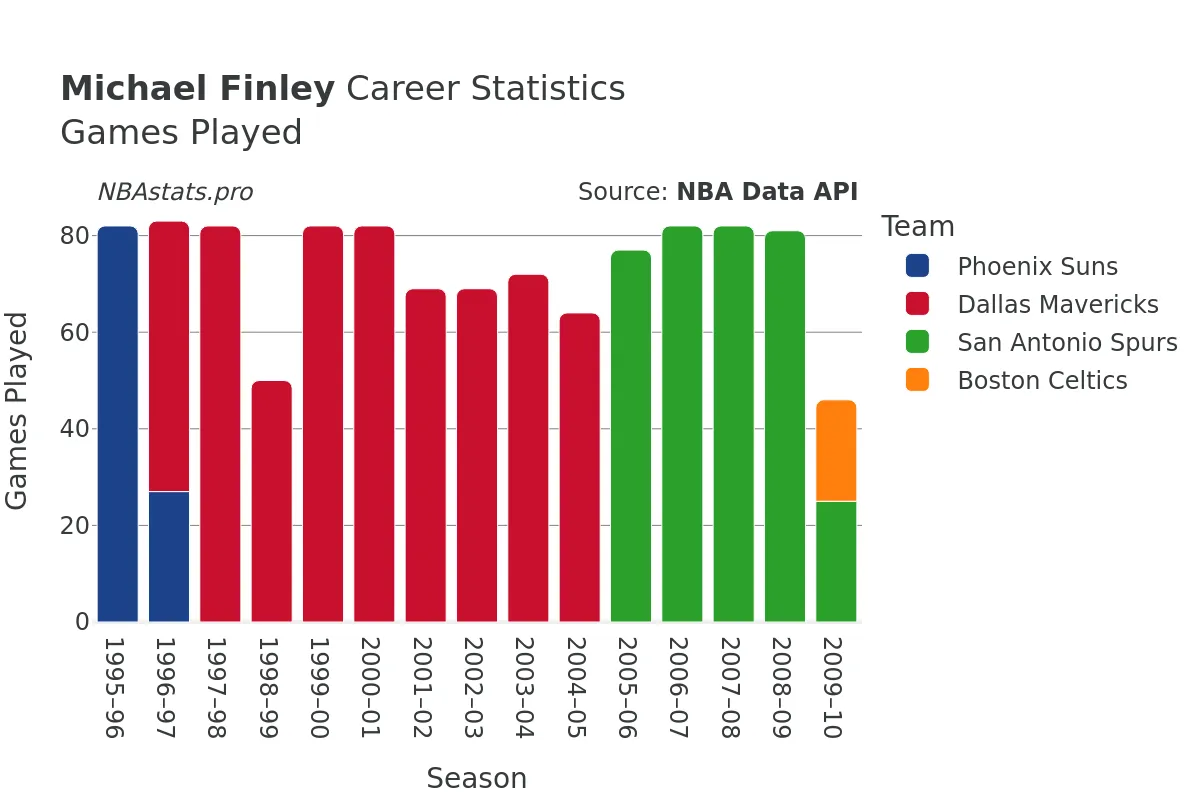
Michael Finley, a former NBA player, left a lasting impact on the basketball court during his tenure with the Phoenix Suns, Dallas Mavericks, San Antonio Spurs, and Boston Celtics. With a career spanning from the 1995-96 season to the 2009-10 season, Finley showcased his athletic prowess in various cities across the United States, including Phoenix, Dallas, San Antonio, and Boston.
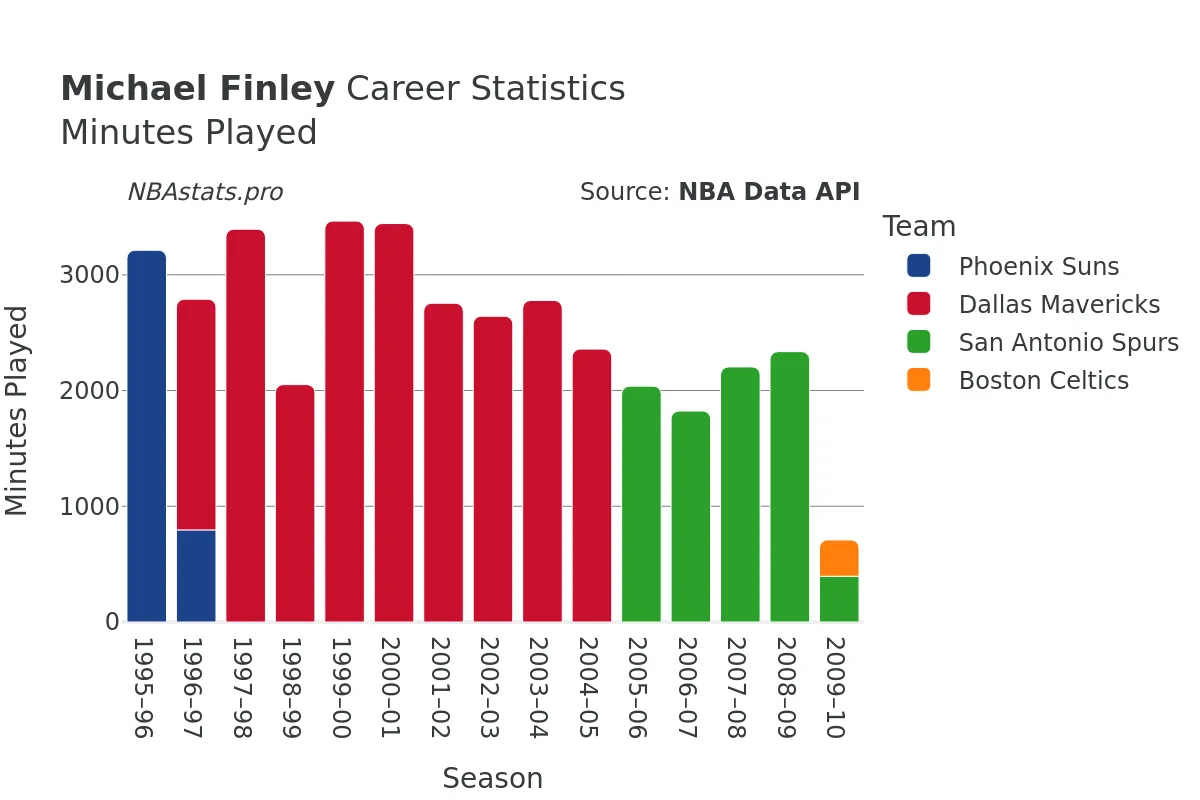
Throughout his 1232 games played, Finley amassed an impressive total of 41,493 minutes on the court. A versatile p...layer, he proved to be a consistent scorer, with 7252 goals made out of 16,350 attempted, boasting an impressive shooting percentage of 44.35%. His offensive capabilities extended to the free-throw line, where he demonstrated his skill by making 2666 out of 3292 attempts, showcasing a reliable free-throw percentage.
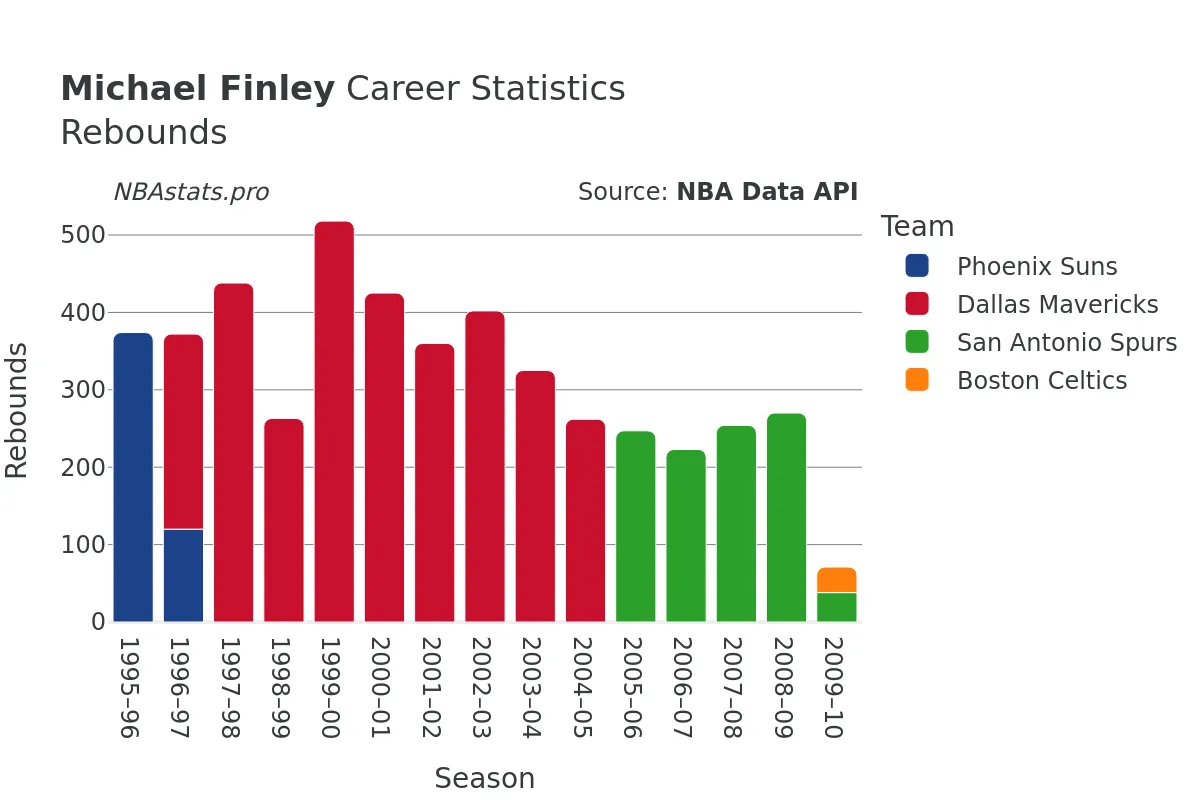
Rebounds played a significant role in Finley's game, with a total of 5247 rebounds throughout his career. Of these, 4032 were defensive rebounds, highlighting his defensive presence on the court, while 1215 were offensive rebounds, demonstrating his ability to capitalize on scoring opportunities.
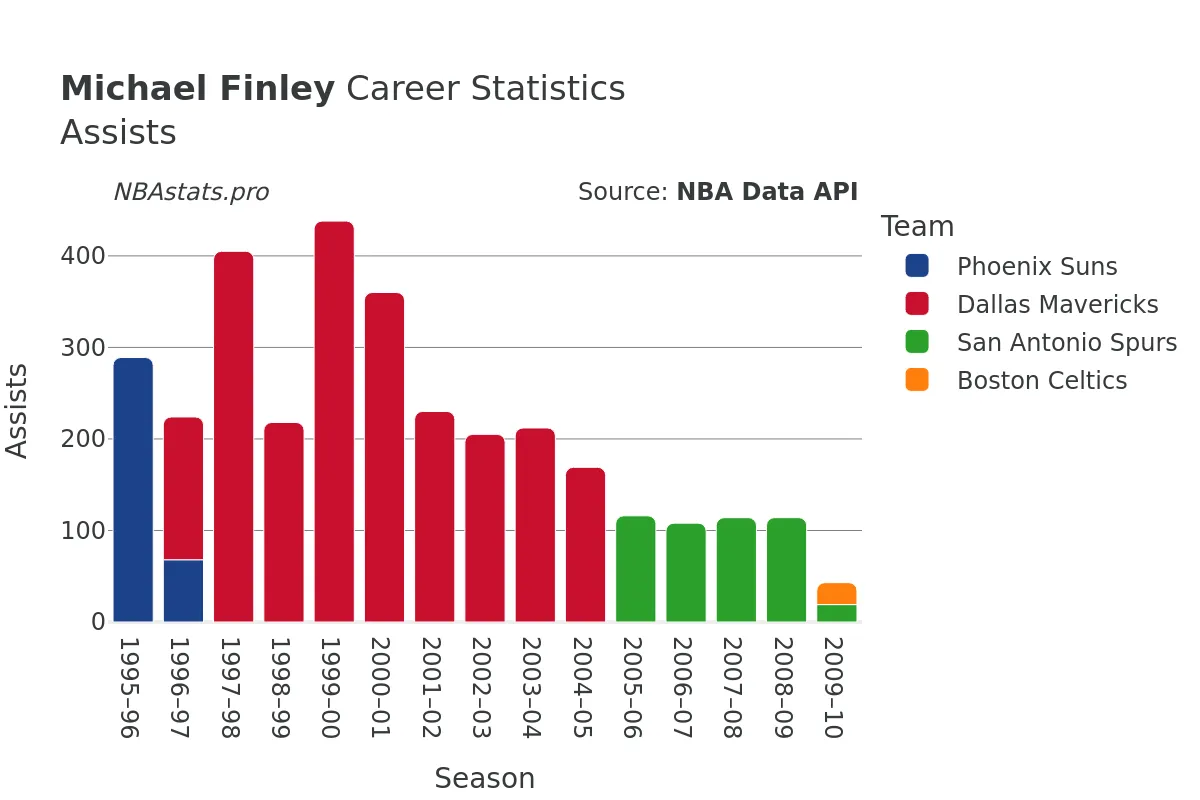
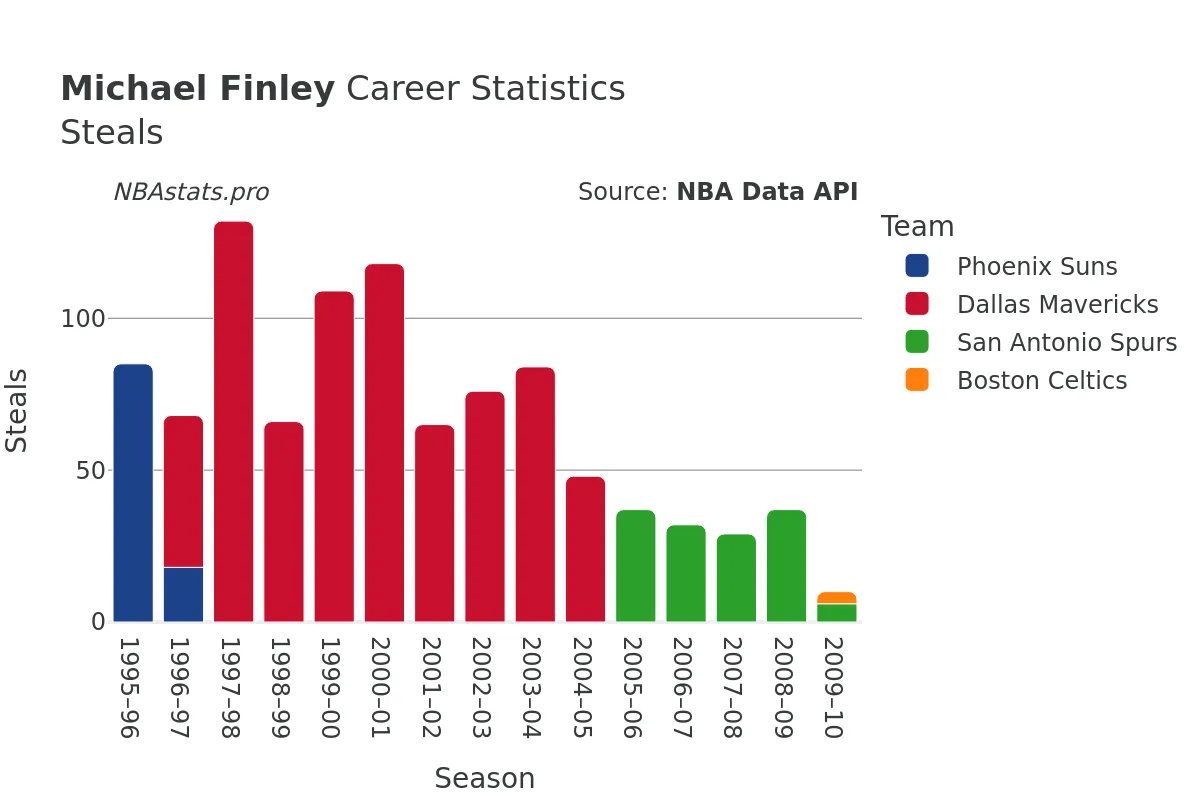
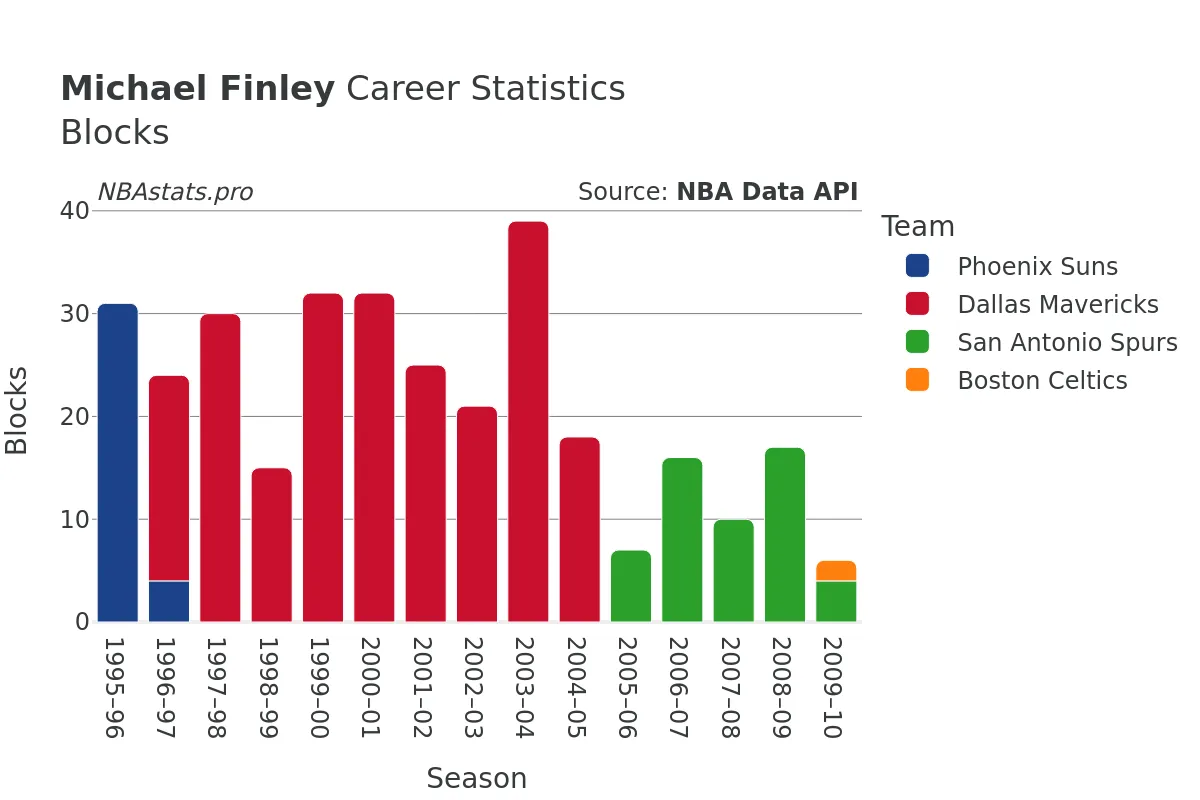
Finley's impact was not limited to scoring and rebounding; he was also a proficient playmaker, amassing 3512 assists over his career. Additionally, his defensive prowess was evident in his 1074 steals and 353 blocks, showcasing his ability to disrupt opponents' plays and protect the rim when needed.
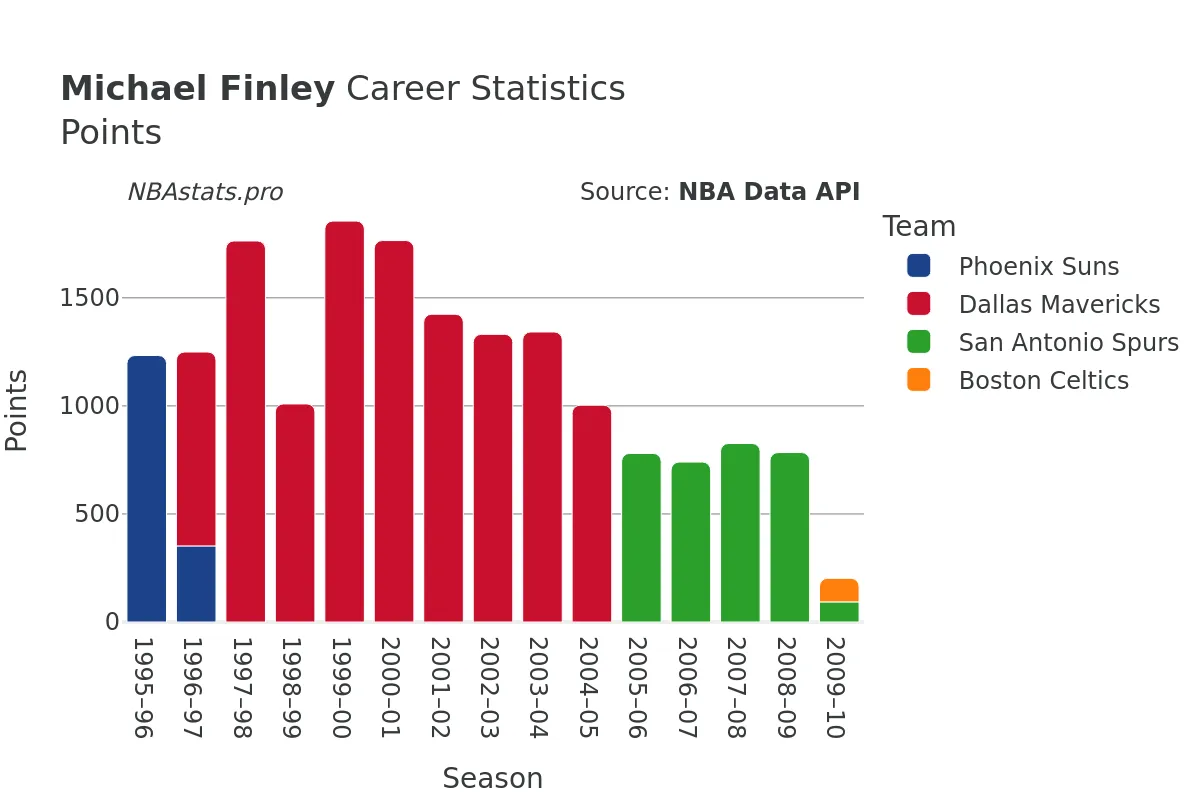
In total, Finley accumulated an impressive 18,757 points throughout his NBA career, making him a key player on whichever team he played for. Despite his retirement from professional basketball, his legacy continues to inspire basketball enthusiasts and aspiring players.
As a basketball analyst, delving into the statistics of Michael Finley's career provides a deeper understanding of his impact on the game. His consistency, versatility, and all-around skills make him a fascinating player to study. By examining his shooting percentages, rebounding capabilities, playmaking skills, and defensive contributions, one can truly appreciate the full extent of his talents on the court.
Whether you are a fan of the Phoenix Suns, Dallas Mavericks, San Antonio Spurs, or Boston Celtics, exploring Michael Finley's career statistics offers valuable insights into the gameplay and strategies that made him a standout player in the NBA. So, grab a seat, get comfortable, and dive into the charts to uncover the fascinating story of Michael Finley's basketball journey.
Read more
Games Played
Points
Assists
Rebounds
Steals
Minutes Played
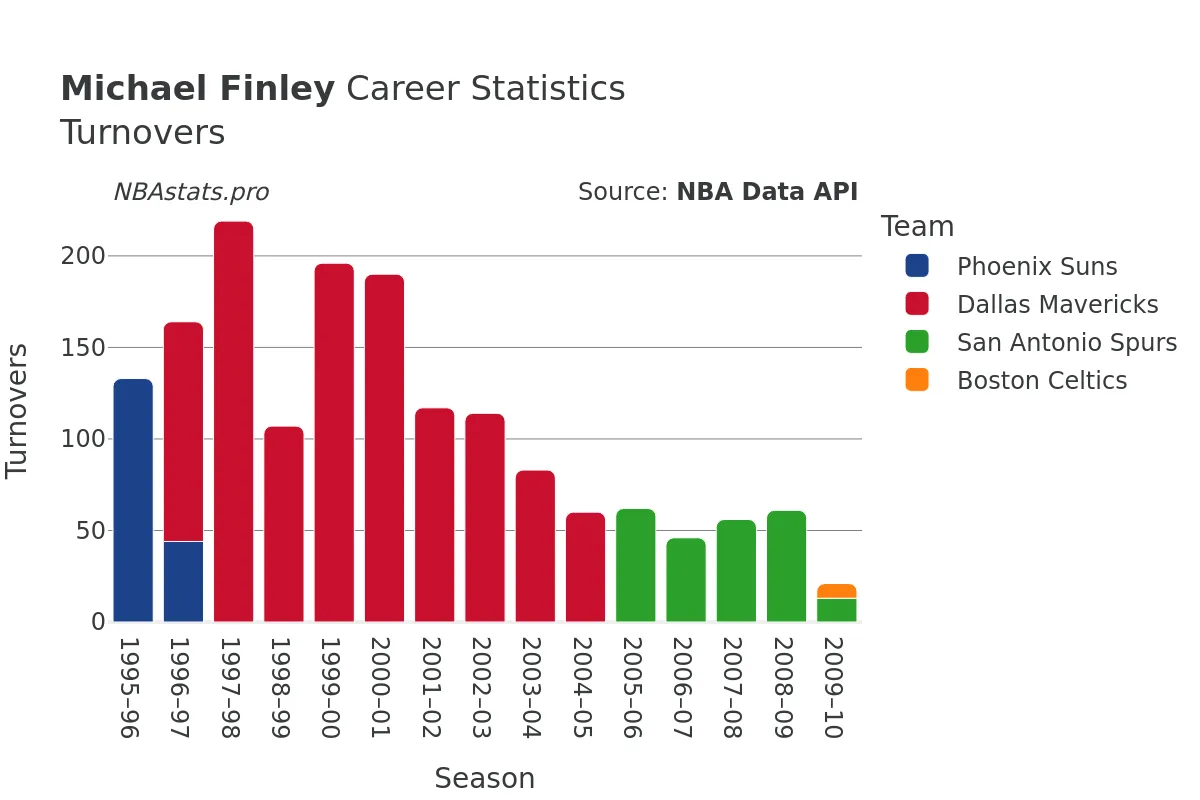
Turnovers
Blocks
Michael Finley Career Stats Table
| SEASON | TEAM | AGE | GP | GS | MIN | FGM | FGA | FG % | FG3M | FG3A | FG3 % | FTM | FTA | FT % | OREB | DREB | REB | AST | STL | BLK | TOV | PF | PTS | |
|---|---|---|---|---|---|---|---|---|---|---|---|---|---|---|---|---|---|---|---|---|---|---|---|---|
| 1 | 1995-96 | PHX | 23 | 82 | 72 | 3,212 | 465 | 976 | 47.6% | 61 | 186 | 32.8% | 242 | 323 | 74.9% | 139 | 235 | 374 | 289 | 85 | 31 | 133 | 199 | 1,233 |
| 2 | 1996-97 | PHX | 24 | 27 | 18 | 796 | 141 | 297 | 47.5% | 14 | 55 | 25.5% | 56 | 69 | 81.2% | 34 | 86 | 120 | 68 | 18 | 4 | 44 | 42 | 352 |
| 3 | 1996-97 | DAL | 24 | 56 | 36 | 1,993 | 334 | 774 | 43.2% | 87 | 225 | 38.7% | 142 | 176 | 80.7% | 54 | 198 | 252 | 156 | 50 | 20 | 120 | 96 | 897 |
| 4 | 1996-97 | TOT | 24 | 83 | 54 | 2,789 | 475 | 1,071 | 44.4% | 101 | 280 | 36.1% | 198 | 245 | 80.8% | 88 | 284 | 372 | 224 | 68 | 24 | 164 | 138 | 1,249 |
| 5 | 1997-98 | DAL | 25 | 82 | 82 | 3,394 | 675 | 1,505 | 44.9% | 87 | 244 | 35.7% | 326 | 416 | 78.4% | 150 | 288 | 438 | 405 | 132 | 30 | 219 | 163 | 1,763 |
| 6 | 1998-99 | DAL | 26 | 50 | 50 | 2,051 | 389 | 876 | 44.4% | 45 | 136 | 33.1% | 186 | 226 | 82.3% | 69 | 194 | 263 | 218 | 66 | 15 | 107 | 96 | 1,009 |
| 7 | 1999-00 | DAL | 27 | 82 | 82 | 3,464 | 748 | 1,636 | 45.7% | 99 | 247 | 40.1% | 260 | 317 | 82.0% | 122 | 396 | 518 | 438 | 109 | 32 | 196 | 171 | 1,855 |
| 8 | 2000-01 | DAL | 28 | 82 | 82 | 3,443 | 711 | 1,552 | 45.8% | 91 | 263 | 34.6% | 252 | 325 | 77.5% | 109 | 316 | 425 | 360 | 118 | 32 | 190 | 174 | 1,765 |
| 9 | 2001-02 | DAL | 29 | 69 | 69 | 2,754 | 569 | 1,228 | 46.3% | 76 | 224 | 33.9% | 210 | 251 | 83.7% | 90 | 270 | 360 | 230 | 65 | 25 | 117 | 144 | 1,424 |
| 10 | 2002-03 | DAL | 30 | 69 | 69 | 2,642 | 507 | 1,193 | 42.5% | 119 | 322 | 37.0% | 198 | 230 | 86.1% | 107 | 295 | 402 | 205 | 76 | 21 | 114 | 105 | 1,331 |
| 11 | 2003-04 | DAL | 31 | 72 | 72 | 2,778 | 514 | 1,159 | 44.3% | 150 | 370 | 40.5% | 164 | 193 | 85.0% | 78 | 247 | 325 | 212 | 84 | 39 | 83 | 118 | 1,342 |
| 12 | 2004-05 | DAL | 32 | 64 | 64 | 2,358 | 387 | 907 | 42.7% | 116 | 285 | 40.7% | 113 | 136 | 83.1% | 45 | 217 | 262 | 169 | 48 | 18 | 60 | 123 | 1,003 |
| 13 | 2005-06 | SAS | 33 | 77 | 18 | 2,038 | 286 | 695 | 41.2% | 110 | 279 | 39.4% | 98 | 115 | 85.2% | 31 | 216 | 247 | 116 | 37 | 7 | 62 | 97 | 780 |
| 14 | 2006-07 | SAS | 34 | 82 | 16 | 1,823 | 273 | 663 | 41.2% | 104 | 286 | 36.4% | 90 | 98 | 91.8% | 34 | 189 | 223 | 108 | 32 | 16 | 46 | 76 | 740 |
| 15 | 2007-08 | SAS | 35 | 82 | 61 | 2,204 | 315 | 761 | 41.4% | 132 | 357 | 37.0% | 64 | 80 | 80.0% | 27 | 227 | 254 | 114 | 29 | 10 | 56 | 93 | 826 |
| 16 | 2008-09 | SAS | 36 | 81 | 77 | 2,336 | 301 | 689 | 43.7% | 131 | 319 | 41.1% | 51 | 62 | 82.3% | 26 | 244 | 270 | 114 | 37 | 17 | 61 | 82 | 784 |
| 17 | 2009-10 | SAS | 37 | 25 | 6 | 395 | 37 | 97 | 38.1% | 13 | 41 | 31.7% | 6 | 9 | 66.7% | 5 | 33 | 38 | 19 | 6 | 4 | 13 | 12 | 93 |
| 18 | 2009-10 | BOS | 37 | 21 | 1 | 314 | 44 | 87 | 50.6% | 19 | 41 | 46.3% | 2 | 6 | 33.3% | 1 | 32 | 33 | 24 | 4 | 2 | 8 | 21 | 109 |
| 19 | 2009-10 | TOT | 37 | 46 | 7 | 709 | 81 | 184 | 44.0% | 32 | 82 | 39.0% | 8 | 15 | 53.3% | 6 | 65 | 71 | 43 | 10 | 6 | 21 | 33 | 202 |
Max Min
NBA Alltime Leaders
Games Played
Robert Parish: 1,611Kareem Abdul-Jabbar: 1,560
Vince Carter: 1,541
Dirk Nowitzki: 1,522
John Stockton: 1,504
Points
LeBron James: 40,474Kareem Abdul-Jabbar: 38,387
Karl Malone: 36,928
Kobe Bryant: 33,643
Michael Jordan: 32,292
Steals
John Stockton: 3,265Jason Kidd: 2,684
Chris Paul: 2,614
Michael Jordan: 2,514
Gary Payton: 2,445
Free Throws Made
Karl Malone: 9,787Moses Malone: 8,531
LeBron James: 8,390
Kobe Bryant: 8,378
Oscar Robertson: 7,694