Matt Barnes Stats: NBA Career

Welcome to the profile page of Matt Barnes, a well-traveled and highly skilled NBA player who has left his mark on multiple teams and cities throughout his career.
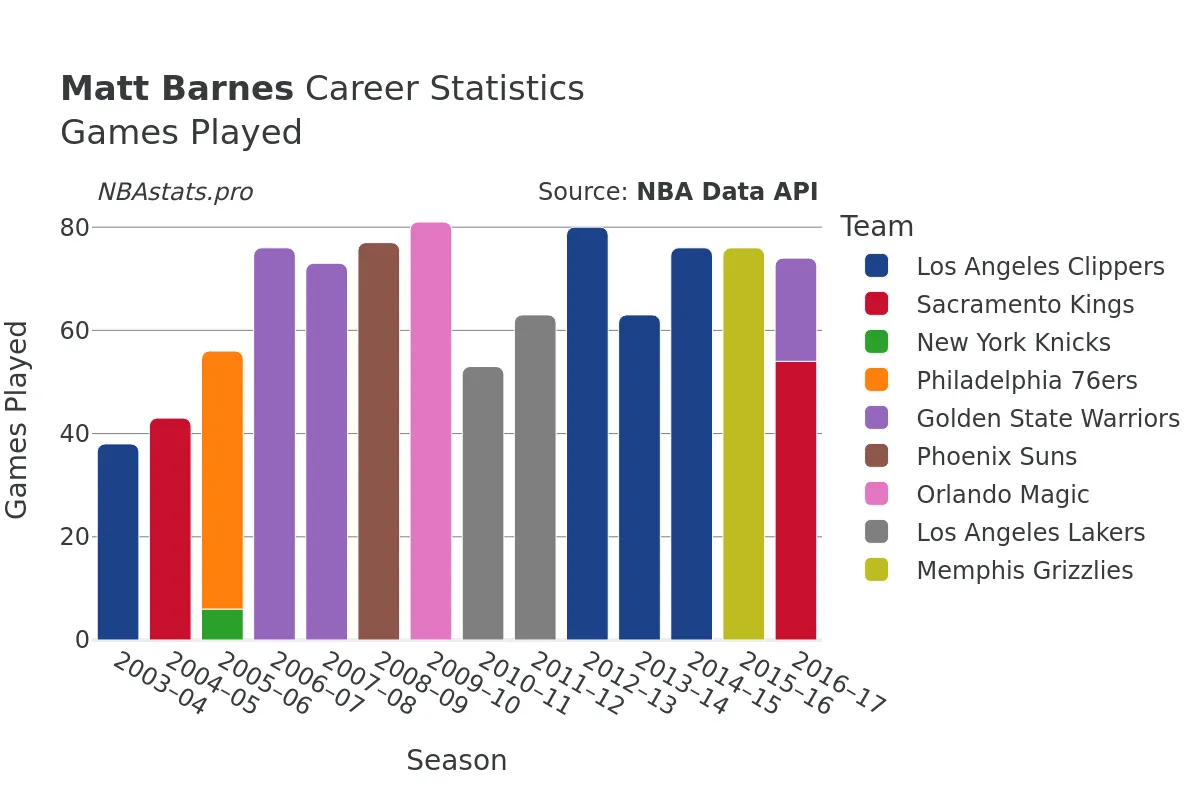
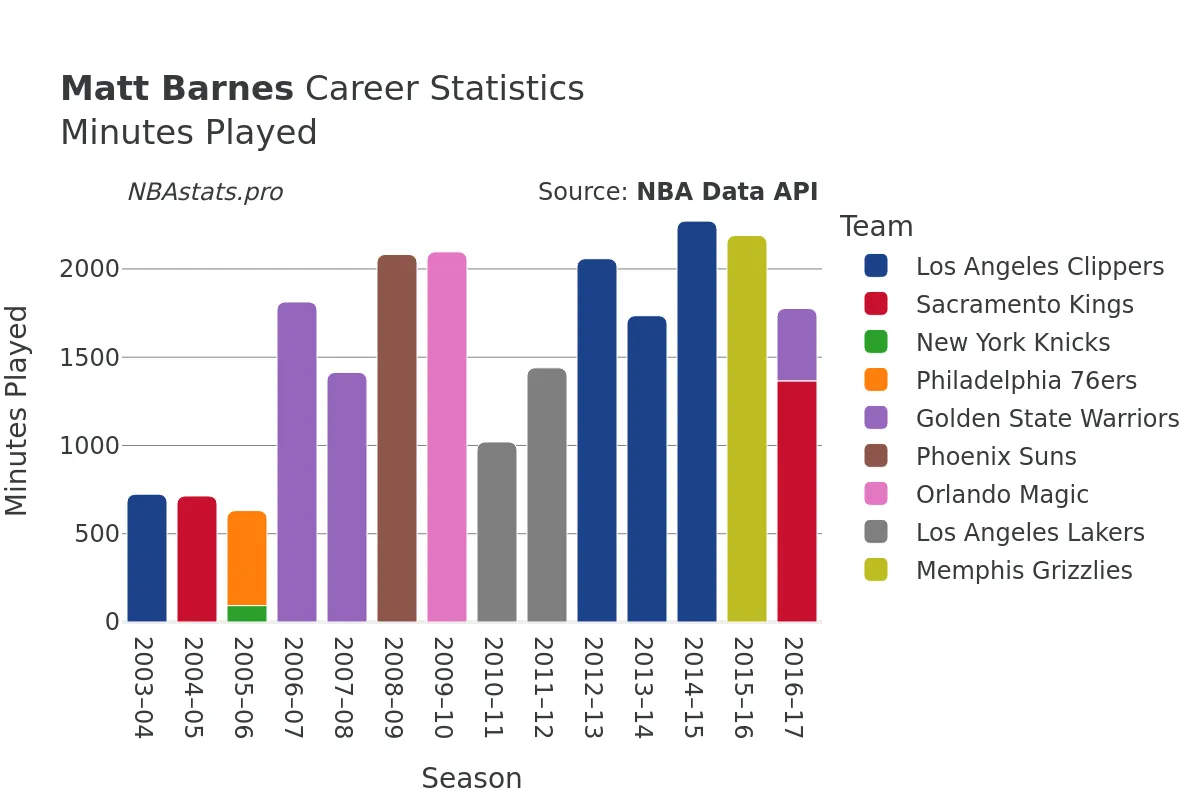
During his impressive 14 seasons in the NBA, Barnes played for a total of 9 teams, showcasing his versatility and adaptability on the court. He began his professional basketball journey in the 2003-04 season and concluded it in the 2016-17 season, having played a total of 1059 games and accumulated 24372 minutes of playing time.
K...nown for his tenacity and defensive prowess, Barnes was a force to be reckoned with on the court. Over the span of his career, he attempted a total of 7001 field goals, with 3043 of them finding the bottom of the net, resulting in a field goal percentage of 43.47%. Additionally, Barnes demonstrated his ability to knock down shots from the free-throw line, making 1133 out of 1520 attempts for an impressive free throw percentage.
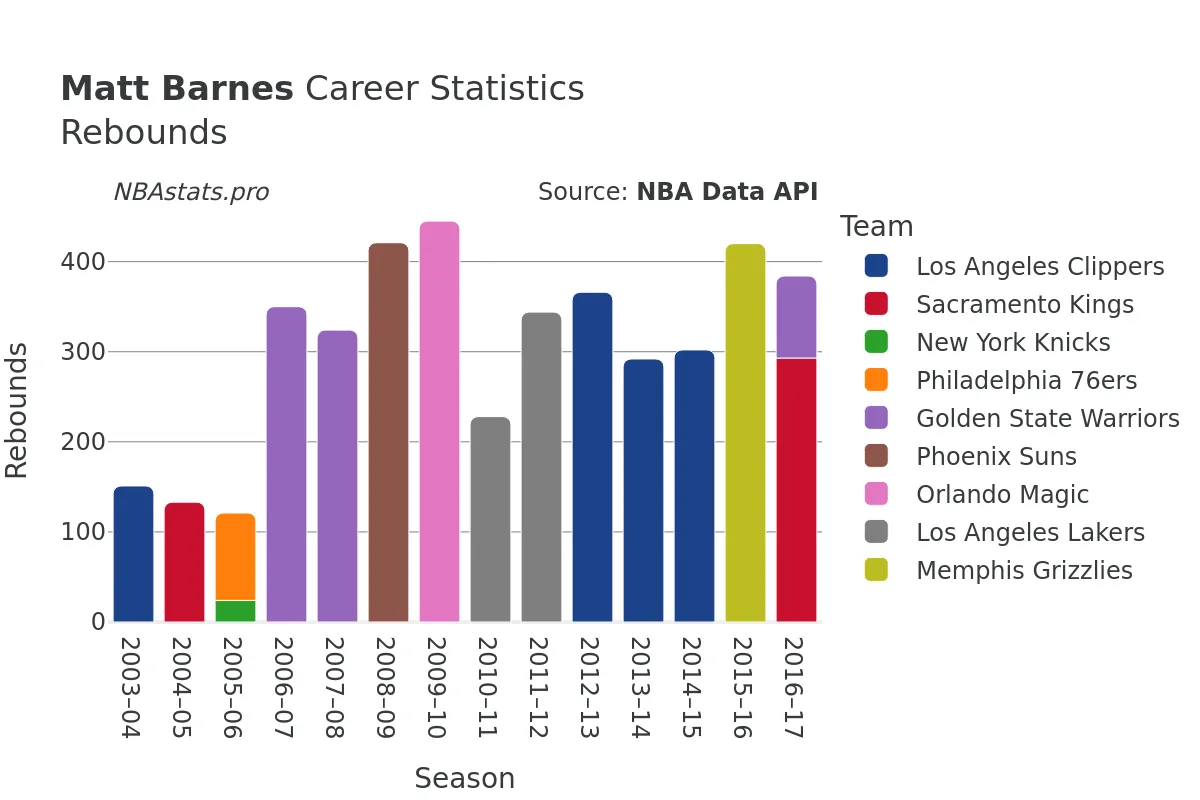
Rebounding was another area where Barnes excelled, pulling down a total of 4786 rebounds throughout his career. His prowess on the boards was evident in his ability to grab 3602 defensive rebounds and 1184 offensive rebounds, showcasing his willingness to do the dirty work on both ends of the court.
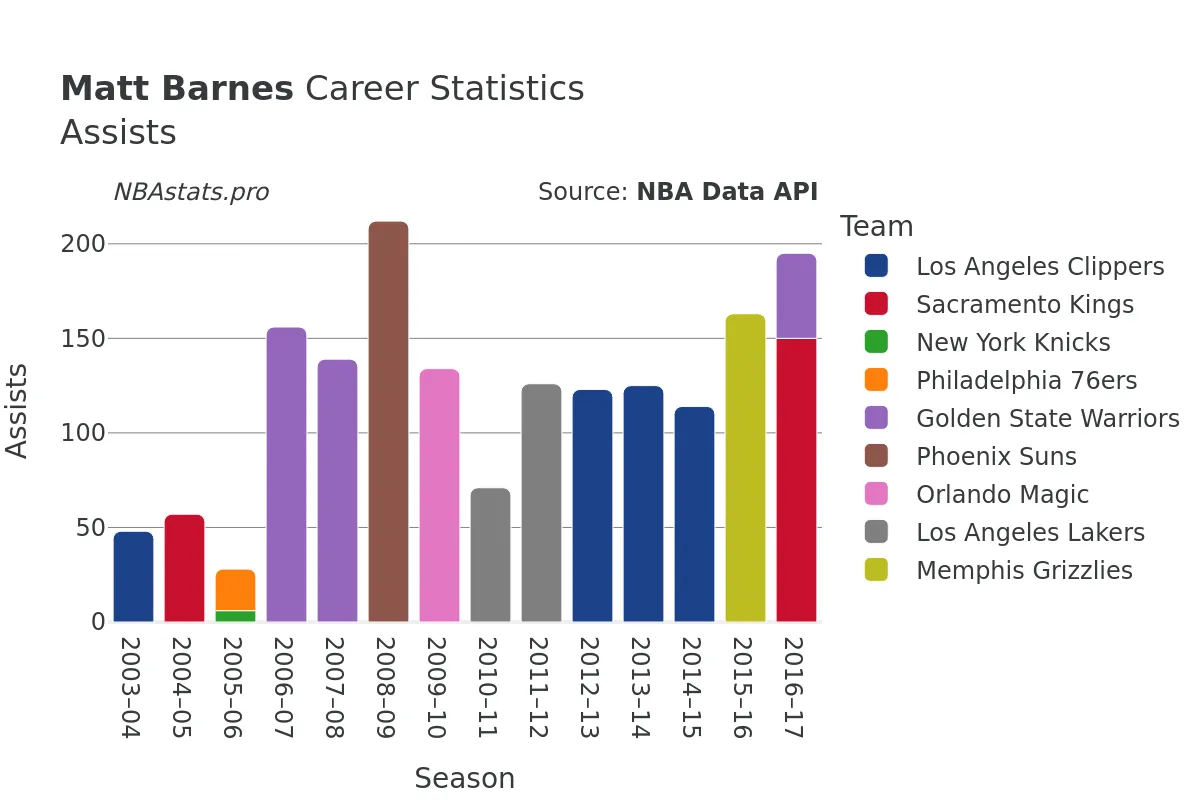
In addition to his scoring and rebounding abilities, Barnes was also a proficient playmaker, amassing 1914 assists over the course of his career. His court vision and passing skills made him a valuable asset to any team he suited up for.
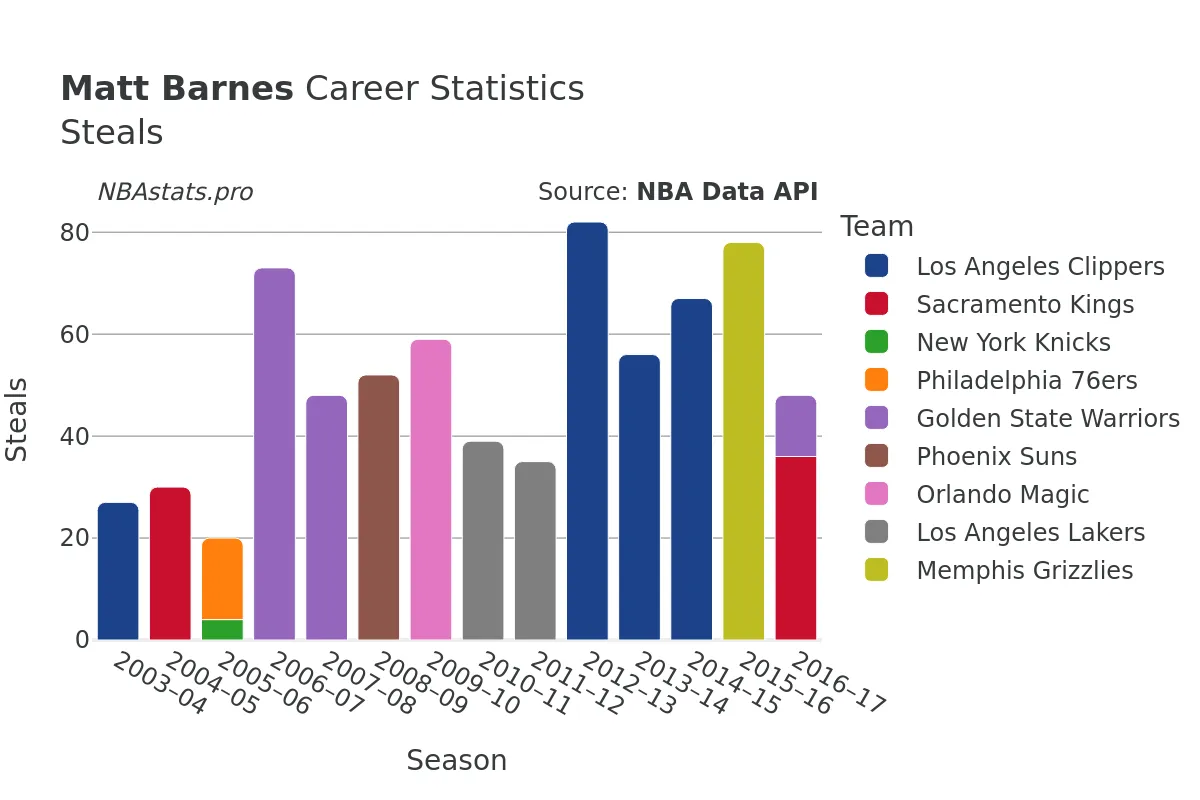
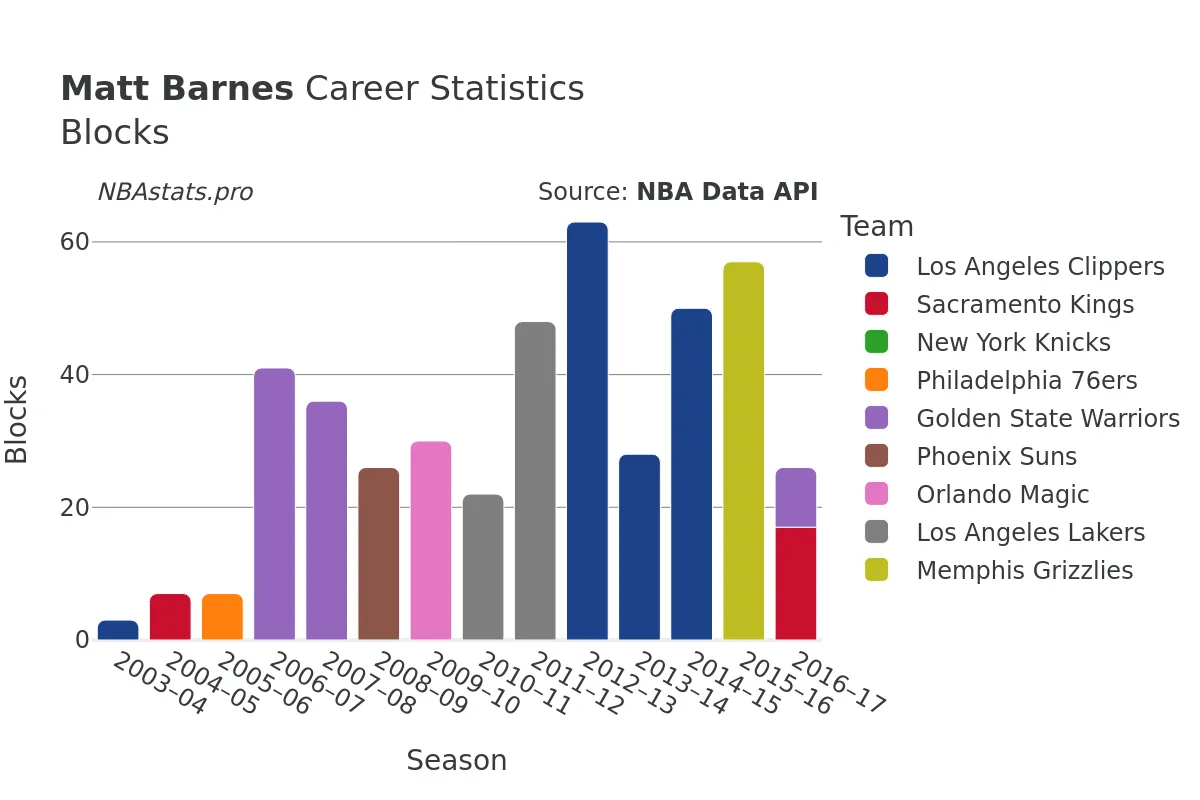
Defensively, Barnes was a menace to opposing players, racking up an impressive 782 steals and 477 blocks. His defensive instincts, combined with his physicality and basketball IQ, allowed him to disrupt plays and create turnovers, proving to be a disruptive force on the defensive end.
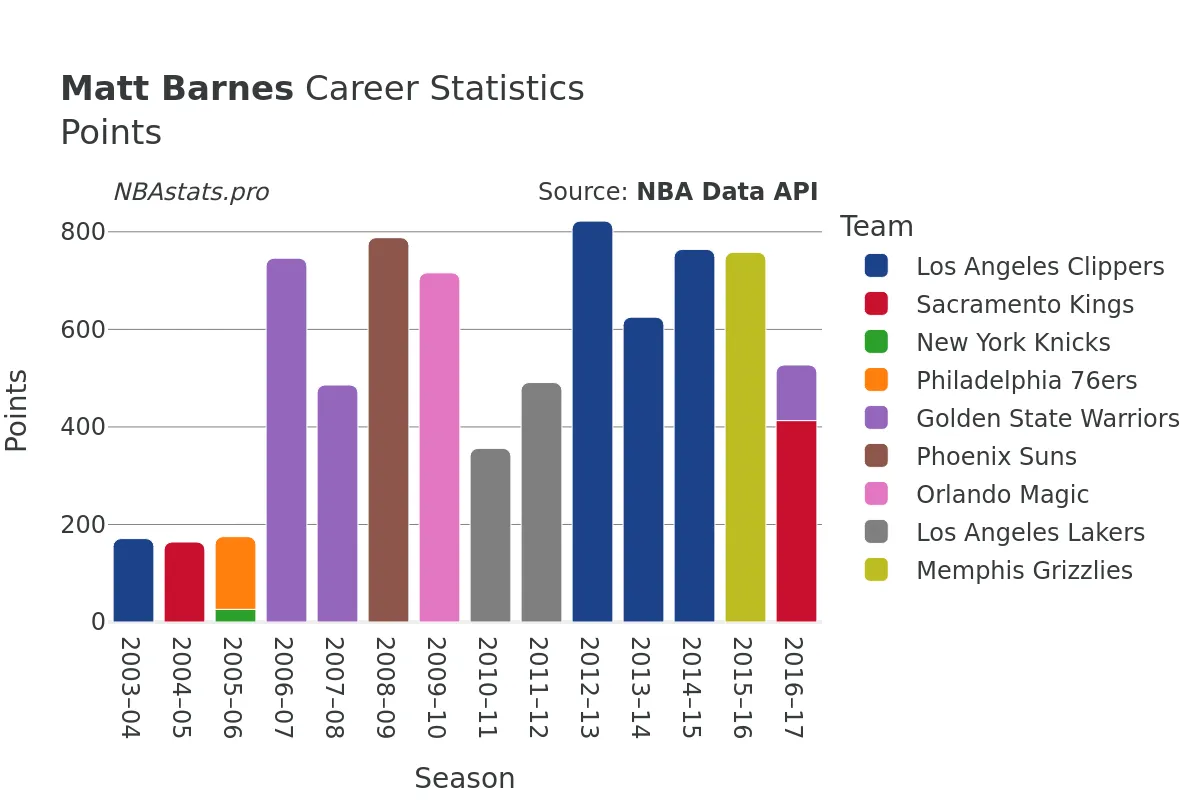
With a career total of 8291 points, Barnes made his presence known on the offensive end, contributing both as a scorer and facilitator for his teams. His ability to impact the game in multiple facets made him a valuable contributor and a fan favorite wherever he played.
Throughout his career, Barnes left a lasting impression on the cities and teams he represented. From Los Angeles to Sacramento, New York to Memphis, Barnes brought his fierce competitiveness and unwavering passion for the game to every stop along his journey. His grit, determination, and work ethic endeared him to fans and teammates alike, solidifying his legacy as a respected and admired player in the NBA.
As you delve into the charts and statistics on this page, you'll gain a deeper understanding of the impact that Matt Barnes had on the game of basketball. From his scoring prowess to his defensive tenacity, Barnes's career is a testament to hard work, perseverance, and a relentless pursuit of excellence on the court. Whether you're a fan of Barnes or simply appreciate the artistry of the game, exploring his career statistics will provide insight into the skill and dedication that define one of the NBA's most versatile players.
Read more
Games Played
Points
Assists
Rebounds
Steals
Minutes Played
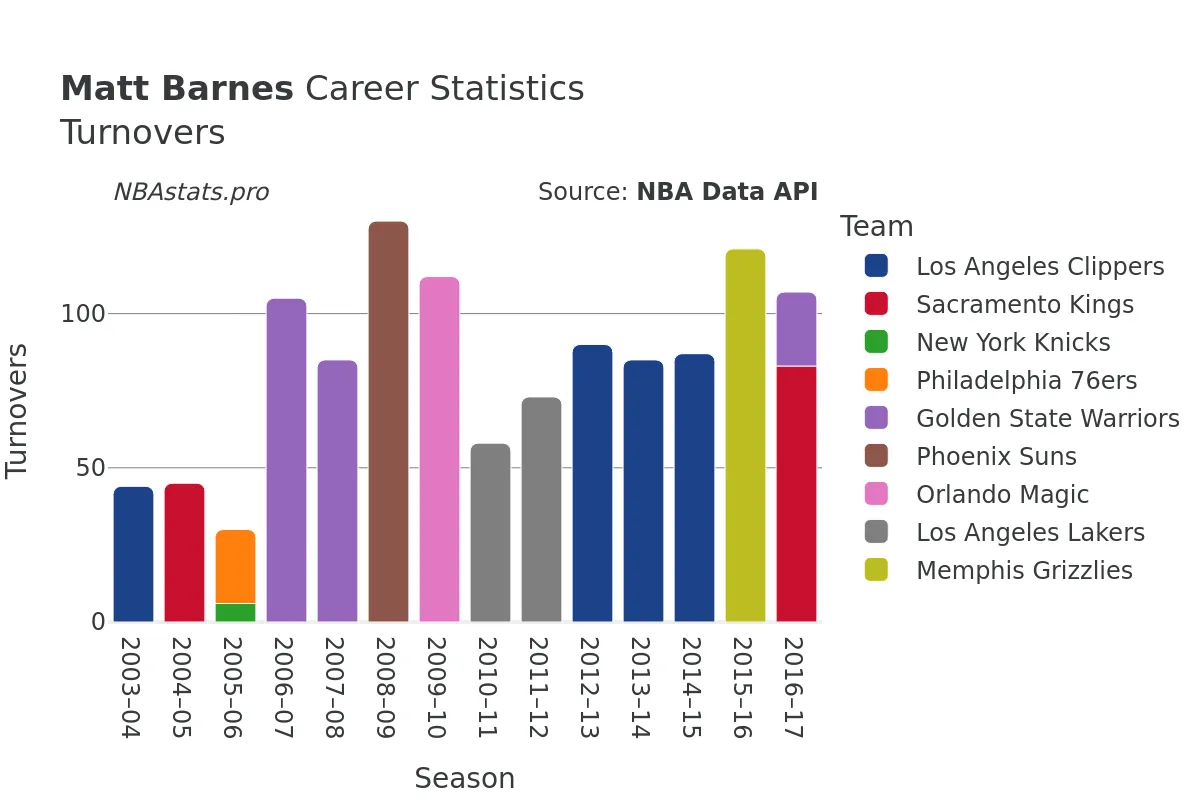
Turnovers
Blocks
Matt Barnes Career Stats Table
| SEASON | TEAM | AGE | GP | GS | MIN | FGM | FGA | FG % | FG3M | FG3A | FG3 % | FTM | FTA | FT % | OREB | DREB | REB | AST | STL | BLK | TOV | PF | PTS | |
|---|---|---|---|---|---|---|---|---|---|---|---|---|---|---|---|---|---|---|---|---|---|---|---|---|
| 1 | 2003-04 | LAC | 24 | 38 | 9 | 724 | 63 | 138 | 45.7% | 2 | 13 | 15.4% | 43 | 61 | 70.5% | 53 | 98 | 151 | 48 | 27 | 3 | 44 | 76 | 171 |
| 2 | 2004-05 | SAC | 25 | 43 | 9 | 714 | 62 | 151 | 41.1% | 5 | 22 | 22.7% | 35 | 58 | 60.3% | 49 | 84 | 133 | 57 | 30 | 7 | 45 | 80 | 164 |
| 3 | 2005-06 | NYK | 26 | 6 | 5 | 93 | 11 | 30 | 36.7% | 1 | 4 | 25.0% | 3 | 4 | 75.0% | 7 | 17 | 24 | 6 | 4 | 0 | 6 | 8 | 26 |
| 4 | 2005-06 | PHI | 26 | 50 | 0 | 538 | 59 | 110 | 53.6% | 2 | 11 | 18.2% | 29 | 43 | 67.4% | 41 | 56 | 97 | 22 | 16 | 7 | 24 | 92 | 149 |
| 5 | 2005-06 | TOT | 26 | 56 | 5 | 631 | 70 | 140 | 50.0% | 3 | 15 | 20.0% | 32 | 47 | 68.1% | 48 | 73 | 121 | 28 | 20 | 7 | 30 | 100 | 175 |
| 6 | 2006-07 | GSW | 27 | 76 | 23 | 1,813 | 275 | 628 | 43.8% | 106 | 290 | 36.6% | 90 | 123 | 73.2% | 91 | 259 | 350 | 156 | 73 | 41 | 105 | 188 | 746 |
| 7 | 2007-08 | GSW | 28 | 73 | 18 | 1,414 | 187 | 442 | 42.3% | 53 | 181 | 29.3% | 59 | 79 | 74.7% | 94 | 230 | 324 | 139 | 48 | 36 | 85 | 159 | 486 |
| 8 | 2008-09 | PHX | 29 | 77 | 40 | 2,082 | 285 | 674 | 42.3% | 117 | 341 | 34.3% | 101 | 136 | 74.3% | 79 | 342 | 421 | 212 | 52 | 26 | 130 | 209 | 788 |
| 9 | 2009-10 | ORL | 30 | 81 | 58 | 2,097 | 271 | 557 | 48.7% | 66 | 207 | 31.9% | 108 | 146 | 74.0% | 106 | 339 | 445 | 134 | 59 | 30 | 112 | 185 | 716 |
| 10 | 2010-11 | LAL | 31 | 53 | 0 | 1,020 | 131 | 279 | 47.0% | 34 | 107 | 31.8% | 60 | 77 | 77.9% | 73 | 155 | 228 | 71 | 39 | 22 | 58 | 127 | 356 |
| 11 | 2011-12 | LAL | 32 | 63 | 16 | 1,440 | 175 | 387 | 45.2% | 46 | 138 | 33.3% | 95 | 128 | 74.2% | 97 | 247 | 344 | 126 | 35 | 48 | 73 | 152 | 491 |
| 12 | 2012-13 | LAC | 33 | 80 | 4 | 2,058 | 312 | 675 | 46.2% | 111 | 325 | 34.2% | 87 | 117 | 74.4% | 111 | 255 | 366 | 123 | 82 | 63 | 90 | 233 | 822 |
| 13 | 2013-14 | LAC | 34 | 63 | 40 | 1,735 | 231 | 527 | 43.8% | 97 | 283 | 34.3% | 66 | 90 | 73.3% | 60 | 232 | 292 | 125 | 56 | 28 | 85 | 185 | 625 |
| 14 | 2014-15 | LAC | 35 | 76 | 74 | 2,271 | 277 | 624 | 44.4% | 136 | 376 | 36.2% | 74 | 95 | 77.9% | 51 | 251 | 302 | 114 | 67 | 50 | 87 | 240 | 764 |
| 15 | 2015-16 | MEM | 36 | 76 | 45 | 2,190 | 264 | 693 | 38.1% | 119 | 370 | 32.2% | 111 | 138 | 80.4% | 84 | 336 | 420 | 163 | 78 | 57 | 121 | 234 | 758 |
| 16 | 2016-17 | SAC | 37 | 54 | 13 | 1,366 | 147 | 383 | 38.4% | 69 | 211 | 32.7% | 50 | 66 | 75.8% | 55 | 238 | 293 | 150 | 36 | 17 | 83 | 138 | 413 |
| 17 | 2016-17 | GSW | 37 | 20 | 5 | 410 | 38 | 90 | 42.2% | 18 | 52 | 34.6% | 20 | 23 | 87.0% | 15 | 76 | 91 | 45 | 12 | 9 | 24 | 47 | 114 |
| 18 | 2016-17 | TOT | 37 | 74 | 18 | 1,776 | 185 | 473 | 39.1% | 87 | 263 | 33.1% | 70 | 89 | 78.7% | 70 | 314 | 384 | 195 | 48 | 26 | 107 | 185 | 527 |
Max Min
NBA Alltime Leaders
Games Played
Robert Parish: 1,611Kareem Abdul-Jabbar: 1,560
Vince Carter: 1,541
Dirk Nowitzki: 1,522
John Stockton: 1,504
Points
LeBron James: 40,474Kareem Abdul-Jabbar: 38,387
Karl Malone: 36,928
Kobe Bryant: 33,643
Michael Jordan: 32,292
Steals
John Stockton: 3,265Jason Kidd: 2,684
Chris Paul: 2,614
Michael Jordan: 2,514
Gary Payton: 2,445
Free Throws Made
Karl Malone: 9,787Moses Malone: 8,531
LeBron James: 8,390
Kobe Bryant: 8,378
Oscar Robertson: 7,694