Marcus Thornton Stats: NBA Career

Marcus Thornton, a former NBA player, had an impressive career spanning from the 2009-10 season to the 2016-17 season. During his time in the league, Thornton played for various teams including the New Orleans Pelicans, Sacramento Kings, Brooklyn Nets, Boston Celtics, Phoenix Suns, Houston Rockets, and Washington Wizards. His journey in the NBA took him to cities across the United States, from the vibrant streets of New Orleans, Louisiana to the bustling metropolis of Sacramento, California, and... all the way to the political hub of Washington, D.C.
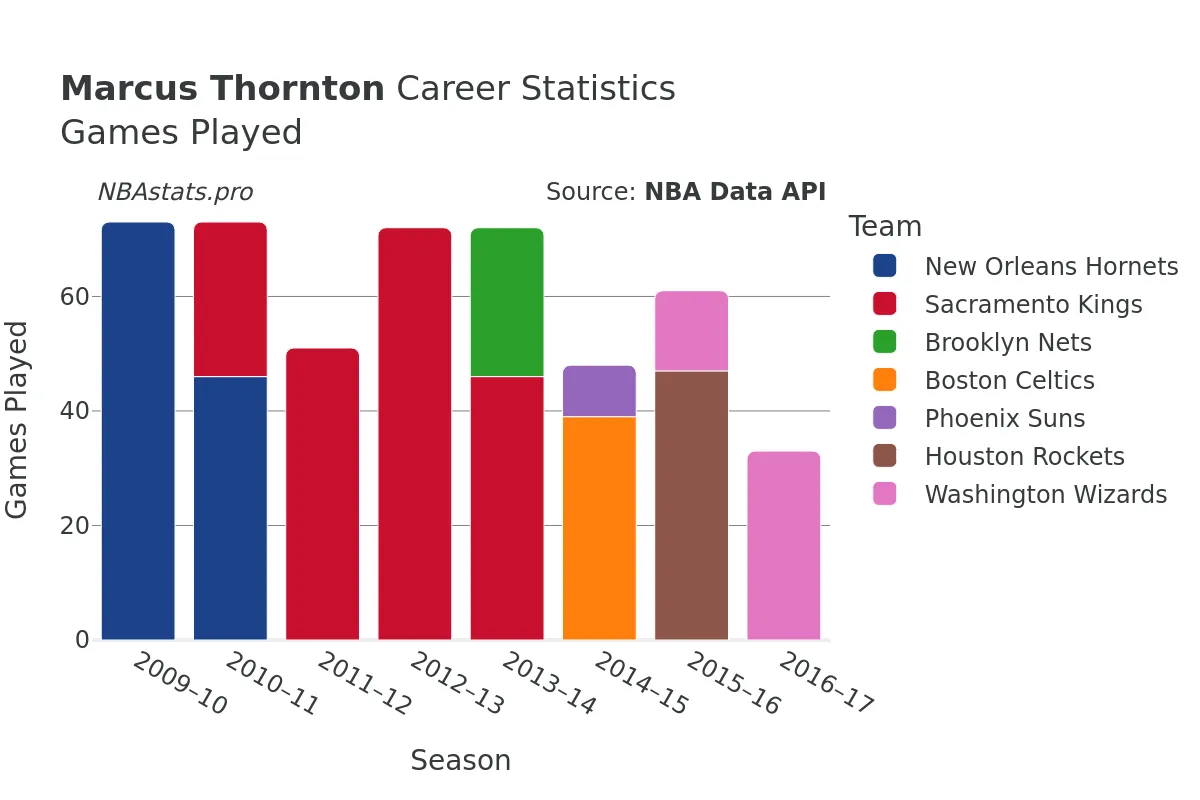
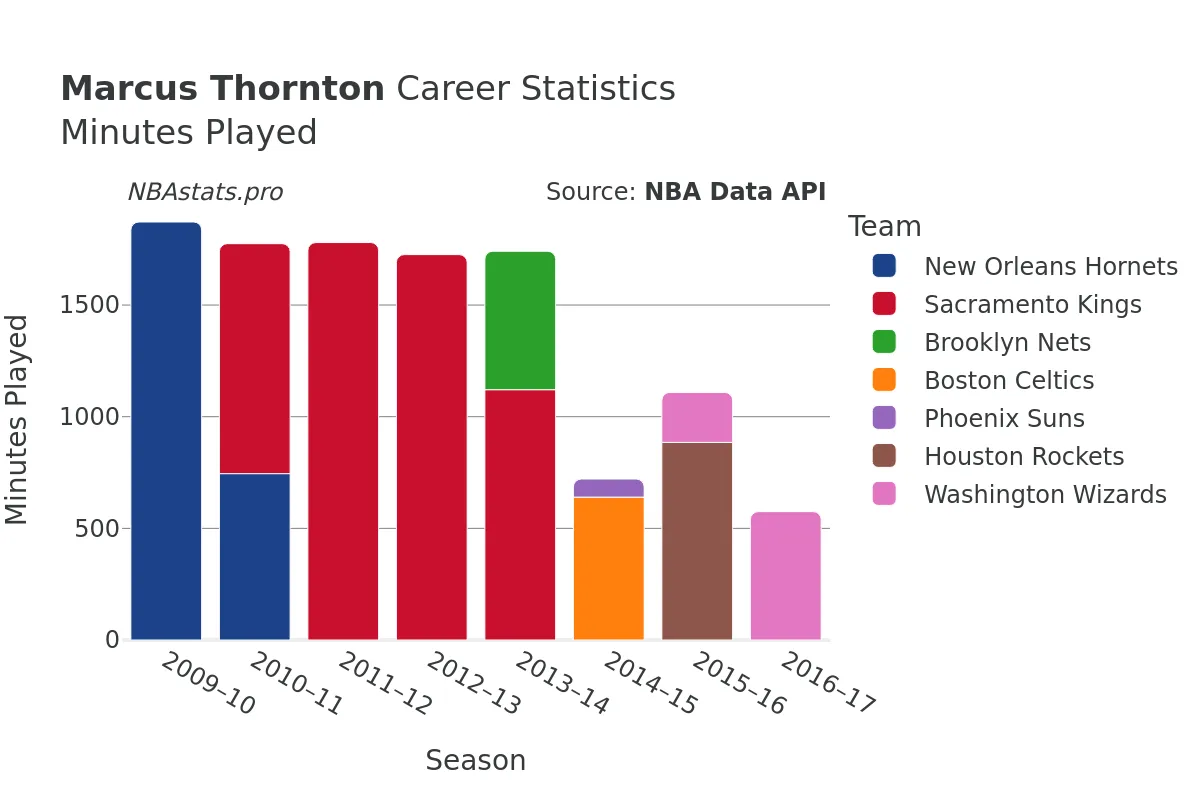
Starting his professional basketball career at the age of 23, Marcus Thornton quickly made a name for himself as a sharpshooter and reliable scorer. Over the course of 737 games played, Thornton accumulated an impressive total of 16,645 minutes on the court. His offensive prowess was evident through his 3,082 field goals made on 7,336 attempts, boasting a respectable field goal percentage of 42.01%.
From beyond the arc, Thornton was known for his shooting prowess and ability to stretch the floor. His knack for sinking shots from long range made him a valuable asset to any team's offensive strategy. Additionally, his free throw shooting was consistent and reliable, evident in his 1,115 successful free throws out of 1,355 attempts.
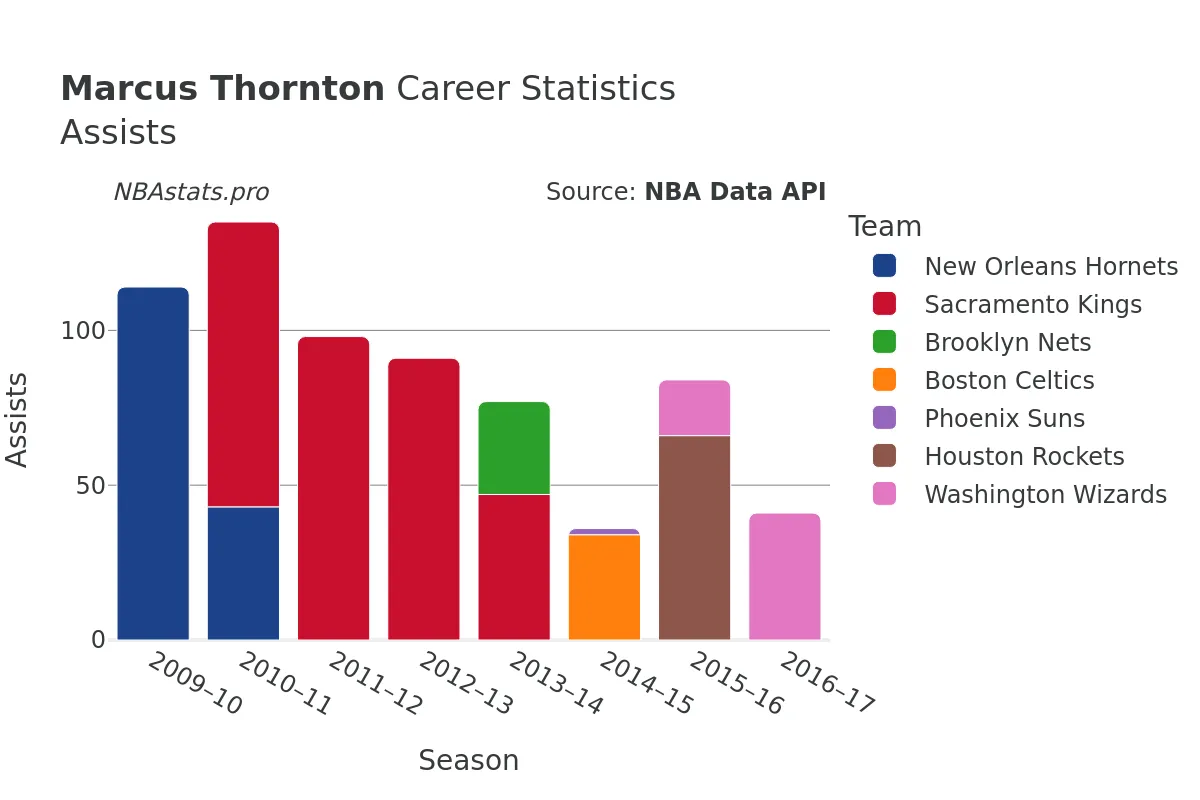
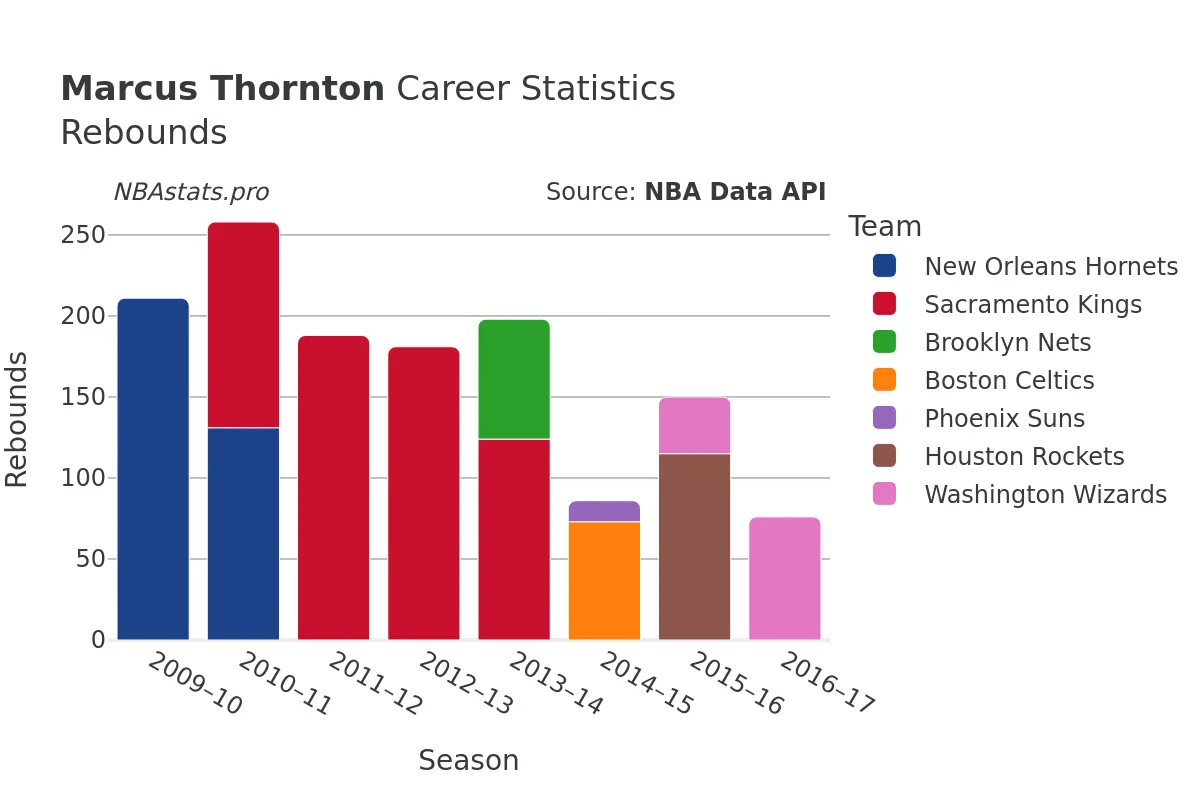
Beyond scoring, Thornton showcased his versatility on the court with his rebounding, playmaking, and defensive skills. A total of 2,040 rebounds, with 1,454 coming on the defensive end and 586 on the offensive end, highlighted his tenacity under the boards. In terms of playmaking, Thornton dished out 1,008 assists over his career, showcasing his ability to create scoring opportunities for his teammates.
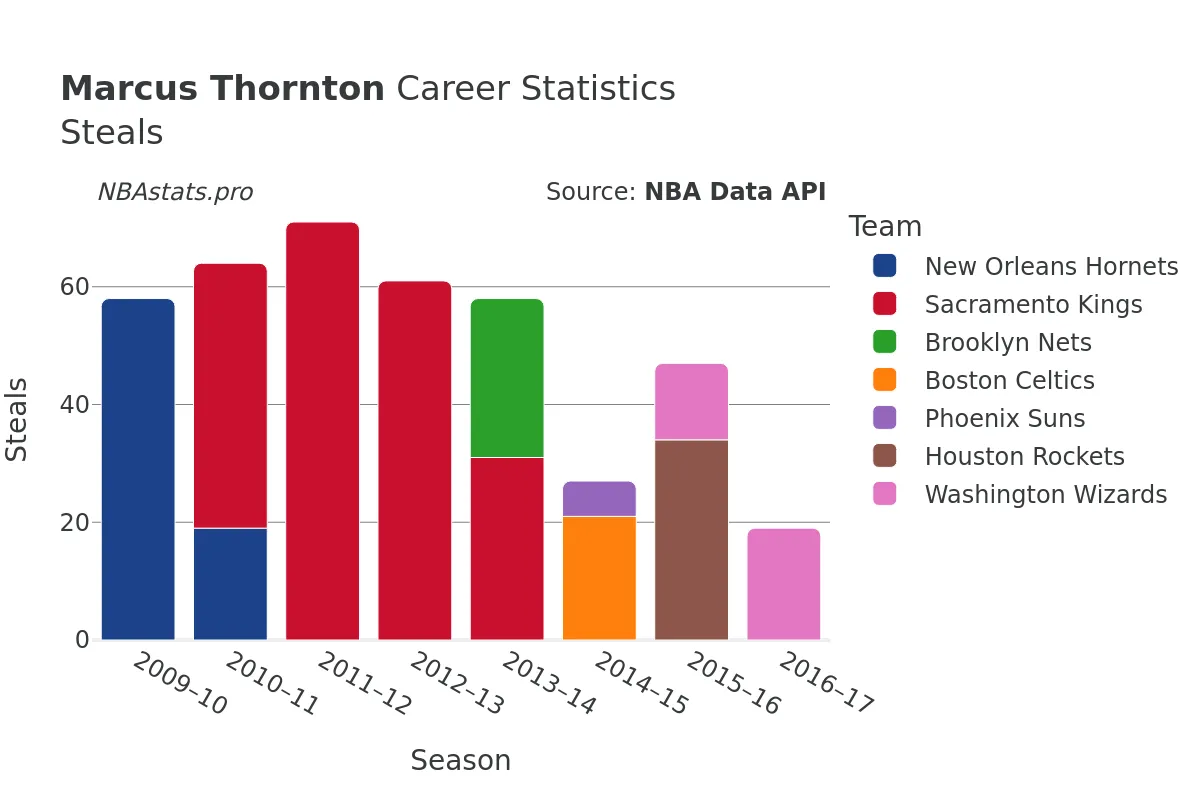
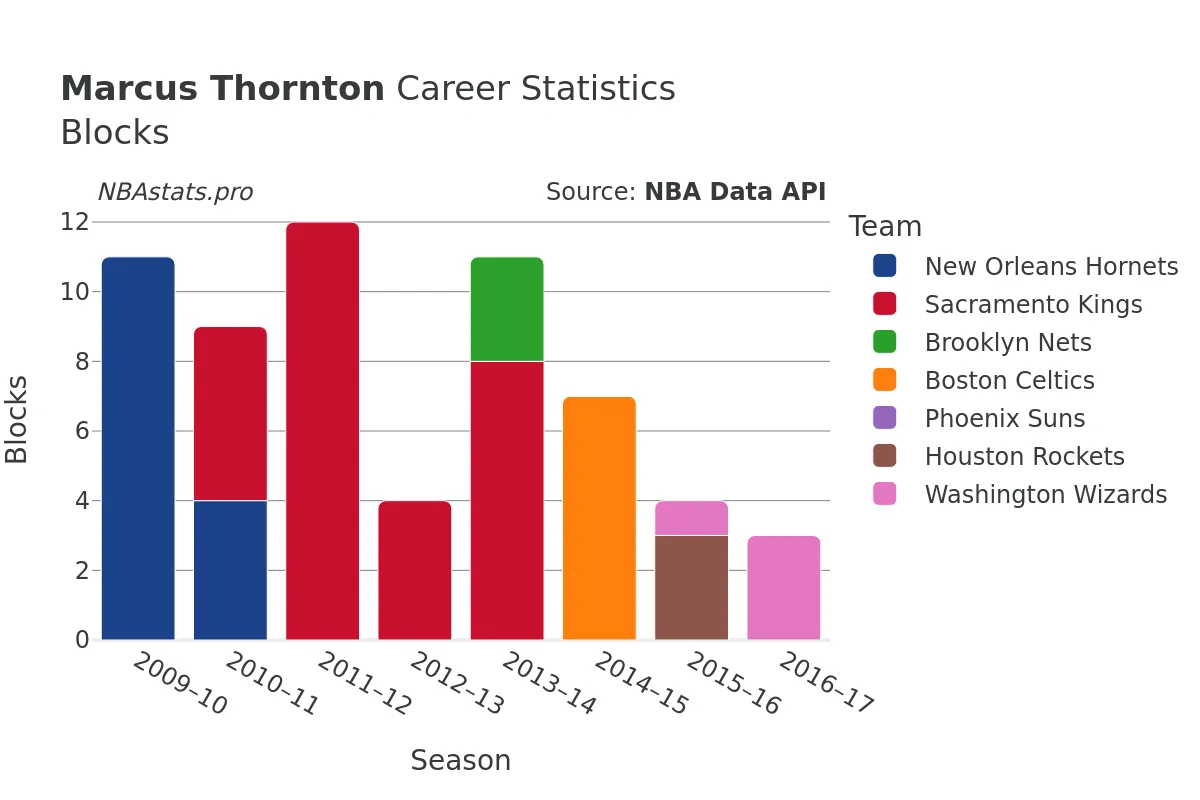
Defensively, Thornton was a threat, tallying 601 steals and 92 blocks throughout his time in the NBA. His quick hands and defensive instincts made him a formidable opponent on the court, capable of disrupting the opposition's offensive flow and generating turnovers.
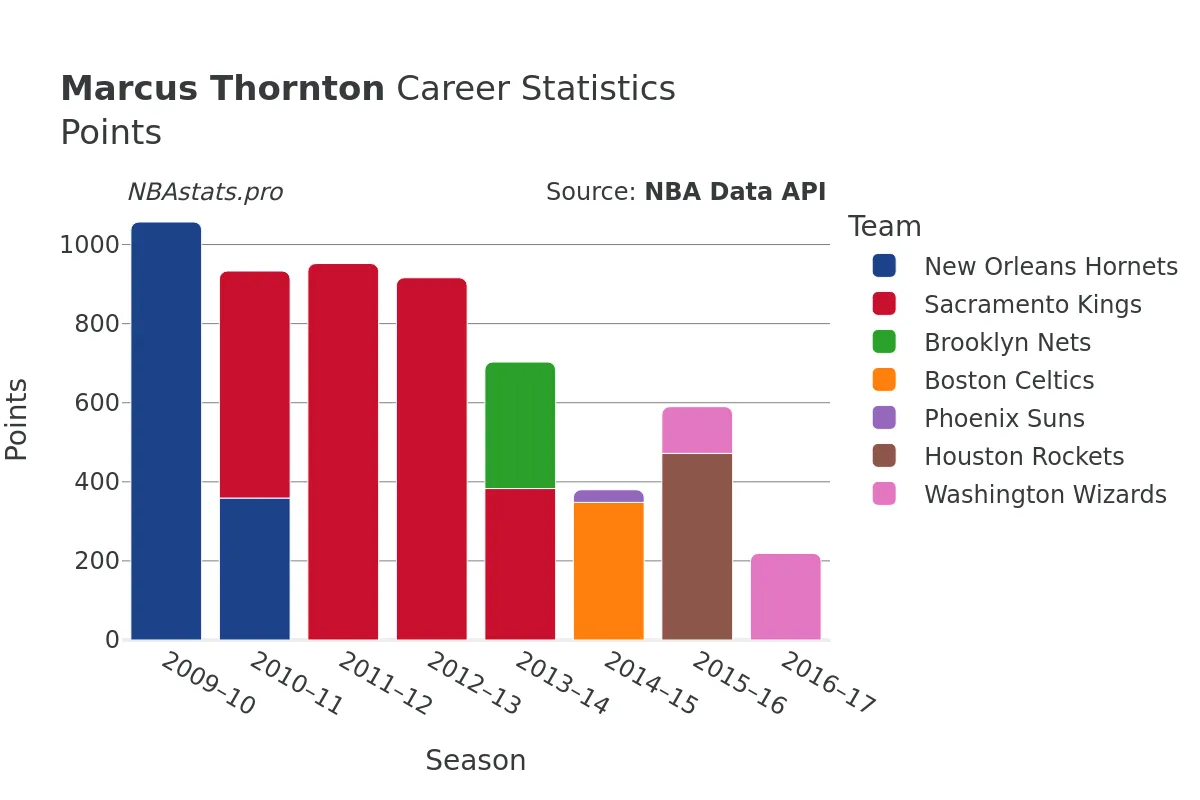
With a total of 8,356 points scored in his NBA career, Marcus Thornton left a lasting impact with his scoring prowess and all-around contributions to the game. Though he may no longer be active in the league, his legacy as a skilled and dedicated player continues to resonate with basketball fans and enthusiasts.
To delve deeper into Marcus Thornton's statistical breakdown and career trajectory, take a closer look at the charts and data provided on this profile page. Explore his journey through different teams, cities, and states, and gain a better understanding of the impact he made during his time in the NBA.
Read more
Games Played
Points
Assists
Rebounds
Steals
Minutes Played
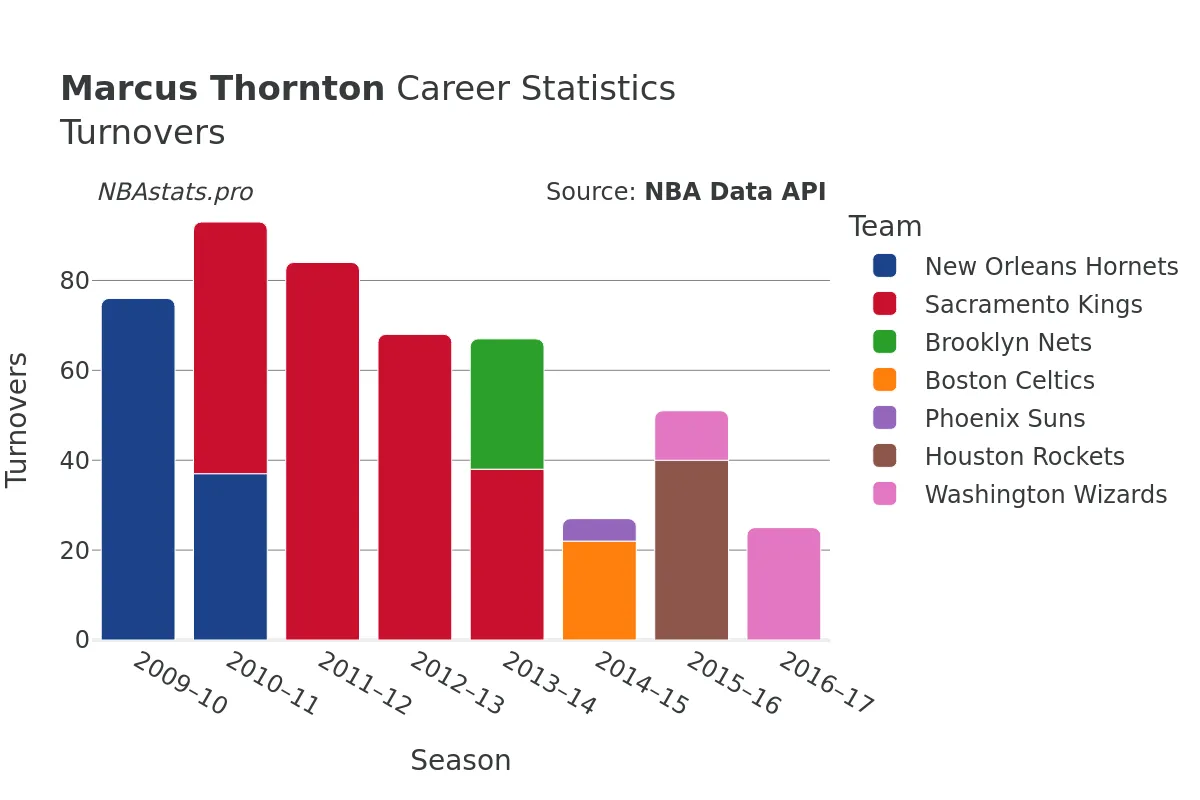
Turnovers
Blocks
Marcus Thornton Career Stats Table
| SEASON | TEAM | AGE | GP | GS | MIN | FGM | FGA | FG % | FG3M | FG3A | FG3 % | FTM | FTA | FT % | OREB | DREB | REB | AST | STL | BLK | TOV | PF | PTS | |
|---|---|---|---|---|---|---|---|---|---|---|---|---|---|---|---|---|---|---|---|---|---|---|---|---|
| 1 | 2009-10 | NOH | 23 | 73 | 17 | 1,872 | 398 | 883 | 45.1% | 117 | 313 | 37.4% | 144 | 177 | 81.4% | 72 | 139 | 211 | 114 | 58 | 11 | 76 | 127 | 1,057 |
| 2 | 2010-11 | NOH | 24 | 46 | 0 | 745 | 137 | 334 | 41.0% | 35 | 93 | 37.6% | 50 | 66 | 75.8% | 25 | 106 | 131 | 43 | 19 | 4 | 37 | 50 | 359 |
| 3 | 2010-11 | SAC | 24 | 27 | 23 | 1,030 | 213 | 473 | 45.0% | 53 | 147 | 36.1% | 95 | 118 | 80.5% | 36 | 91 | 127 | 92 | 45 | 5 | 56 | 60 | 574 |
| 4 | 2010-11 | TOT | 24 | 73 | 23 | 1,776 | 350 | 807 | 43.4% | 88 | 240 | 36.7% | 145 | 184 | 78.8% | 61 | 197 | 258 | 135 | 64 | 9 | 93 | 110 | 933 |
| 5 | 2011-12 | SAC | 25 | 51 | 51 | 1,780 | 352 | 803 | 43.8% | 107 | 310 | 34.5% | 141 | 163 | 86.5% | 84 | 104 | 188 | 98 | 71 | 12 | 84 | 111 | 952 |
| 6 | 2012-13 | SAC | 26 | 72 | 8 | 1,726 | 332 | 774 | 42.9% | 141 | 379 | 37.2% | 111 | 126 | 88.1% | 50 | 131 | 181 | 91 | 61 | 4 | 68 | 105 | 916 |
| 7 | 2013-14 | SAC | 27 | 46 | 26 | 1,121 | 142 | 373 | 38.1% | 57 | 179 | 31.8% | 42 | 52 | 80.8% | 39 | 85 | 124 | 47 | 31 | 8 | 38 | 74 | 383 |
| 8 | 2013-14 | BKN | 27 | 26 | 1 | 620 | 110 | 266 | 41.4% | 52 | 137 | 38.0% | 48 | 60 | 80.0% | 18 | 56 | 74 | 30 | 27 | 3 | 29 | 36 | 320 |
| 9 | 2013-14 | TOT | 27 | 72 | 27 | 1,741 | 252 | 639 | 39.4% | 109 | 316 | 34.5% | 90 | 112 | 80.4% | 57 | 141 | 198 | 77 | 58 | 11 | 67 | 110 | 703 |
| 10 | 2014-15 | BOS | 28 | 39 | 0 | 640 | 127 | 305 | 41.6% | 52 | 124 | 41.9% | 42 | 51 | 82.4% | 19 | 54 | 73 | 34 | 21 | 7 | 22 | 35 | 348 |
| 11 | 2014-15 | PHX | 28 | 9 | 0 | 81 | 13 | 40 | 32.5% | 2 | 19 | 10.5% | 4 | 5 | 80.0% | 4 | 9 | 13 | 2 | 6 | 0 | 5 | 3 | 32 |
| 12 | 2014-15 | TOT | 28 | 48 | 0 | 721 | 140 | 345 | 40.6% | 54 | 143 | 37.8% | 46 | 56 | 82.1% | 23 | 63 | 86 | 36 | 27 | 7 | 27 | 38 | 380 |
| 13 | 2015-16 | HOU | 29 | 47 | 6 | 885 | 174 | 435 | 40.0% | 73 | 216 | 33.8% | 51 | 58 | 87.9% | 31 | 84 | 115 | 66 | 34 | 3 | 40 | 73 | 472 |
| 14 | 2015-16 | WAS | 29 | 14 | 2 | 224 | 42 | 107 | 39.3% | 18 | 54 | 33.3% | 16 | 21 | 76.2% | 7 | 28 | 35 | 18 | 13 | 1 | 11 | 17 | 118 |
| 15 | 2015-16 | TOT | 29 | 61 | 8 | 1,108 | 216 | 542 | 39.9% | 91 | 270 | 33.7% | 67 | 79 | 84.8% | 38 | 112 | 150 | 84 | 47 | 4 | 51 | 90 | 590 |
| 16 | 2016-17 | WAS | 30 | 33 | 1 | 575 | 84 | 210 | 40.0% | 28 | 80 | 35.0% | 23 | 27 | 85.2% | 22 | 54 | 76 | 41 | 19 | 3 | 25 | 48 | 219 |
Max Min
NBA Alltime Leaders
Games Played
Robert Parish: 1,611Kareem Abdul-Jabbar: 1,560
Vince Carter: 1,541
Dirk Nowitzki: 1,522
John Stockton: 1,504
Points
LeBron James: 40,474Kareem Abdul-Jabbar: 38,387
Karl Malone: 36,928
Kobe Bryant: 33,643
Michael Jordan: 32,292
Steals
John Stockton: 3,265Jason Kidd: 2,684
Chris Paul: 2,614
Michael Jordan: 2,514
Gary Payton: 2,445
Free Throws Made
Karl Malone: 9,787Moses Malone: 8,531
LeBron James: 8,390
Kobe Bryant: 8,378
Oscar Robertson: 7,694