Marco Belinelli Stats: NBA Career

Inside the high-flying, fast-paced world of the NBA, basketball players come and go, leaving their mark with their skills, dedication, and passion for the game. One such player who has made waves in the basketball world is the talented shooting guard, Marco Belinelli.
During his career, Belinelli showcased his talents with various teams in the NBA, weaving through the courts of California, Ontario, Louisiana, Illinois, Texas, North Carolina, Georgia, and Pennsylvania. Belinelli's journey began... in the 2007-08 season when he took his first steps onto the NBA stage as a member of the Golden State Warriors. From there, Belinelli's career blossomed, leading him to play for prestigious teams like the Toronto Raptors, New Orleans Pelicans, Chicago Bulls, San Antonio Spurs, Sacramento Kings, Charlotte Hornets, Atlanta Hawks, and Philadelphia 76ers.
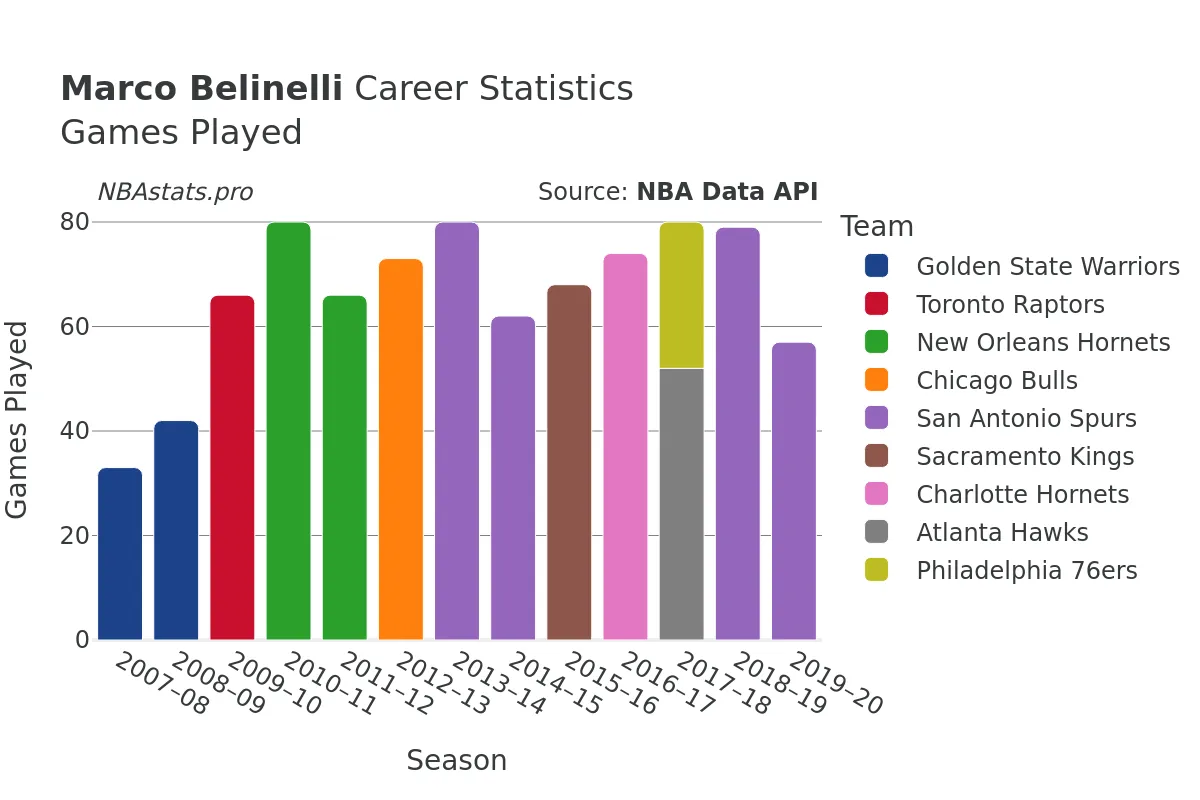
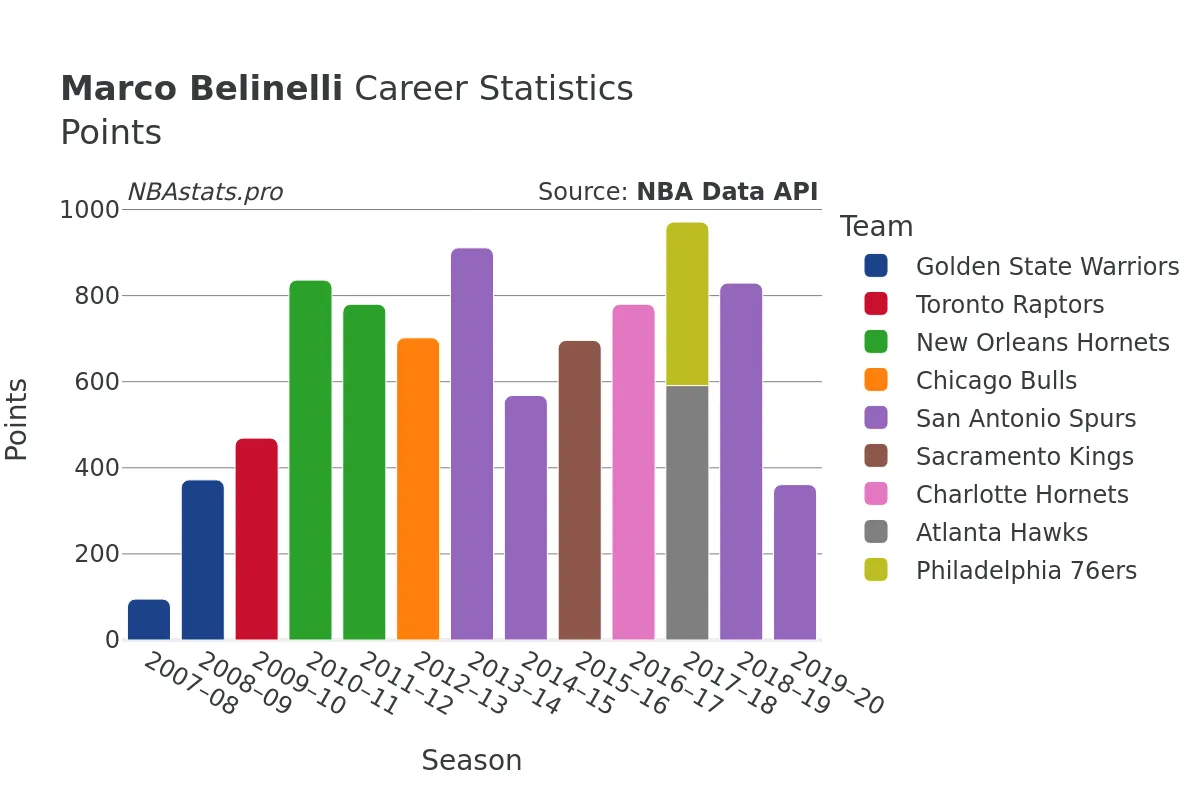
Throughout his time on the court, Belinelli proved to be a versatile player with a sharp eye for the basket. Over the span of 940 games, he accumulated an impressive total of 9341 points, showcasing his scoring prowess. His shooting skills were evident in his 3286 successful field goals out of 7723 attempted, resulting in a shooting percentage of approximately 42.5%. Additionally, Belinelli demonstrated his finesse at the free-throw line, with a stellar free throw percentage.
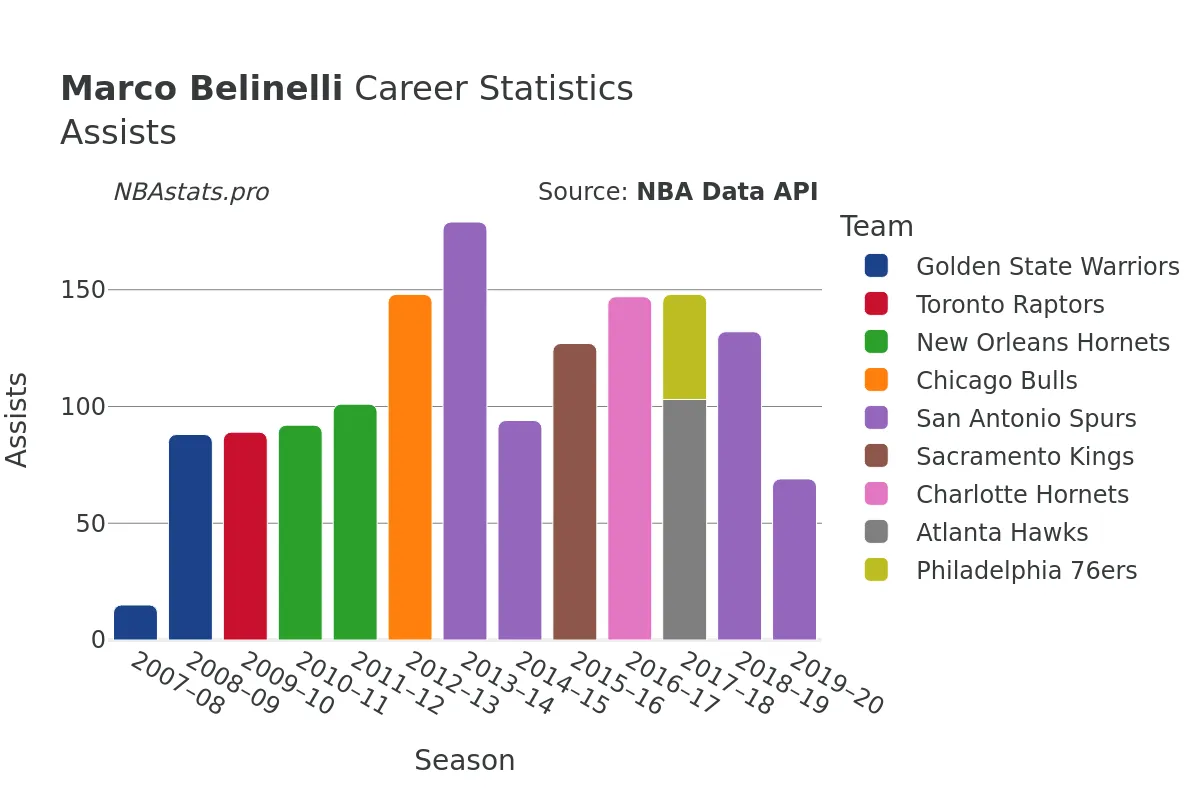
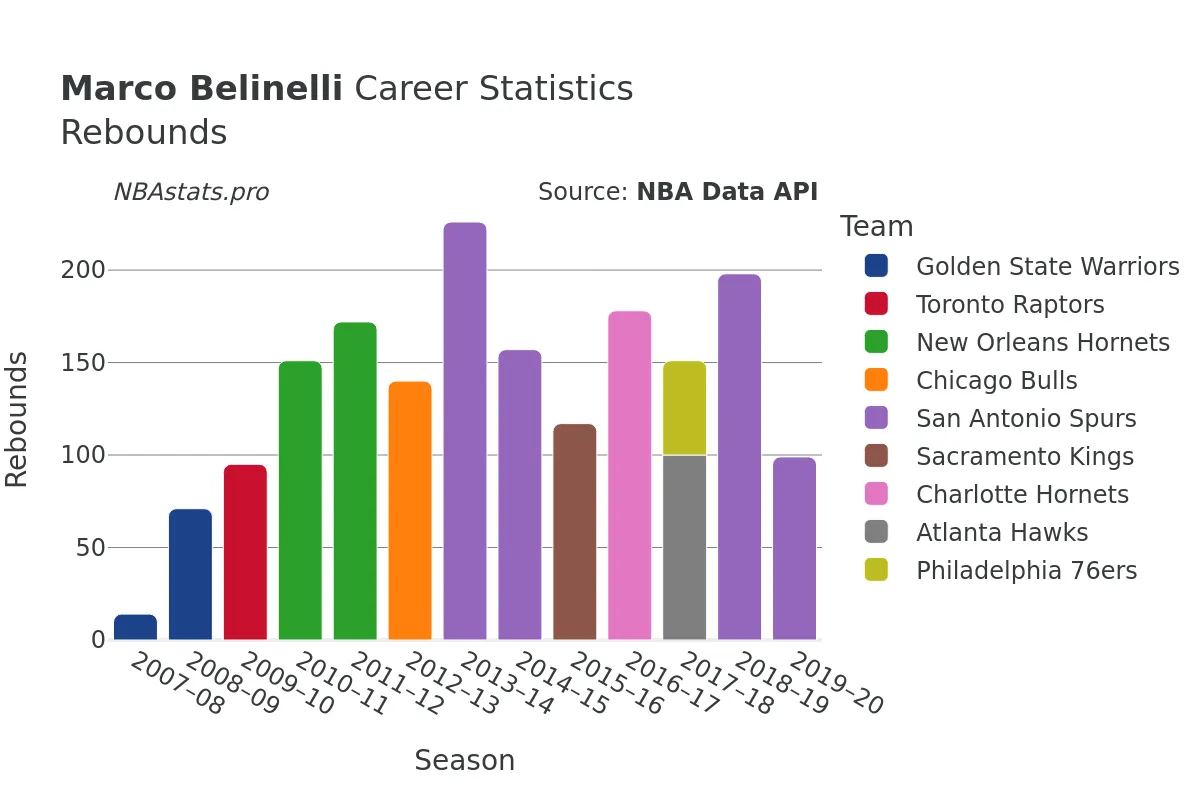
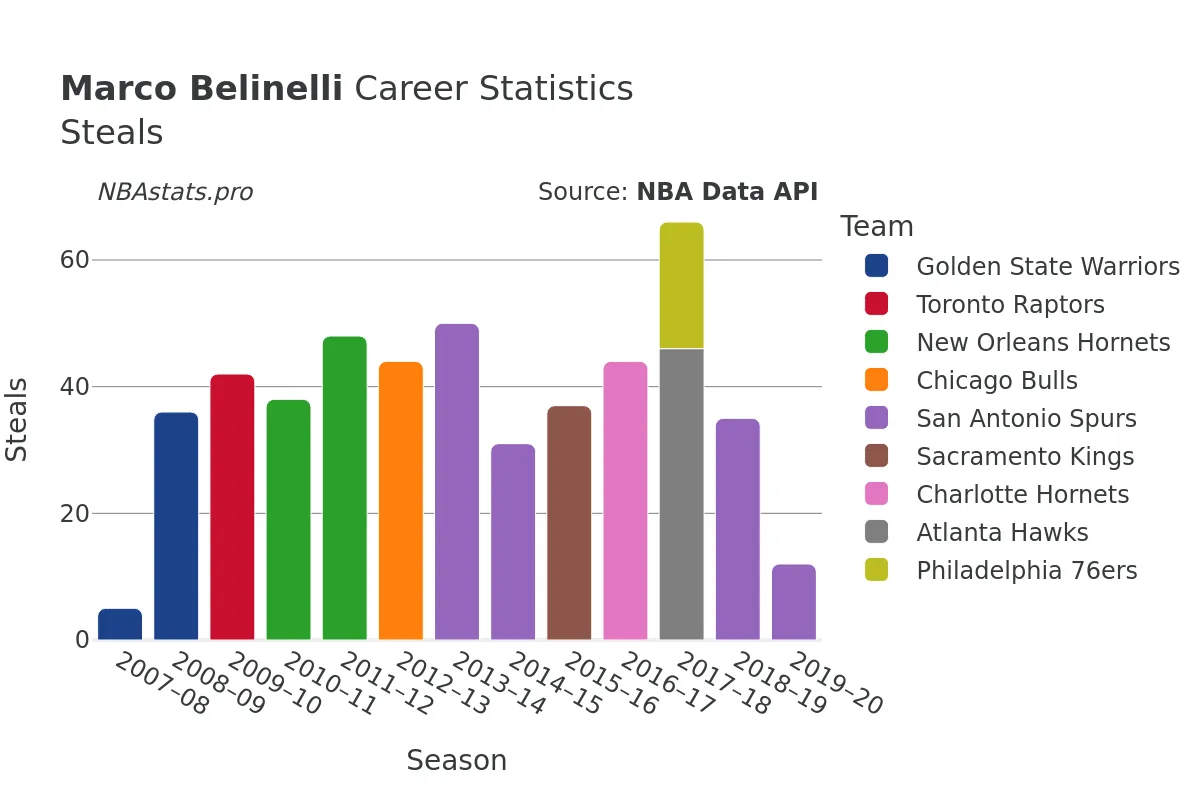
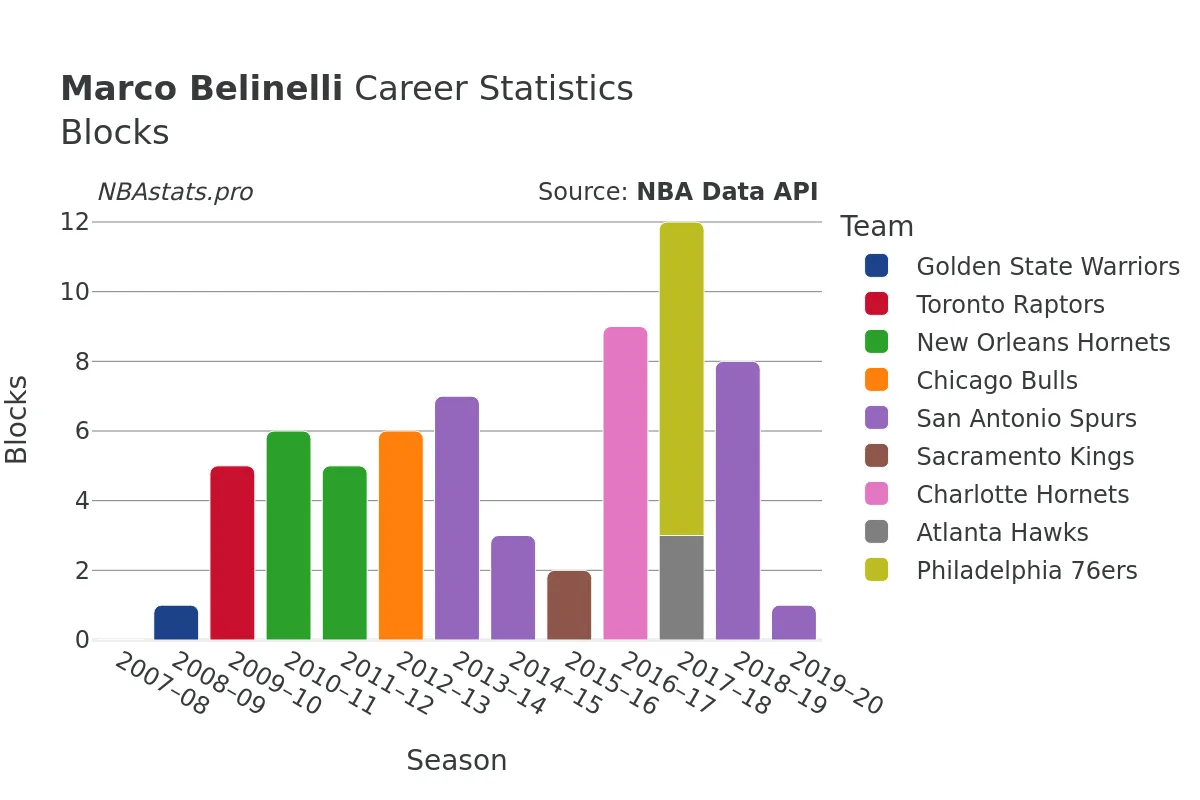
Beyond scoring, Belinelli's impact extended to other facets of the game as well. His on-court presence was felt in his 1920 rebounds, with 1713 coming on the defensive end and 207 on the offensive glass. Furthermore, Belinelli showcased his playmaking abilities with 1577 assists, highlighting his basketball IQ and vision on the court. On the defensive end, Belinelli proved to be a formidable force, amassing 554 steals and 77 blocks throughout his career, showcasing his well-rounded skill set.
As a seasoned veteran in the NBA, Belinelli's experience and leadership were invaluable to the teams he played for. His journey through various cities and states across the United States and Canada not only shaped his career but also left a lasting impact on the fans and basketball community. Despite his decision to step away from active play after the 2019-20 season, Belinelli's legacy continues to inspire young and aspiring basketball players to chase their dreams and leave their mark on the game.
For fans, analysts, and basketball enthusiasts alike, delving into Belinelli's career statistics offers a deeper insight into his playing style, contributions to his teams, and impact on the game. As you explore the numbers and charts that map out Belinelli's NBA journey, you'll uncover the story of a player who brought skill, passion, and dedication to the court, leaving a legacy that will be remembered for years to come.
So, grab your jerseys, lace-up your sneakers, and get ready to immerse yourself in the world of Marco Belinelli – a player whose name will forever be etched in the annals of NBA history.
Read more
Games Played
Points
Assists
Rebounds
Steals
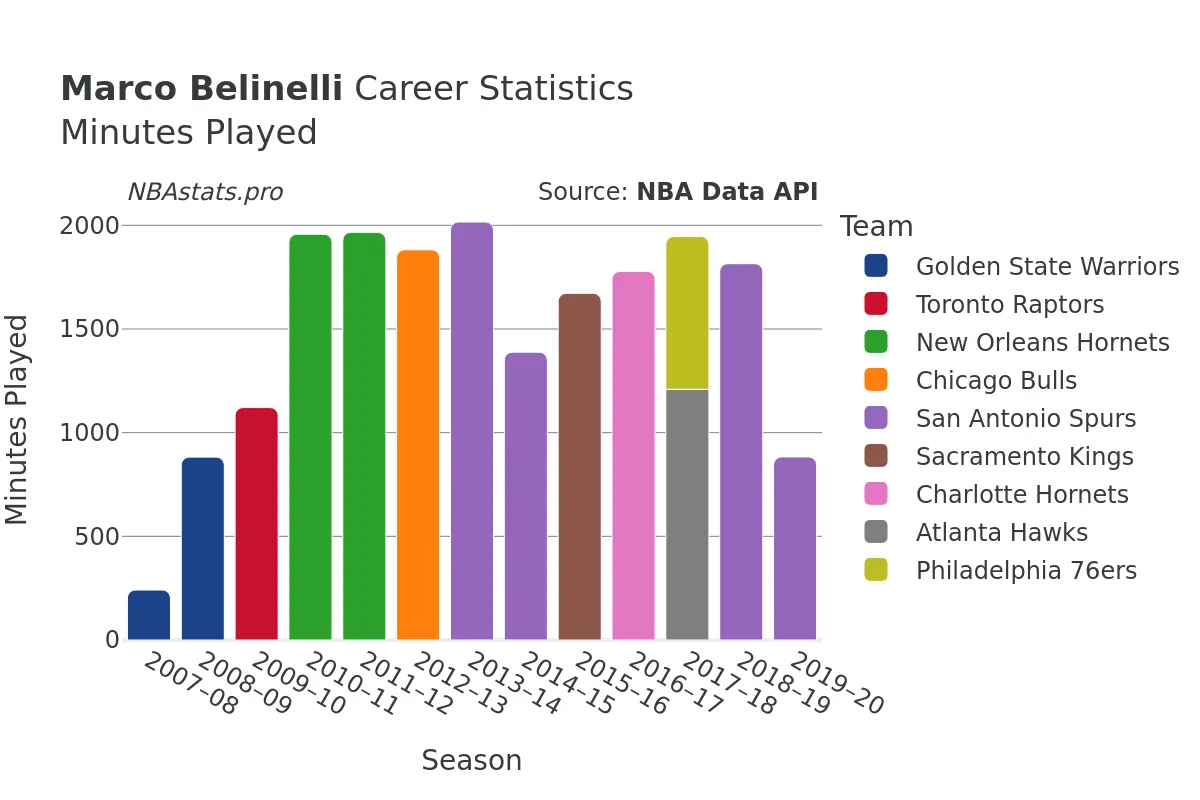
Minutes Played
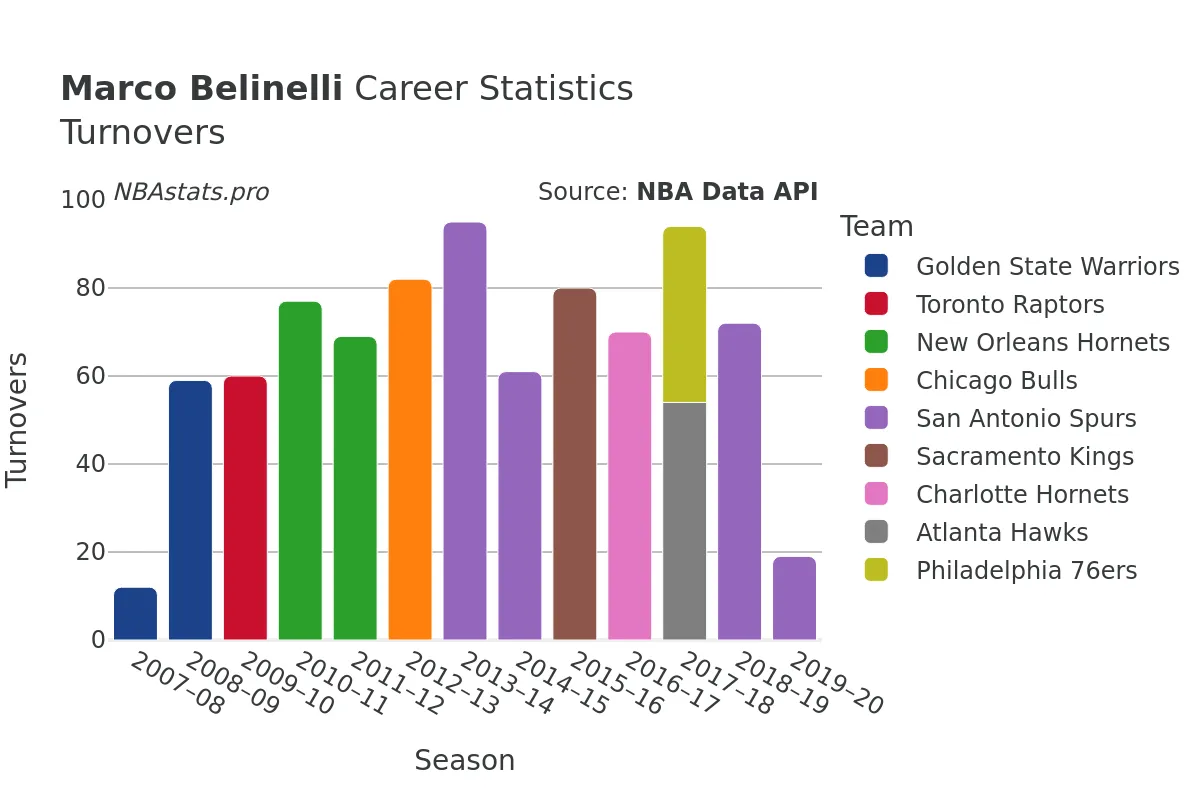
Turnovers
Blocks
Marco Belinelli Career Stats Table
| SEASON | TEAM | AGE | GP | GS | MIN | FGM | FGA | FG % | FG3M | FG3A | FG3 % | FTM | FTA | FT % | OREB | DREB | REB | AST | STL | BLK | TOV | PF | PTS | |
|---|---|---|---|---|---|---|---|---|---|---|---|---|---|---|---|---|---|---|---|---|---|---|---|---|
| 1 | 2007-08 | GSW | 22 | 33 | 0 | 241 | 36 | 93 | 38.7% | 16 | 41 | 39.0% | 7 | 9 | 77.8% | 3 | 11 | 14 | 15 | 5 | 0 | 12 | 15 | 95 |
| 2 | 2008-09 | GSW | 23 | 42 | 23 | 882 | 140 | 317 | 44.2% | 52 | 131 | 39.7% | 40 | 52 | 76.9% | 10 | 61 | 71 | 88 | 36 | 1 | 59 | 73 | 372 |
| 3 | 2009-10 | TOR | 24 | 66 | 1 | 1,121 | 154 | 379 | 40.6% | 60 | 158 | 38.0% | 101 | 121 | 83.5% | 14 | 81 | 95 | 89 | 42 | 5 | 60 | 80 | 469 |
| 4 | 2010-11 | NOH | 25 | 80 | 69 | 1,957 | 302 | 691 | 43.7% | 134 | 324 | 41.4% | 98 | 125 | 78.4% | 17 | 134 | 151 | 92 | 38 | 6 | 77 | 146 | 836 |
| 5 | 2011-12 | NOH | 26 | 66 | 55 | 1,966 | 286 | 686 | 41.7% | 107 | 284 | 37.7% | 101 | 129 | 78.3% | 19 | 153 | 172 | 101 | 48 | 5 | 69 | 115 | 780 |
| 6 | 2012-13 | CHI | 27 | 73 | 27 | 1,882 | 241 | 610 | 39.5% | 79 | 221 | 35.7% | 141 | 168 | 83.9% | 13 | 127 | 140 | 148 | 44 | 6 | 82 | 140 | 702 |
| 7 | 2013-14 | SAS | 28 | 80 | 25 | 2,016 | 337 | 695 | 48.5% | 126 | 293 | 43.0% | 111 | 131 | 84.7% | 18 | 208 | 226 | 179 | 50 | 7 | 95 | 130 | 911 |
| 8 | 2014-15 | SAS | 29 | 62 | 9 | 1,388 | 199 | 470 | 42.3% | 86 | 230 | 37.4% | 84 | 99 | 84.8% | 26 | 131 | 157 | 94 | 31 | 3 | 61 | 85 | 568 |
| 9 | 2015-16 | SAC | 30 | 68 | 7 | 1,672 | 245 | 635 | 38.6% | 91 | 297 | 30.6% | 115 | 138 | 83.3% | 10 | 107 | 117 | 127 | 37 | 2 | 80 | 91 | 696 |
| 10 | 2016-17 | CHA | 31 | 74 | 0 | 1,778 | 264 | 615 | 42.9% | 102 | 283 | 36.0% | 150 | 168 | 89.3% | 14 | 164 | 178 | 147 | 44 | 9 | 70 | 90 | 780 |
| 11 | 2017-18 | ATL | 32 | 52 | 1 | 1,209 | 199 | 485 | 41.0% | 92 | 247 | 37.2% | 101 | 109 | 92.7% | 14 | 86 | 100 | 103 | 46 | 3 | 54 | 41 | 591 |
| 12 | 2017-18 | PHI | 32 | 28 | 1 | 737 | 138 | 279 | 49.5% | 57 | 148 | 38.5% | 47 | 54 | 87.0% | 6 | 45 | 51 | 45 | 20 | 9 | 40 | 50 | 380 |
| 13 | 2017-18 | TOT | 32 | 80 | 2 | 1,947 | 337 | 764 | 44.1% | 149 | 395 | 37.7% | 148 | 163 | 90.8% | 20 | 131 | 151 | 148 | 66 | 12 | 94 | 91 | 971 |
| 14 | 2018-19 | SAS | 33 | 79 | 1 | 1,815 | 285 | 690 | 41.3% | 147 | 395 | 37.2% | 112 | 124 | 90.3% | 16 | 182 | 198 | 132 | 35 | 8 | 72 | 121 | 829 |
| 15 | 2019-20 | SAS | 34 | 57 | 0 | 883 | 123 | 314 | 39.2% | 67 | 178 | 37.6% | 48 | 58 | 82.8% | 7 | 92 | 99 | 69 | 12 | 1 | 19 | 45 | 361 |
Max Min
NBA Alltime Leaders
Games Played
Robert Parish: 1,611Kareem Abdul-Jabbar: 1,560
Vince Carter: 1,541
Dirk Nowitzki: 1,522
John Stockton: 1,504
Points
LeBron James: 40,474Kareem Abdul-Jabbar: 38,387
Karl Malone: 36,928
Kobe Bryant: 33,643
Michael Jordan: 32,292
Steals
John Stockton: 3,265Jason Kidd: 2,684
Chris Paul: 2,614
Michael Jordan: 2,514
Gary Payton: 2,445
Free Throws Made
Karl Malone: 9,787Moses Malone: 8,531
LeBron James: 8,390
Kobe Bryant: 8,378
Oscar Robertson: 7,694