Jordan Farmar Stats: NBA Career

Jordan Farmar is a name that resonates with basketball enthusiasts across the globe. His journey through the NBA, spanning over a decade, is a testament to his skill, dedication, and passion for the game. Farmar's career saw him don the jerseys of some powerhouse teams, leaving a lasting impact wherever he went.
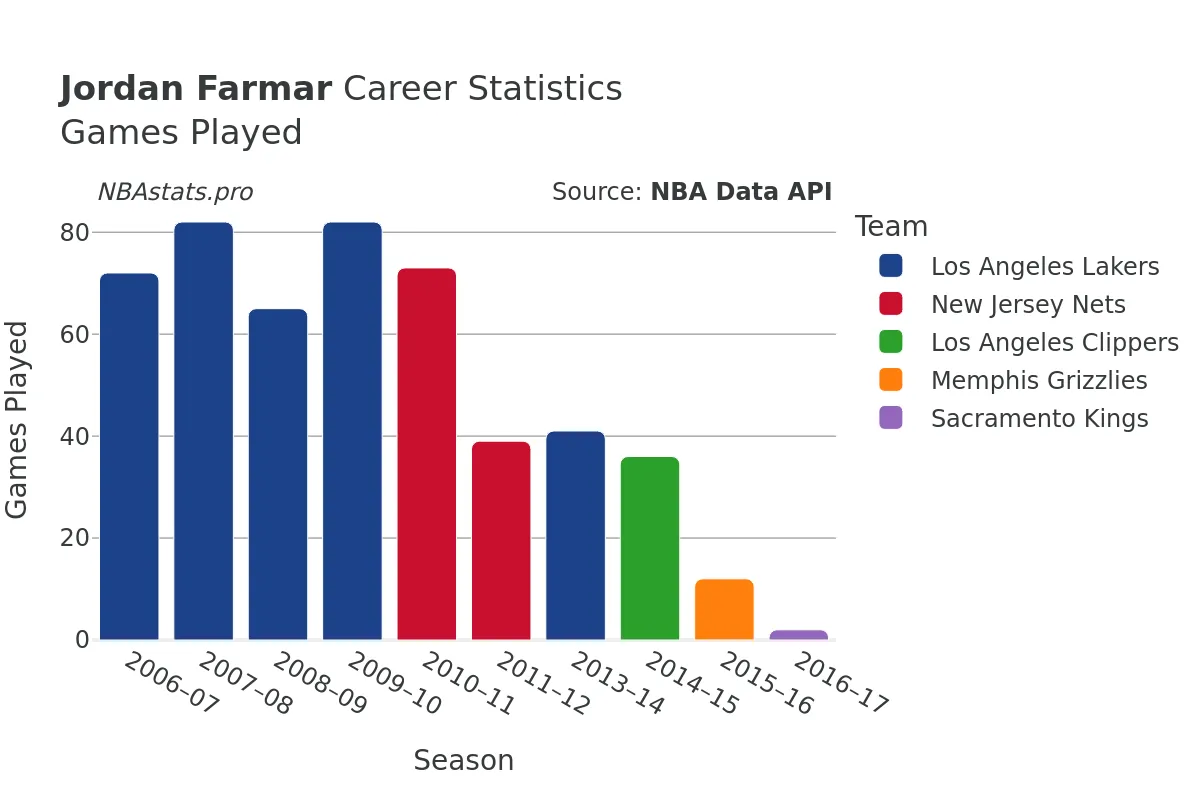
Kicking off his NBA expedition in the 2006-07 season at the tender age of 20, Farmar embarked on a remarkable journey that saw him play for five different teams over the following decad...e. From the bright lights of Los Angeles with the Lakers to the bustling streets of Brooklyn with the Nets, Farmar showcased his versatility and adaptability on the court.
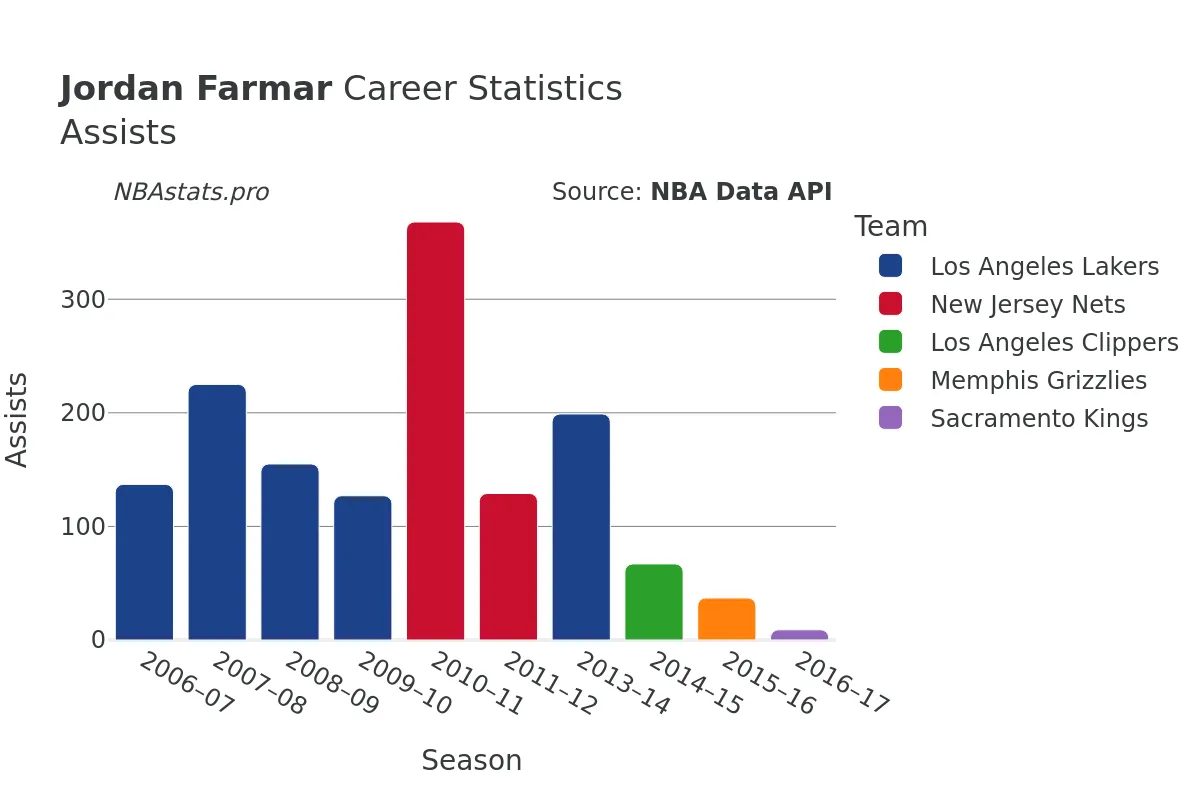
As a point guard, Farmar was known for his playmaking abilities, sharpshooting, and defensive prowess. In a total of 504 games played, he accumulated an impressive stat line, with 1460 field goals made out of 3452 attempts, boasting a shooting percentage of 42.29%. His contribution was not limited to scoring alone, as evidenced by his 1453 assists, making him a valuable asset in setting up plays and orchestrating his team's offense.
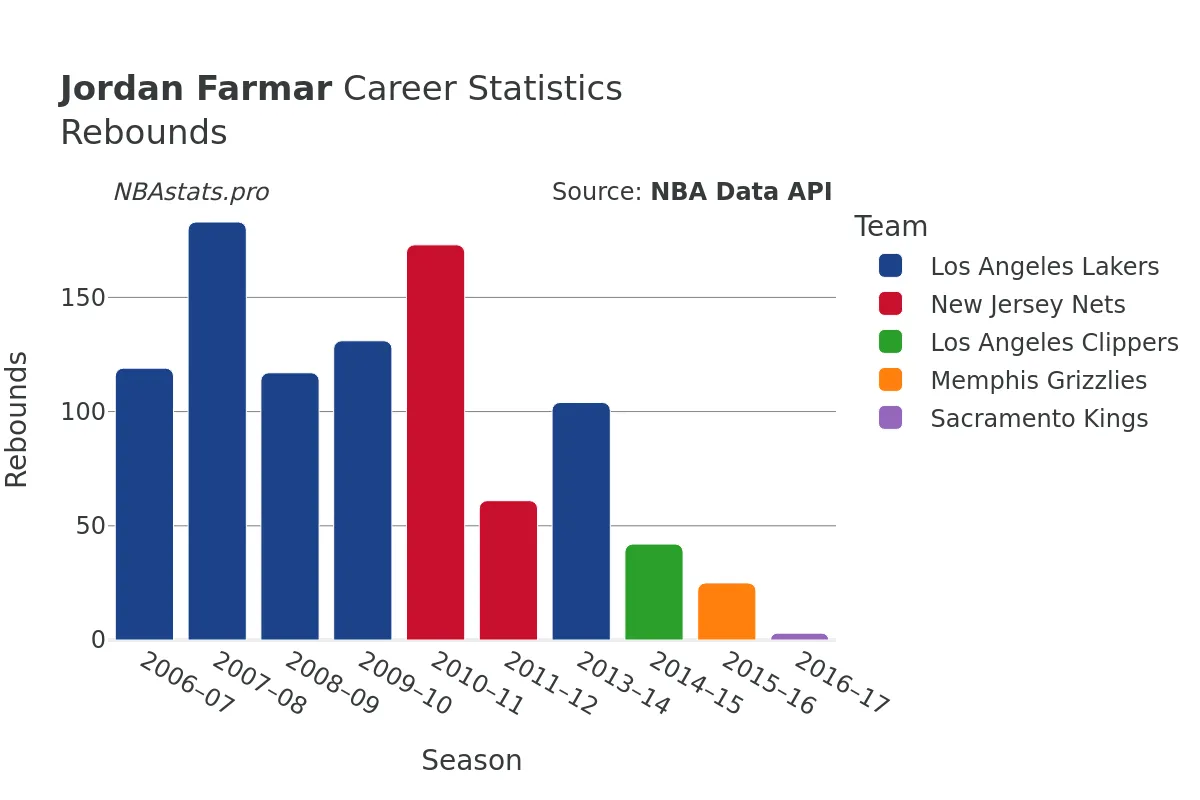
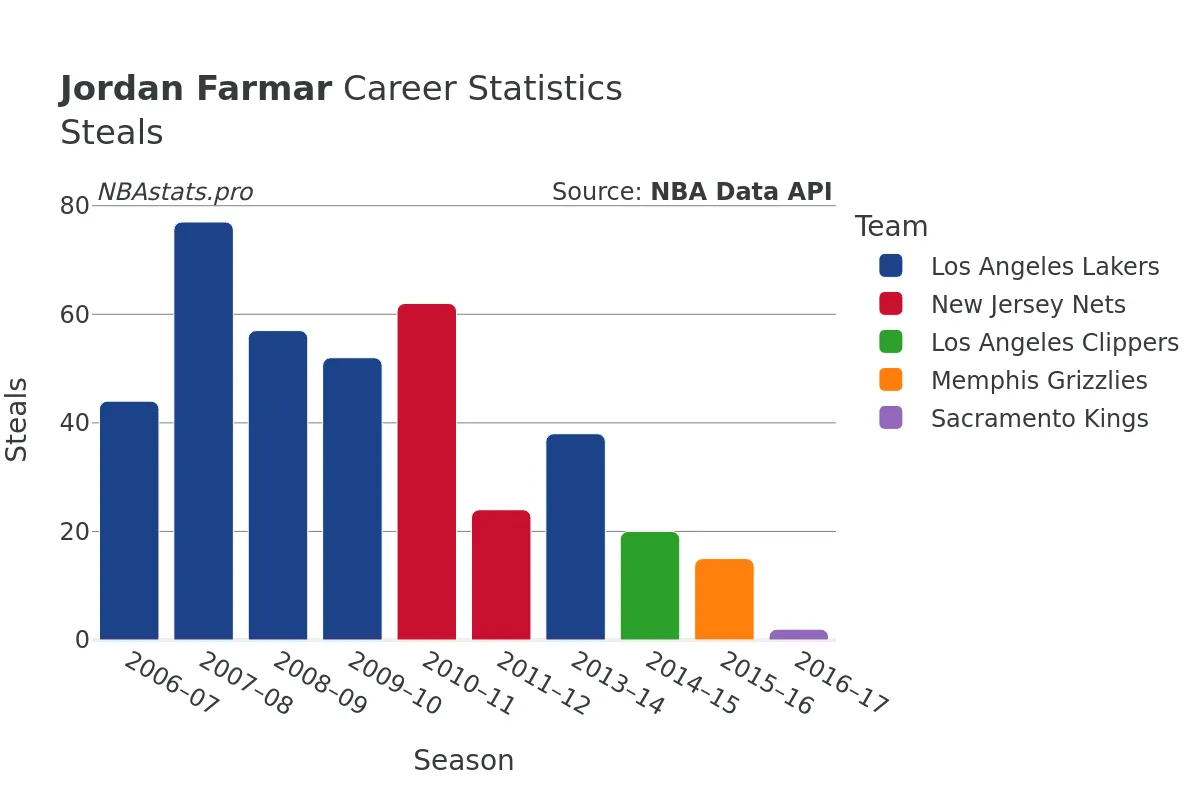
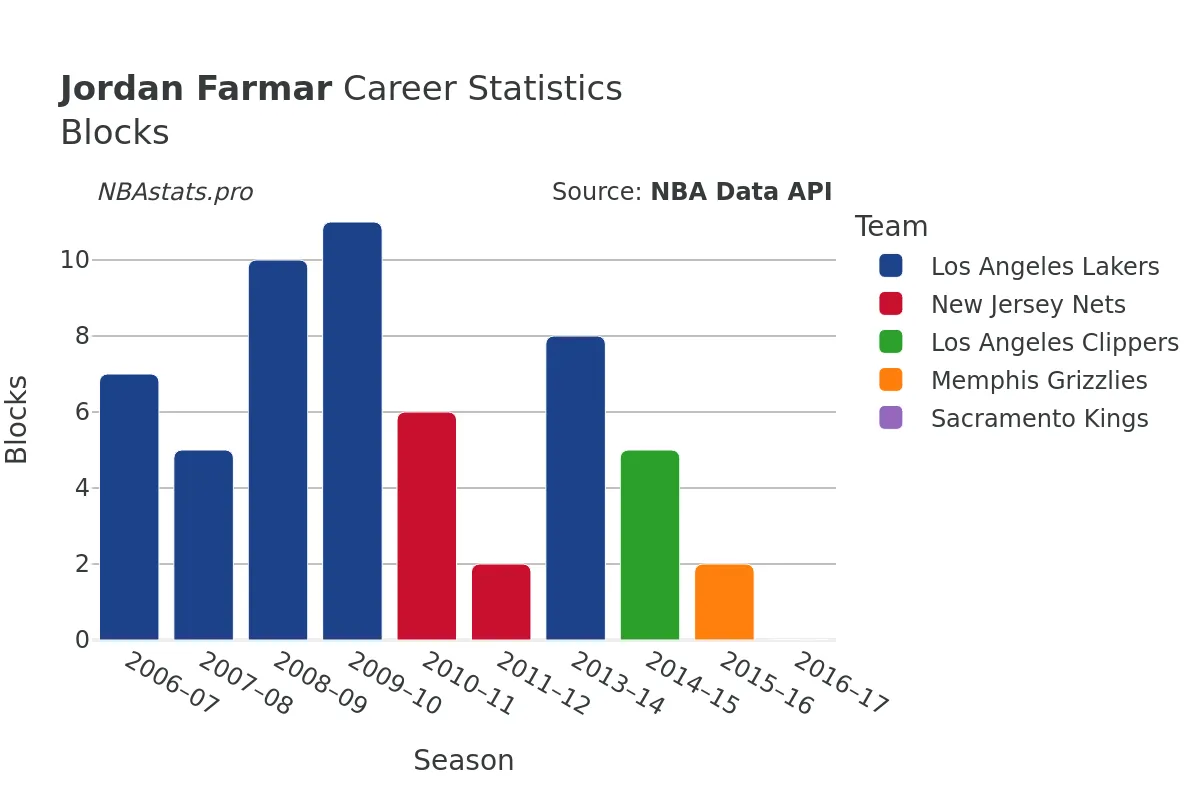
Farmar's impact extended beyond scoring and passing, as he proved to be a force to be reckoned with on the defensive end as well. His 391 steals and 56 blocks showcased his tenacity and commitment to making life difficult for the opposition. Additionally, Farmar was a reliable presence on the boards, amassing a total of 958 rebounds, with 797 on the defensive end and 161 on the offensive end, underscoring his well-rounded skill set.
One aspect of Farmar's game that truly set him apart was his consistency from the free-throw line. Boasting a free-throw percentage of 100%, Farmar's accuracy and composure in crucial moments made him a reliable closer for his team. His 385 successful free throws out of 521 attempts highlighted his efficiency and reliability when it mattered most.
Throughout his career, Farmar left an indelible mark on the teams he represented, bringing a blend of talent, experience, and leadership to the court. Whether it was guiding young talents, executing clutch plays, or locking down on defense, Farmar's contributions were instrumental in shaping the success of his teams.
As Farmar's journey in the NBA came to a close after the 2016-17 season, his legacy as a skilled playmaker and a fierce competitor endures. His passion for the game, work ethic, and unwavering commitment to excellence serve as an inspiration to aspiring basketball players around the world.
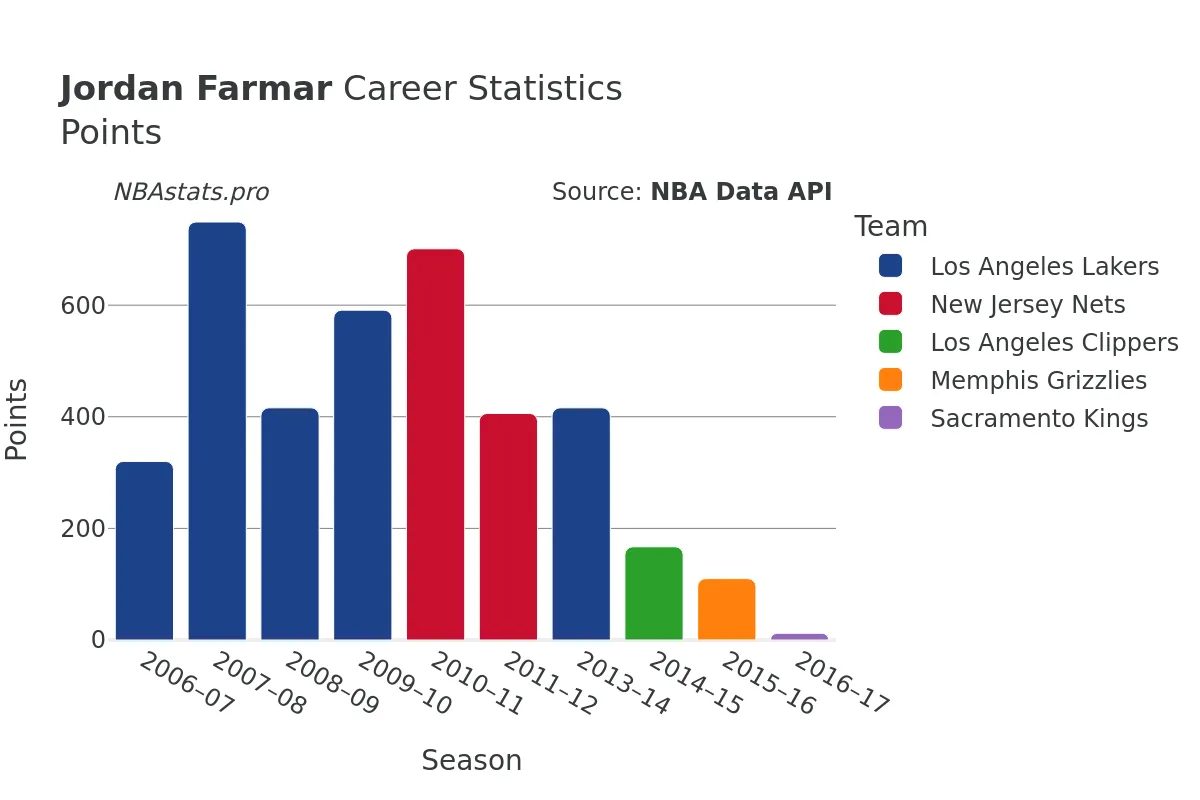
Exploring Farmar's career statistics in-depth provides a fascinating glimpse into the skill and determination that defined his time in the NBA. From his scoring prowess to his playmaking wizardry, every number tells a story of a player who left it all on the court and etched his name in the annals of basketball history.
So, dive into the charts, analyze the numbers, and unravel the story of Jordan Farmar, a player whose impact reverberates far beyond the hardwood.
Read more
Games Played
Points
Assists
Rebounds
Steals
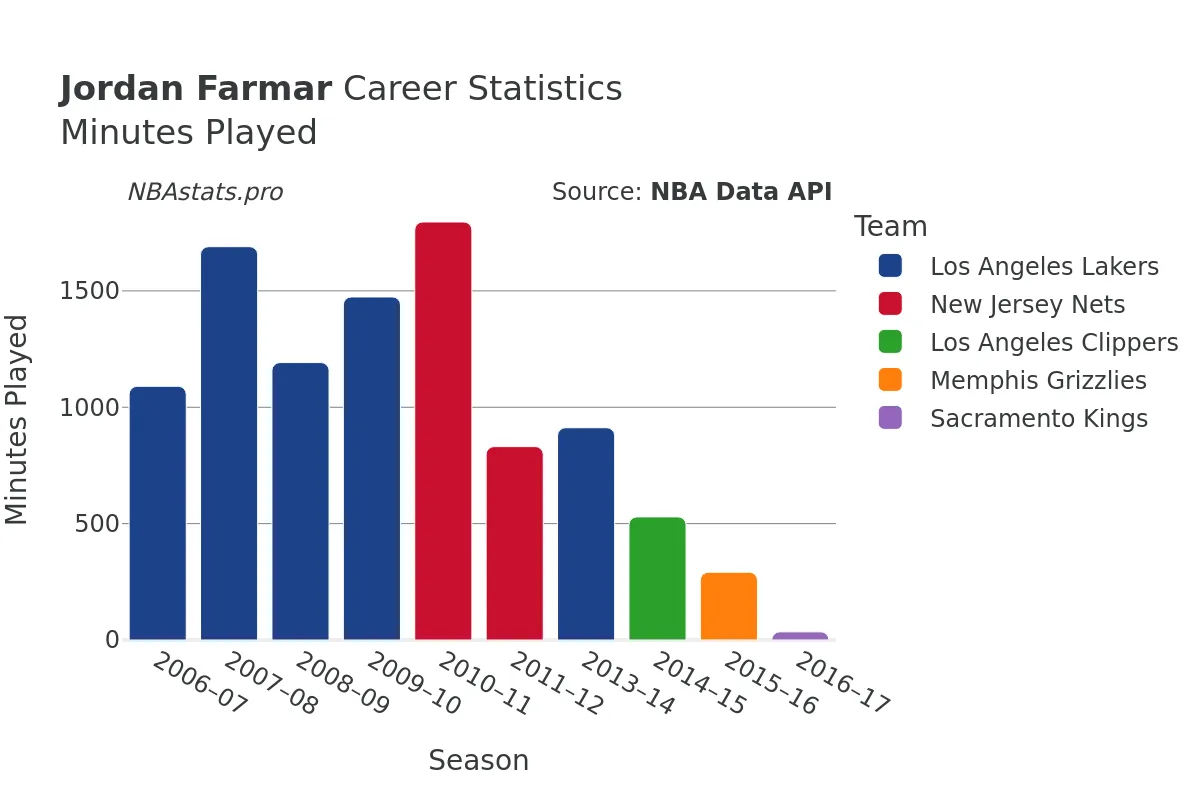
Minutes Played
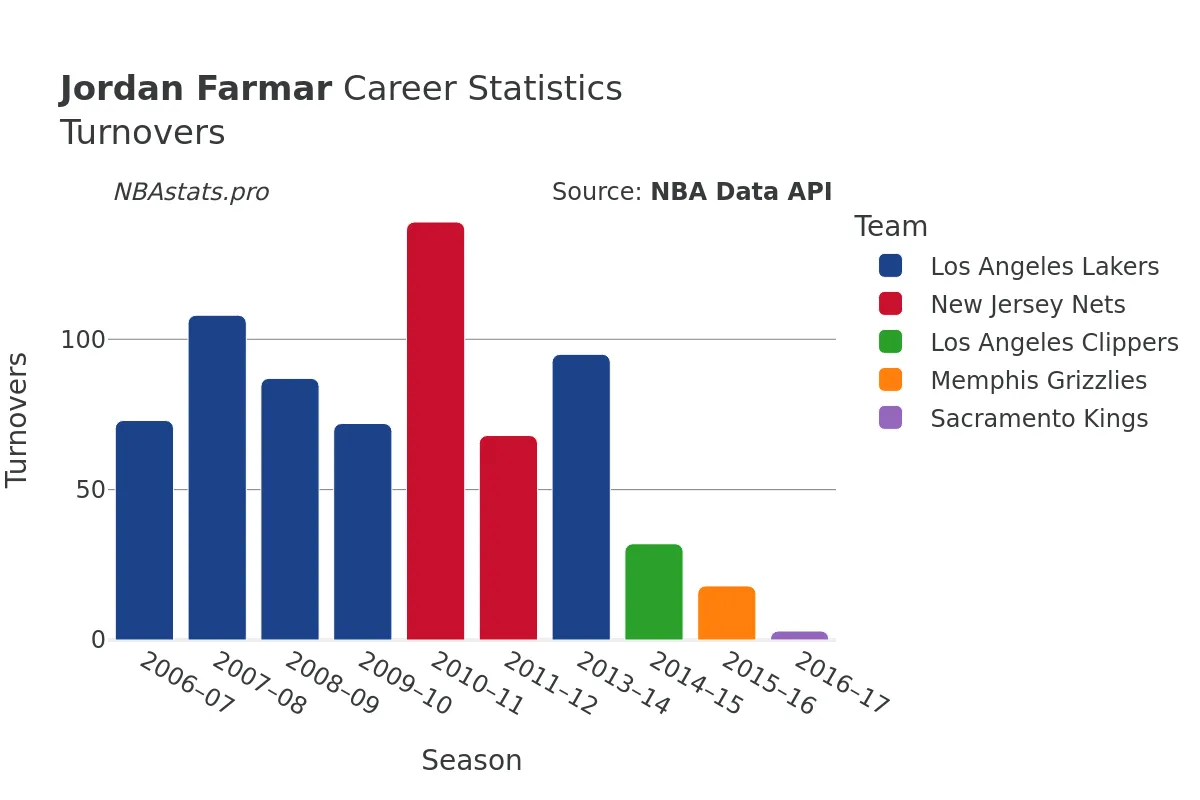
Turnovers
Blocks
Jordan Farmar Career Stats Table
| SEASON | TEAM | AGE | GP | GS | MIN | FGM | FGA | FG % | FG3M | FG3A | FG3 % | FTM | FTA | FT % | OREB | DREB | REB | AST | STL | BLK | TOV | PF | PTS | |
|---|---|---|---|---|---|---|---|---|---|---|---|---|---|---|---|---|---|---|---|---|---|---|---|---|
| 1 | 2006-07 | LAL | 20 | 72 | 2 | 1,090 | 124 | 294 | 42.2% | 45 | 137 | 32.8% | 27 | 38 | 71.1% | 22 | 97 | 119 | 137 | 44 | 7 | 73 | 77 | 320 |
| 2 | 2007-08 | LAL | 21 | 82 | 0 | 1,690 | 291 | 631 | 46.1% | 114 | 307 | 37.1% | 53 | 78 | 67.9% | 39 | 144 | 183 | 225 | 77 | 5 | 108 | 105 | 749 |
| 3 | 2008-09 | LAL | 22 | 65 | 0 | 1,192 | 161 | 412 | 39.1% | 49 | 146 | 33.6% | 45 | 77 | 58.4% | 22 | 95 | 117 | 155 | 57 | 10 | 87 | 105 | 416 |
| 4 | 2009-10 | LAL | 23 | 82 | 0 | 1,474 | 224 | 515 | 43.5% | 86 | 229 | 37.6% | 57 | 85 | 67.1% | 14 | 117 | 131 | 127 | 52 | 11 | 72 | 109 | 591 |
| 5 | 2010-11 | NJN | 24 | 73 | 18 | 1,796 | 255 | 651 | 39.2% | 109 | 304 | 35.9% | 82 | 100 | 82.0% | 24 | 149 | 173 | 368 | 62 | 6 | 139 | 128 | 701 |
| 6 | 2011-12 | NJN | 25 | 39 | 5 | 831 | 147 | 315 | 46.7% | 55 | 125 | 44.0% | 57 | 63 | 90.5% | 7 | 54 | 61 | 129 | 24 | 2 | 68 | 49 | 406 |
| 7 | 2013-14 | LAL | 27 | 41 | 5 | 912 | 151 | 364 | 41.5% | 70 | 160 | 43.8% | 44 | 59 | 74.6% | 20 | 84 | 104 | 199 | 38 | 8 | 95 | 65 | 416 |
| 8 | 2014-15 | LAC | 28 | 36 | 0 | 529 | 61 | 158 | 38.6% | 35 | 97 | 36.1% | 10 | 11 | 90.9% | 8 | 34 | 42 | 67 | 20 | 5 | 32 | 52 | 167 |
| 9 | 2015-16 | MEM | 29 | 12 | 10 | 291 | 42 | 100 | 42.0% | 16 | 45 | 35.6% | 10 | 10 | 100.0% | 4 | 21 | 25 | 37 | 15 | 2 | 18 | 22 | 110 |
| 10 | 2016-17 | SAC | 30 | 2 | 0 | 35 | 4 | 12 | 33.3% | 4 | 9 | 44.4% | 0 | 0 | 0.0% | 1 | 2 | 3 | 9 | 2 | 0 | 3 | 1 | 12 |
Max Min
NBA Alltime Leaders
Games Played
Robert Parish: 1,611Kareem Abdul-Jabbar: 1,560
Vince Carter: 1,541
Dirk Nowitzki: 1,522
John Stockton: 1,504
Points
LeBron James: 40,474Kareem Abdul-Jabbar: 38,387
Karl Malone: 36,928
Kobe Bryant: 33,643
Michael Jordan: 32,292
Steals
John Stockton: 3,265Jason Kidd: 2,684
Chris Paul: 2,614
Michael Jordan: 2,514
Gary Payton: 2,445
Free Throws Made
Karl Malone: 9,787Moses Malone: 8,531
LeBron James: 8,390
Kobe Bryant: 8,378
Oscar Robertson: 7,694