John Henson Stats: NBA Career

John Henson, a versatile NBA player who has showcased his skills on multiple teams over the course of his career. Henson made his mark in the league playing for the Milwaukee Bucks, Cleveland Cavaliers, and Detroit Pistons, representing the cities of Milwaukee, Cleveland, and Detroit. The journey of this talented forward/center in the basketball world is certainly one filled with numbers, records, and memorable moments.
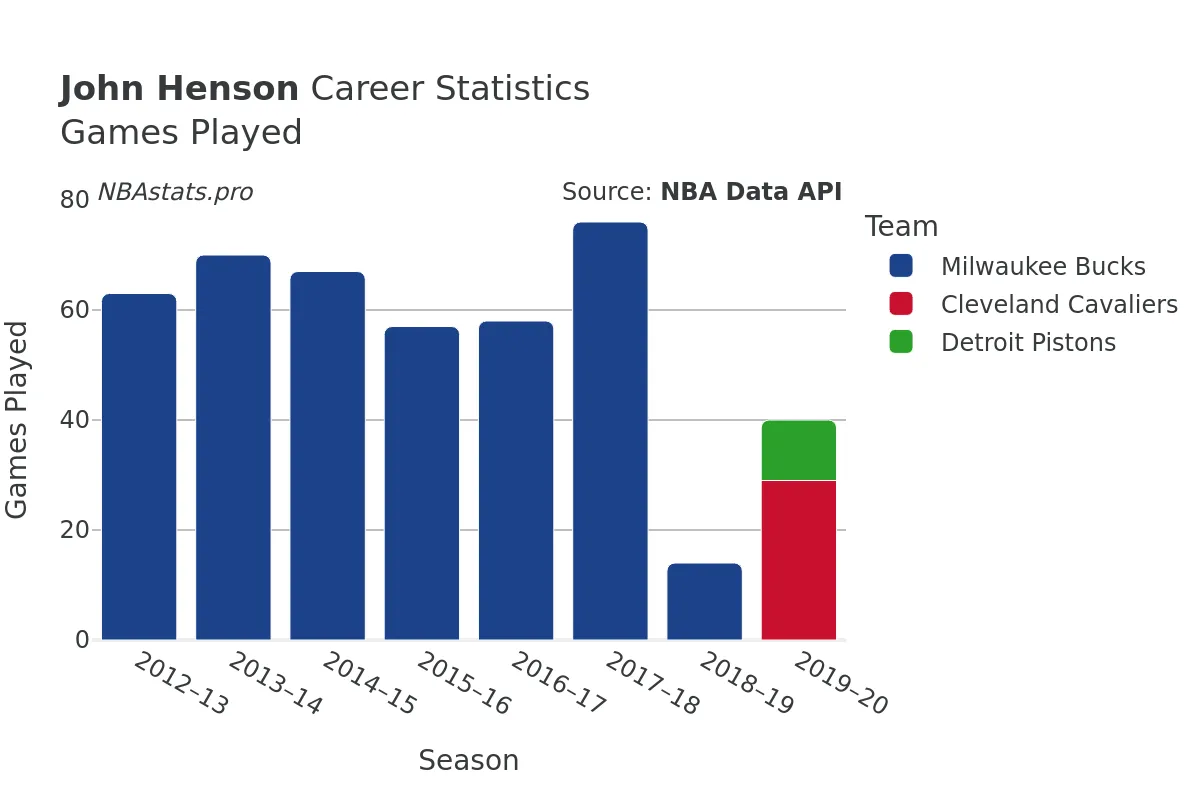
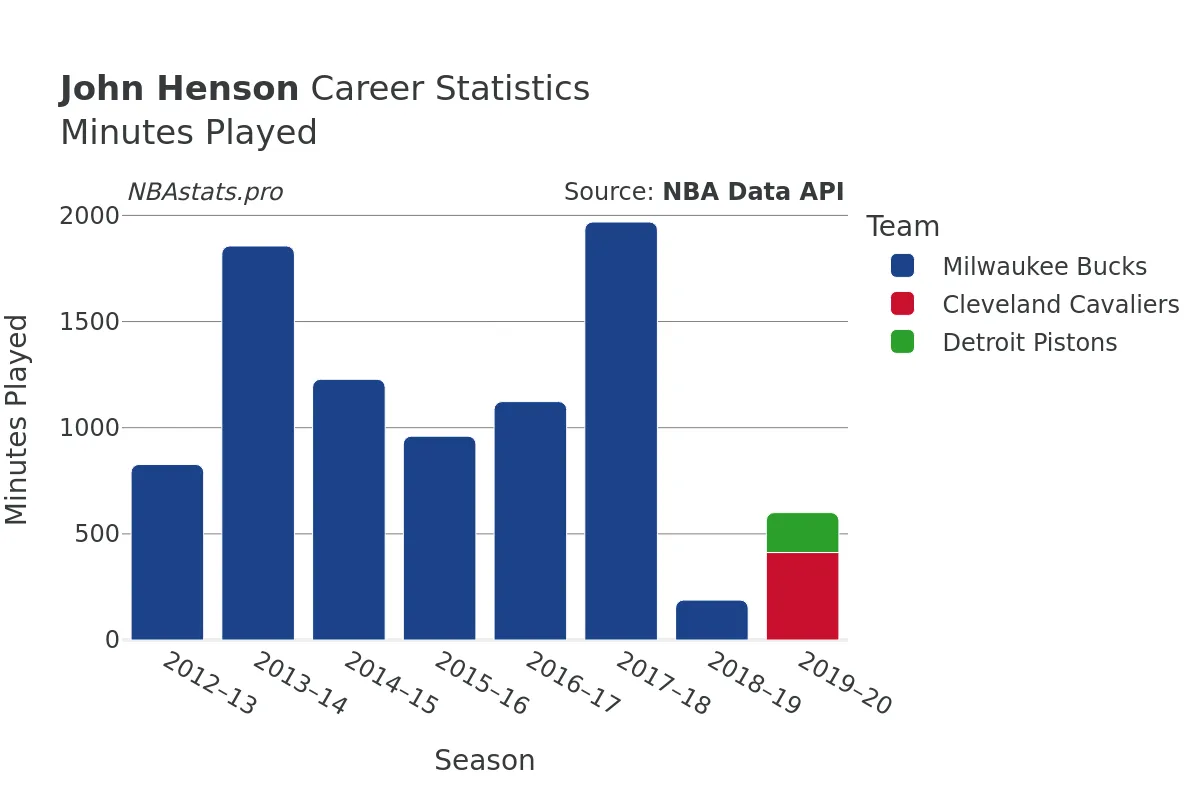
Henson entered the NBA in the 2012-13 season and continued to compete at a ...high level until the 2019-20 season. Starting his career at the young age of 22, he spent a solid eight seasons in the league before taking a break. Throughout his time on the court, Henson appeared in 485 games, accumulating an impressive total of 9351 minutes played. His presence on the court was always felt, whether it was through scoring, rebounding, blocking shots, or dishing out assists.
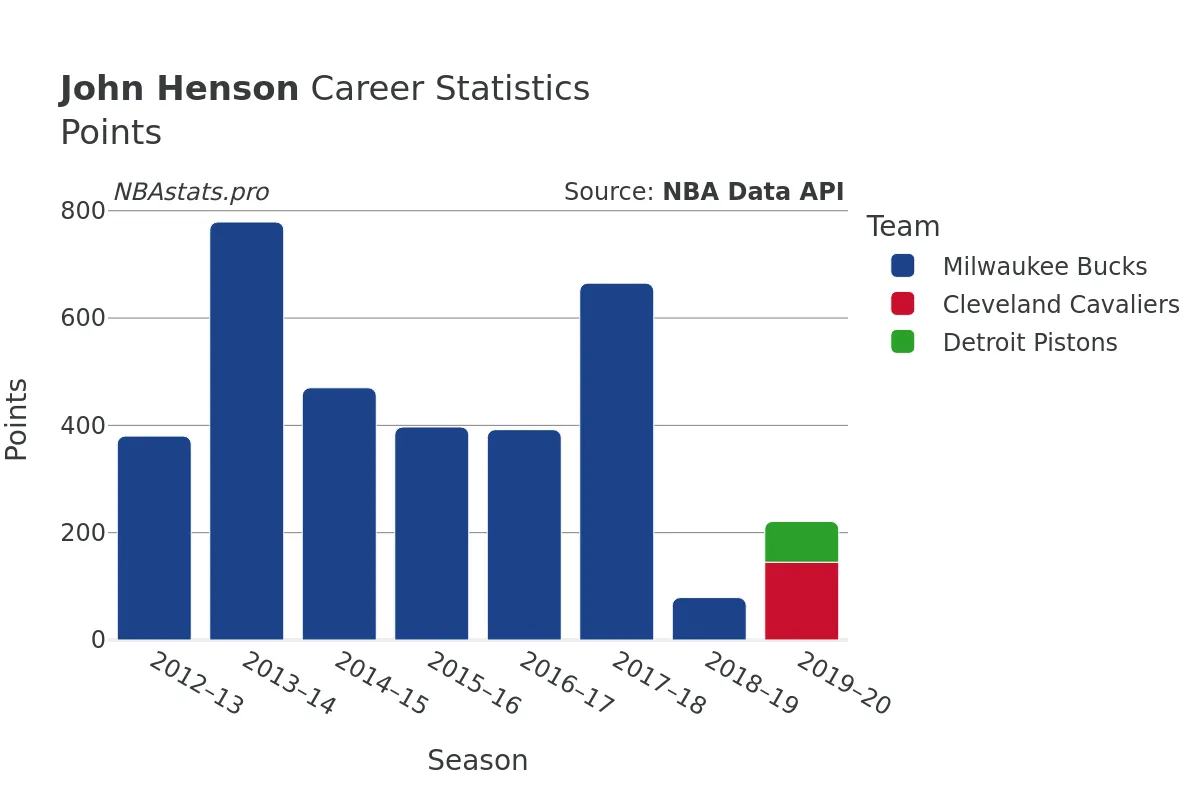
When it comes to scoring, Henson was no stranger to putting up points on the board. With 2832 field goals attempted, he managed to make 1533 of those shots, boasting a solid field goal percentage of 54.13%. His ability to efficiently convert his scoring opportunities made him a valuable asset to his teams. Moreover, at the free-throw line, Henson displayed accuracy and consistency, making 510 out of 903 attempts, translating to a commendable free-throw percentage.
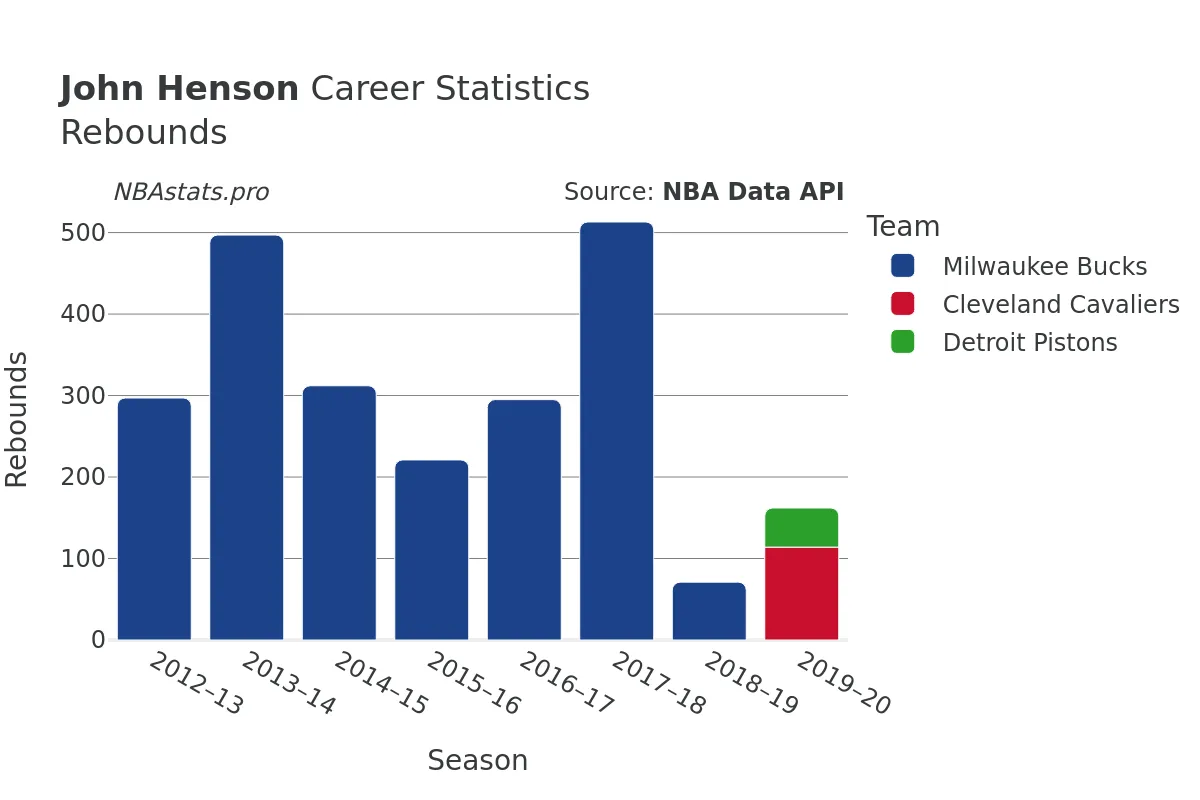
Rebounding was another area where Henson excelled, showcasing his prowess under the boards. Throughout his career, he secured a total of 2530 rebounds, with 1682 coming on the defensive end and 848 on the offensive end. His tenacity and hustle on the glass were evident in his rebounding numbers, providing his team with crucial second-chance opportunities and extra possessions.
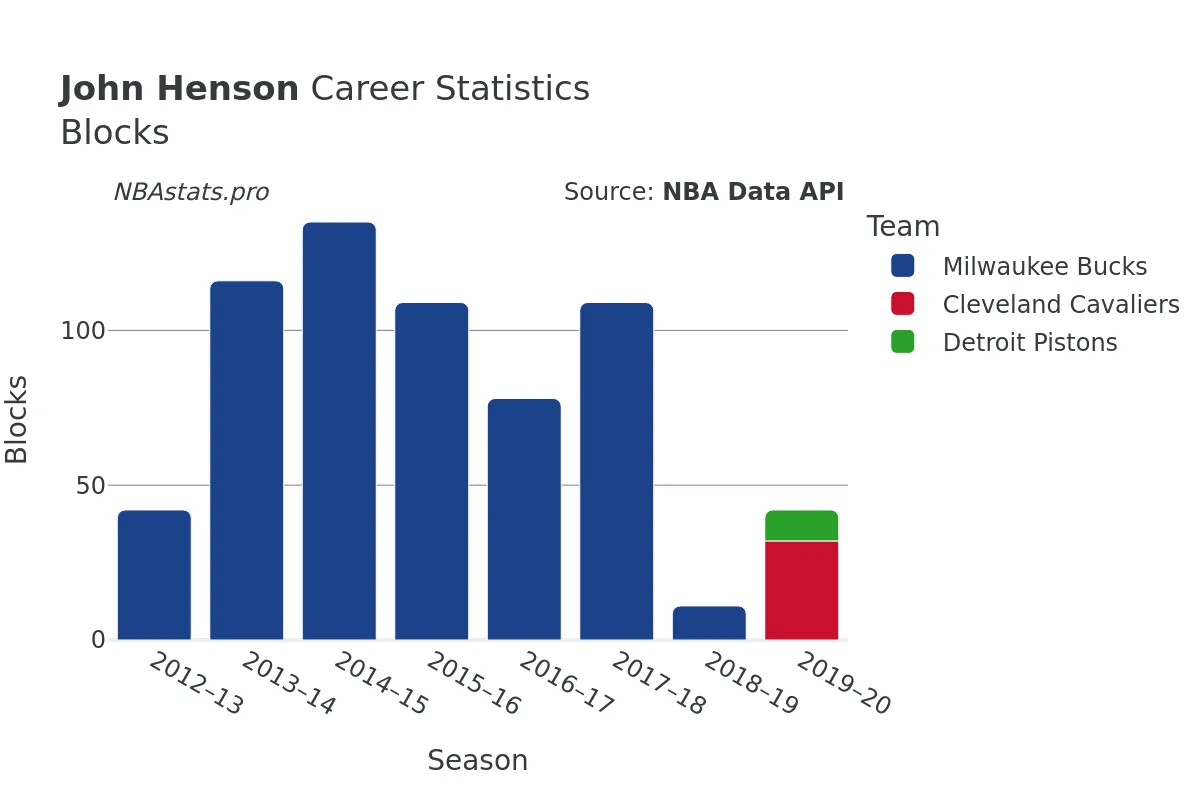
In addition to scoring and rebounding, Henson also made his presence felt on the defensive end. Known for his shot-blocking abilities, he amassed an impressive total of 684 blocks during his time in the league. His timing, length, and defensive instincts allowed him to challenge and alter numerous shot attempts, making it difficult for opponents to score in the paint.
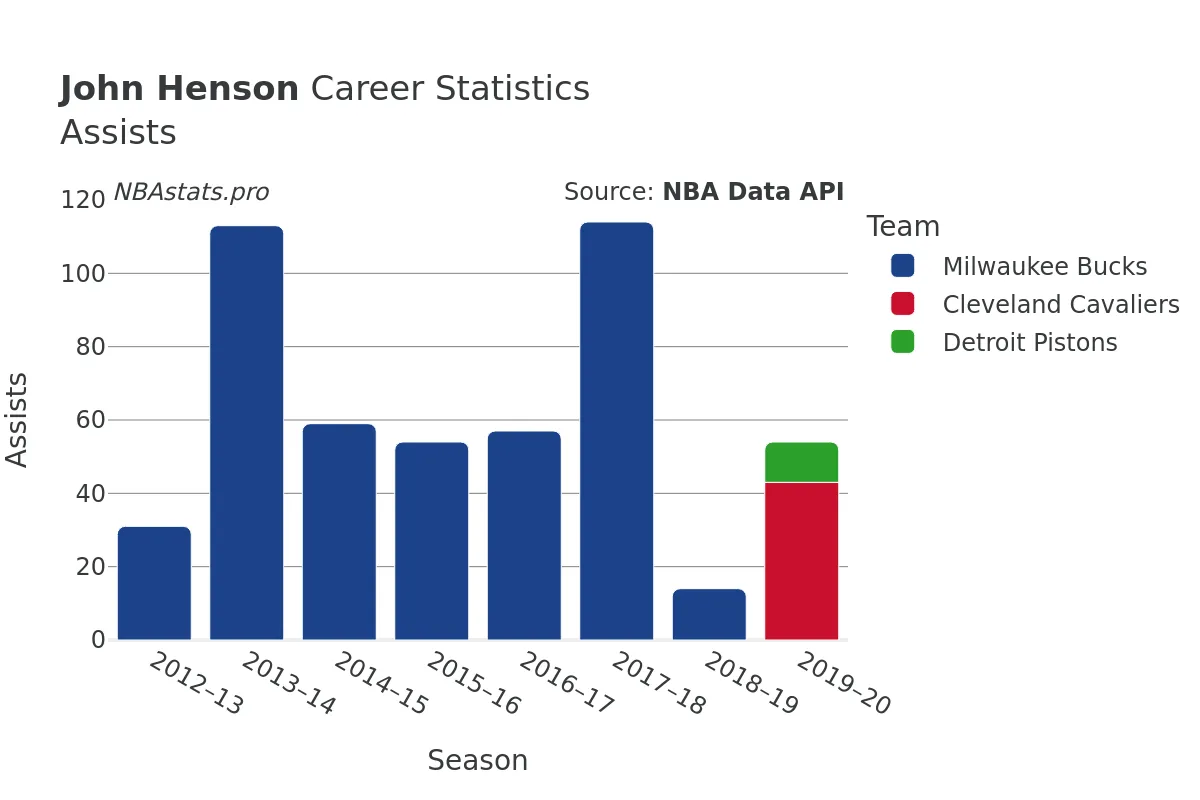
Furthermore, Henson's impact went beyond scoring, rebounding, and defense, as he also showcased his playmaking skills. With 550 career assists, he demonstrated a willingness to facilitate ball movement and create scoring opportunities for his teammates. His ability to see the floor, make intelligent passes, and involve his teammates in the game highlighted his basketball IQ and unselfish style of play.
Throughout his career, Henson accumulated a total of 3604 points, leaving a lasting impression with his contributions on both ends of the court. As a smart, detail-oriented player, Henson's stats tell a story of a dedicated athlete who consistently delivered for his teams and made a difference in various aspects of the game.
By delving into the numbers and exploring the charts that encapsulate John Henson's NBA journey, fans and analysts alike can gain a deeper understanding of the impact he had on the court. His stats paint a vivid picture of a skilled and versatile player who left his mark on the game of basketball. So, take a closer look at the data, analyze the trends, and appreciate the basketball career of John Henson, a player whose numbers speak volumes about his talent and contributions to the sport.
Read more
Games Played
Points
Assists
Rebounds
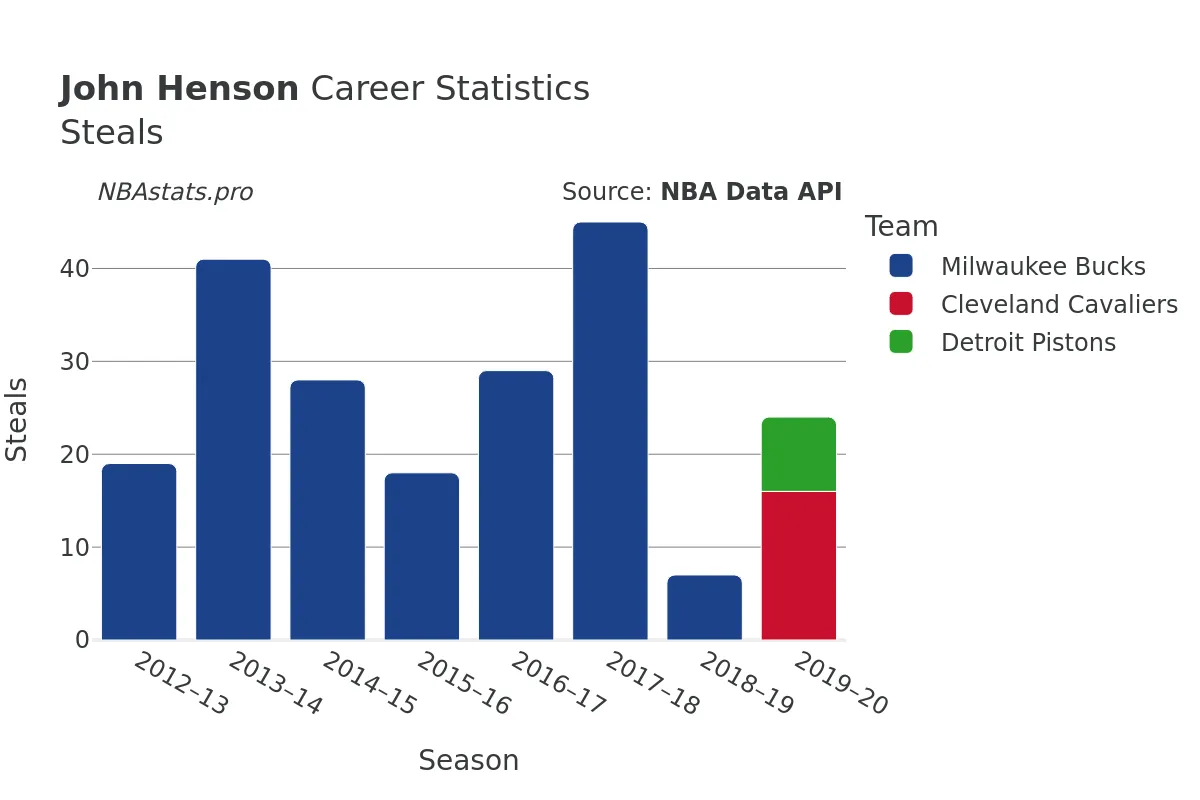
Steals
Minutes Played
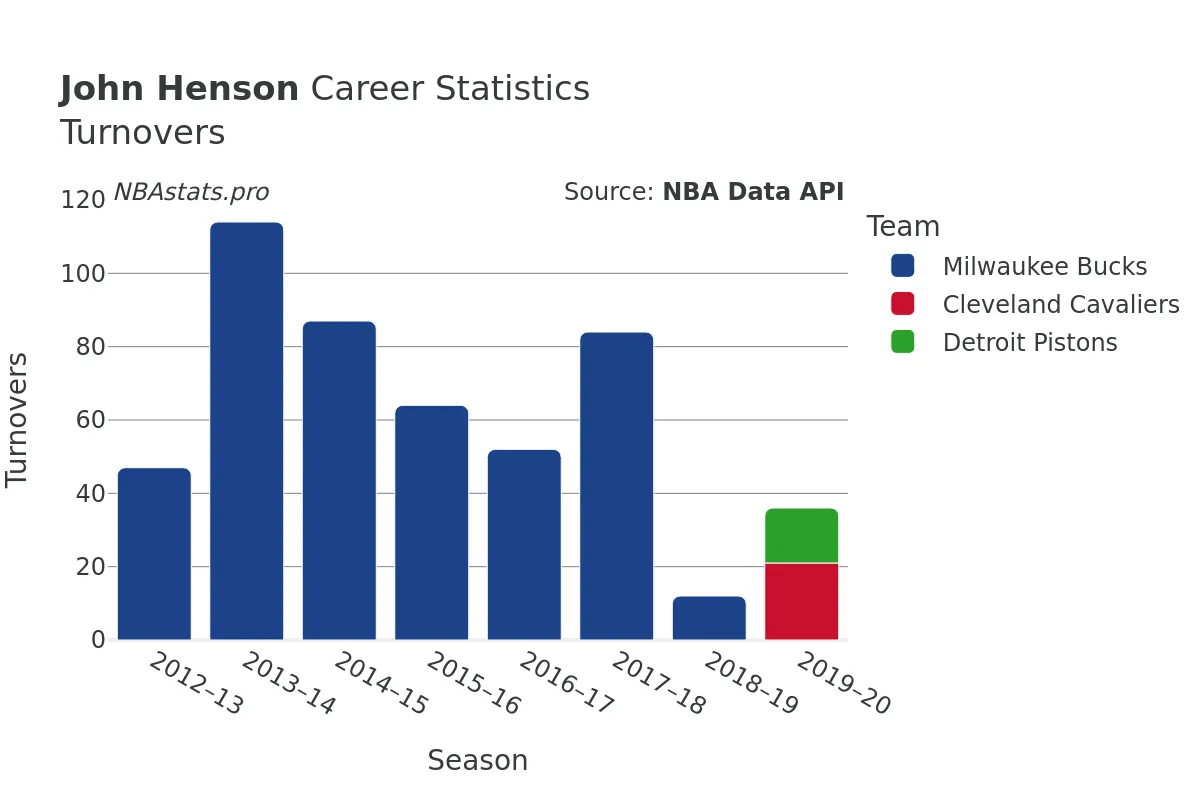
Turnovers
Blocks
John Henson Career Stats Table
| SEASON | TEAM | AGE | GP | GS | MIN | FGM | FGA | FG % | FG3M | FG3A | FG3 % | FTM | FTA | FT % | OREB | DREB | REB | AST | STL | BLK | TOV | PF | PTS | |
|---|---|---|---|---|---|---|---|---|---|---|---|---|---|---|---|---|---|---|---|---|---|---|---|---|
| 1 | 2012-13 | MIL | 22 | 63 | 9 | 827 | 162 | 336 | 48.2% | 0 | 3 | 0.0% | 56 | 105 | 53.3% | 116 | 181 | 297 | 31 | 19 | 42 | 47 | 83 | 380 |
| 2 | 2013-14 | MIL | 23 | 70 | 23 | 1,856 | 344 | 639 | 53.8% | 0 | 1 | 0.0% | 91 | 177 | 51.4% | 171 | 326 | 497 | 113 | 41 | 116 | 114 | 185 | 779 |
| 3 | 2014-15 | MIL | 24 | 67 | 11 | 1,228 | 196 | 346 | 56.6% | 0 | 0 | 0.0% | 78 | 137 | 56.9% | 124 | 188 | 312 | 59 | 28 | 135 | 87 | 152 | 470 |
| 4 | 2015-16 | MIL | 25 | 57 | 1 | 960 | 164 | 291 | 56.4% | 0 | 1 | 0.0% | 69 | 117 | 59.0% | 87 | 134 | 221 | 54 | 18 | 109 | 64 | 131 | 397 |
| 5 | 2016-17 | MIL | 26 | 58 | 39 | 1,123 | 159 | 309 | 51.5% | 0 | 1 | 0.0% | 74 | 107 | 69.2% | 92 | 203 | 295 | 57 | 29 | 78 | 52 | 151 | 392 |
| 6 | 2017-18 | MIL | 27 | 76 | 69 | 1,969 | 287 | 502 | 57.2% | 1 | 7 | 14.3% | 90 | 158 | 57.0% | 150 | 363 | 513 | 114 | 45 | 109 | 84 | 202 | 665 |
| 7 | 2018-19 | MIL | 28 | 14 | 0 | 188 | 31 | 67 | 46.3% | 11 | 31 | 35.5% | 6 | 10 | 60.0% | 16 | 55 | 71 | 14 | 7 | 11 | 12 | 16 | 79 |
| 8 | 2019-20 | CLE | 29 | 29 | 2 | 412 | 61 | 120 | 50.8% | 6 | 31 | 19.4% | 17 | 33 | 51.5% | 32 | 82 | 114 | 43 | 16 | 32 | 21 | 55 | 145 |
| 9 | 2019-20 | DET | 29 | 11 | 6 | 188 | 34 | 51 | 66.7% | 2 | 5 | 40.0% | 6 | 13 | 46.2% | 14 | 34 | 48 | 11 | 8 | 10 | 15 | 23 | 76 |
| 10 | 2019-20 | TOT | 29 | 40 | 8 | 600 | 95 | 171 | 55.6% | 8 | 36 | 22.2% | 23 | 46 | 50.0% | 46 | 116 | 162 | 54 | 24 | 42 | 36 | 78 | 221 |
Max Min
NBA Alltime Leaders
Games Played
Robert Parish: 1,611Kareem Abdul-Jabbar: 1,560
Vince Carter: 1,541
Dirk Nowitzki: 1,522
John Stockton: 1,504
Points
LeBron James: 40,474Kareem Abdul-Jabbar: 38,387
Karl Malone: 36,928
Kobe Bryant: 33,643
Michael Jordan: 32,292
Steals
John Stockton: 3,265Jason Kidd: 2,684
Chris Paul: 2,614
Michael Jordan: 2,514
Gary Payton: 2,445
Free Throws Made
Karl Malone: 9,787Moses Malone: 8,531
LeBron James: 8,390
Kobe Bryant: 8,378
Oscar Robertson: 7,694