Joe Johnson Stats: NBA Career

In the world of basketball, there are players who come and go, leaving their mark on the sport and etching their names in the annals of NBA history. One such player who has left a lasting impact on the game is Joe Johnson. With a career spanning over two decades, Johnson's journey through the NBA has been nothing short of remarkable.
Joe Johnson, a versatile player known for his scoring prowess and clutch performances, has played for seven different teams in the NBA. His career began in the 200...1-02 season with the Boston Celtics, where he made his debut at the young age of 21. From there, he went on to showcase his skills with the Phoenix Suns, Atlanta Hawks, Brooklyn Nets, Miami Heat, Utah Jazz, and finally, the Houston Rockets. Johnson's basketball odyssey took him across the United States, from Massachusetts to Arizona, Georgia, New York, Florida, Utah, and Texas.
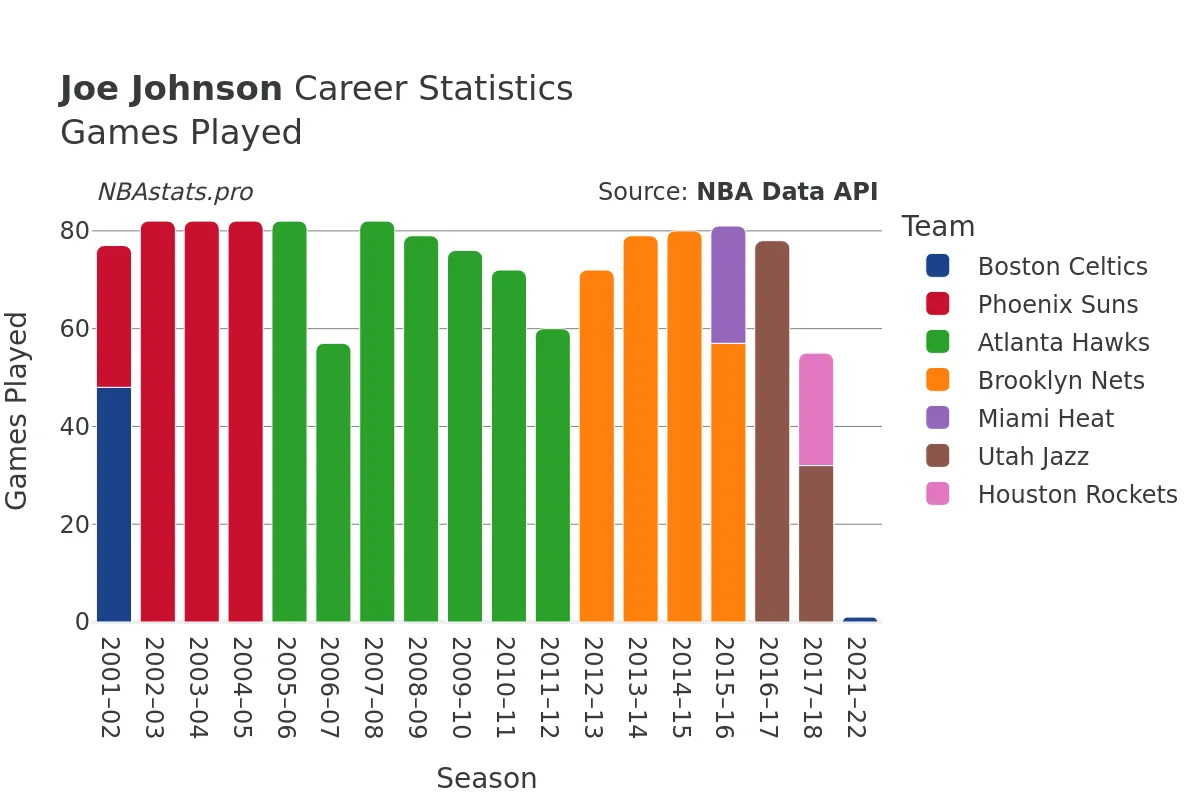
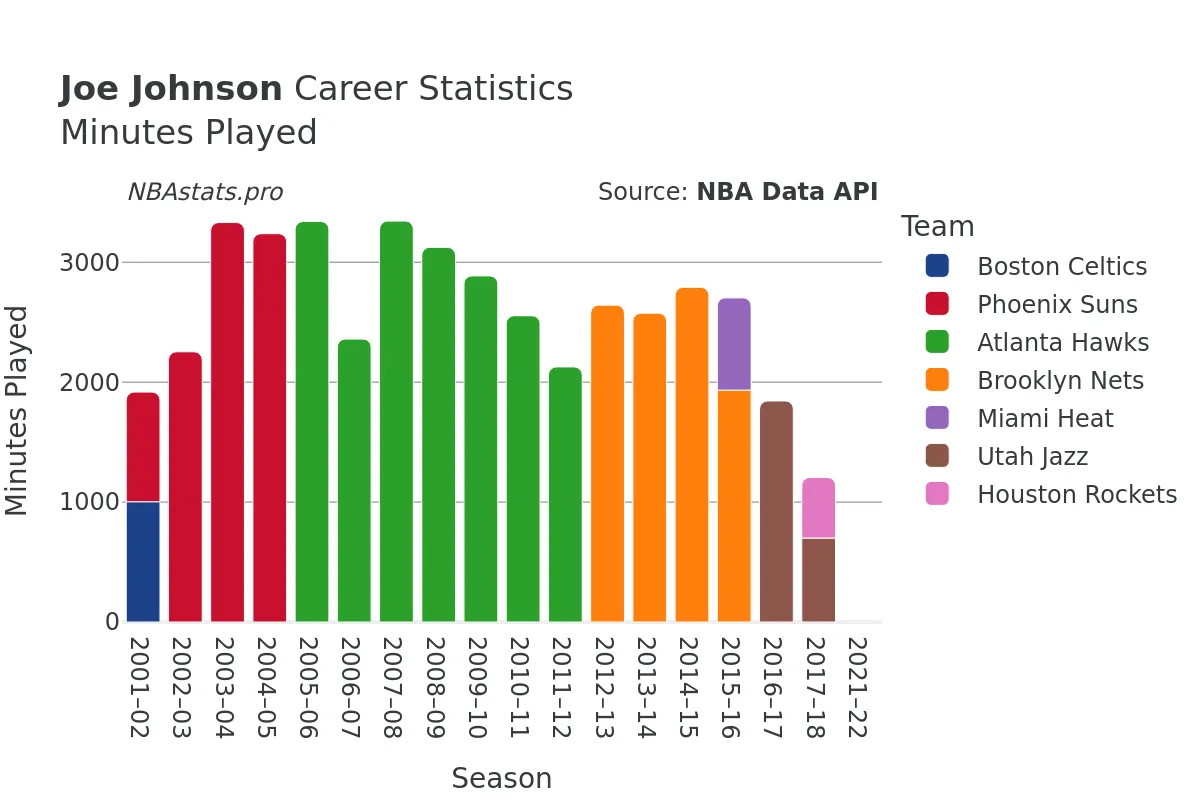
Over the course of his illustrious career, Joe Johnson played a total of 1490 games, amassing an incredible 50,058 minutes on the court. His offensive prowess was evident in his impressive goal statistics, with 8,597 successful field goals out of 19,523 attempts, giving him a shooting percentage of 44%. Additionally, Johnson was deadly from the free-throw line, making 2,982 out of 3,708 attempts, showcasing his consistency and reliability under pressure.
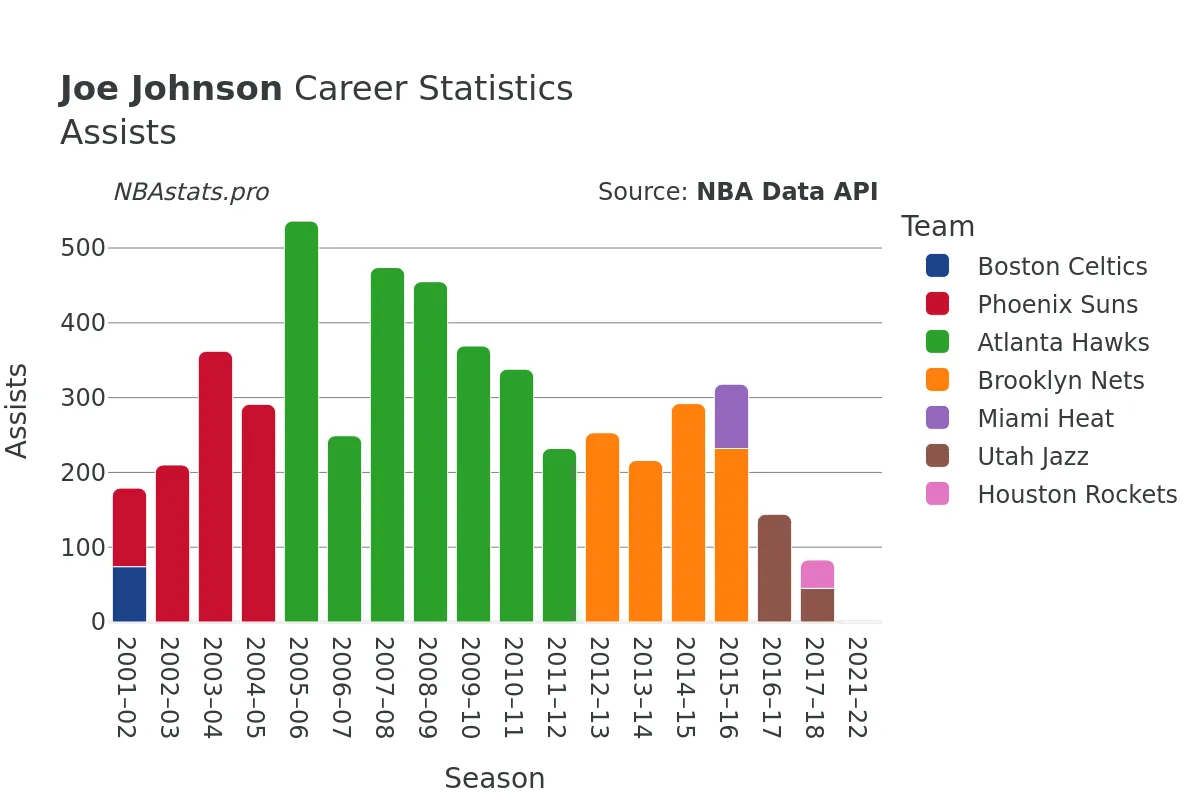
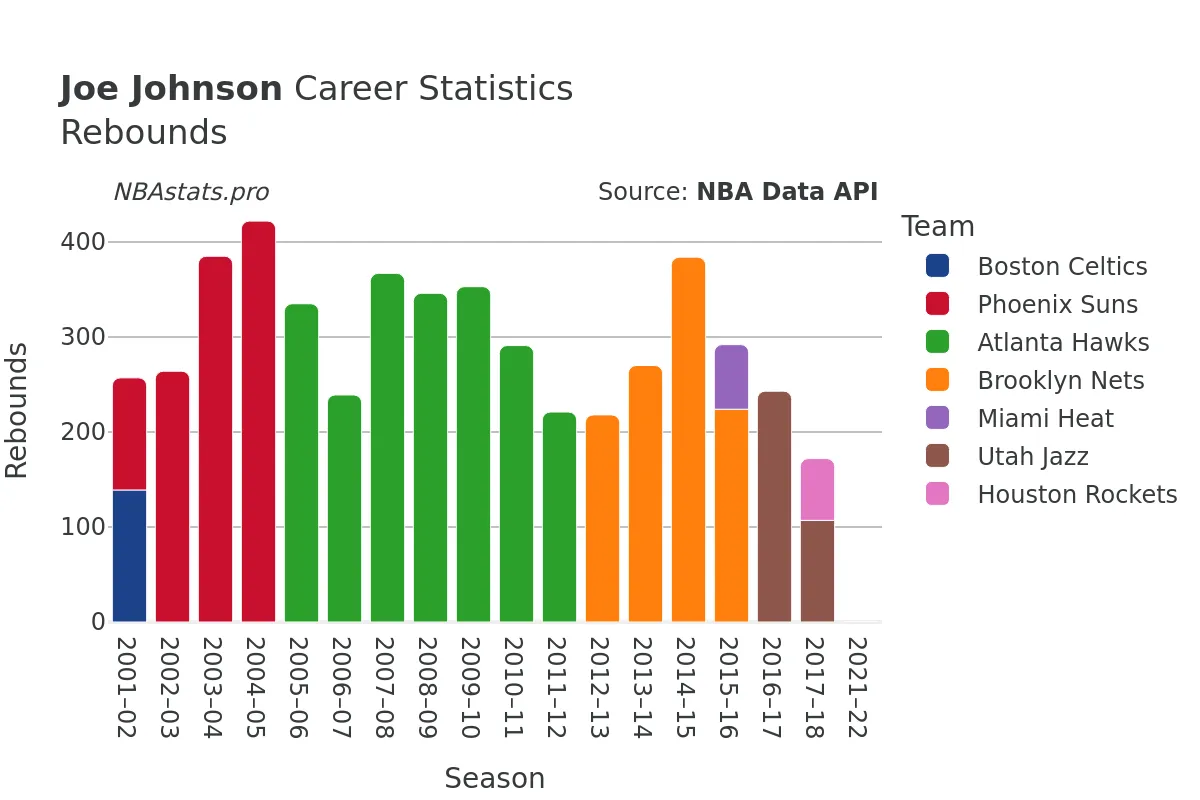
Not just a scoring machine, Johnson was also a force to be reckoned with on the boards, tallying a total of 5,780 rebounds throughout his career. His defensive presence was felt with 4,575 defensive rebounds and 1,205 offensive rebounds, highlighting his ability to crash the boards on both ends of the court. In addition to his rebounding skills, Johnson was a skilled playmaker, racking up 5,581 assists and demonstrating his ability to create scoring opportunities for his teammates.
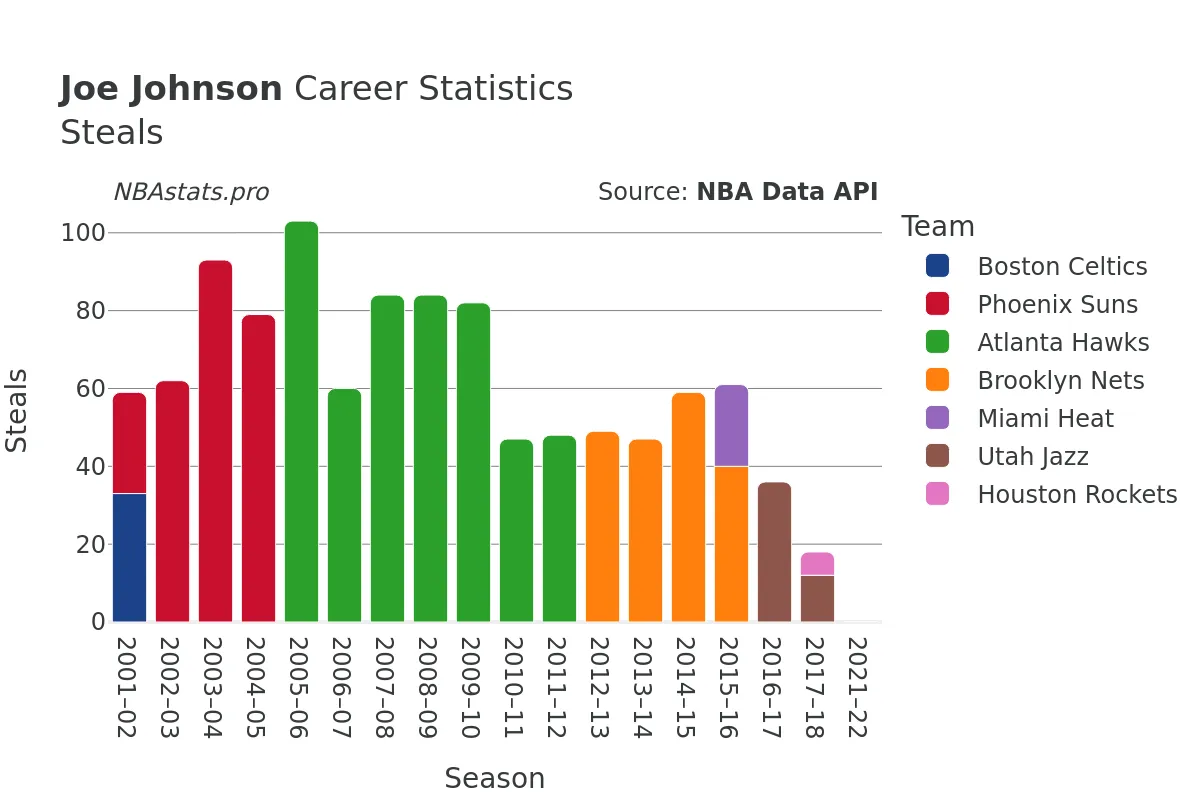
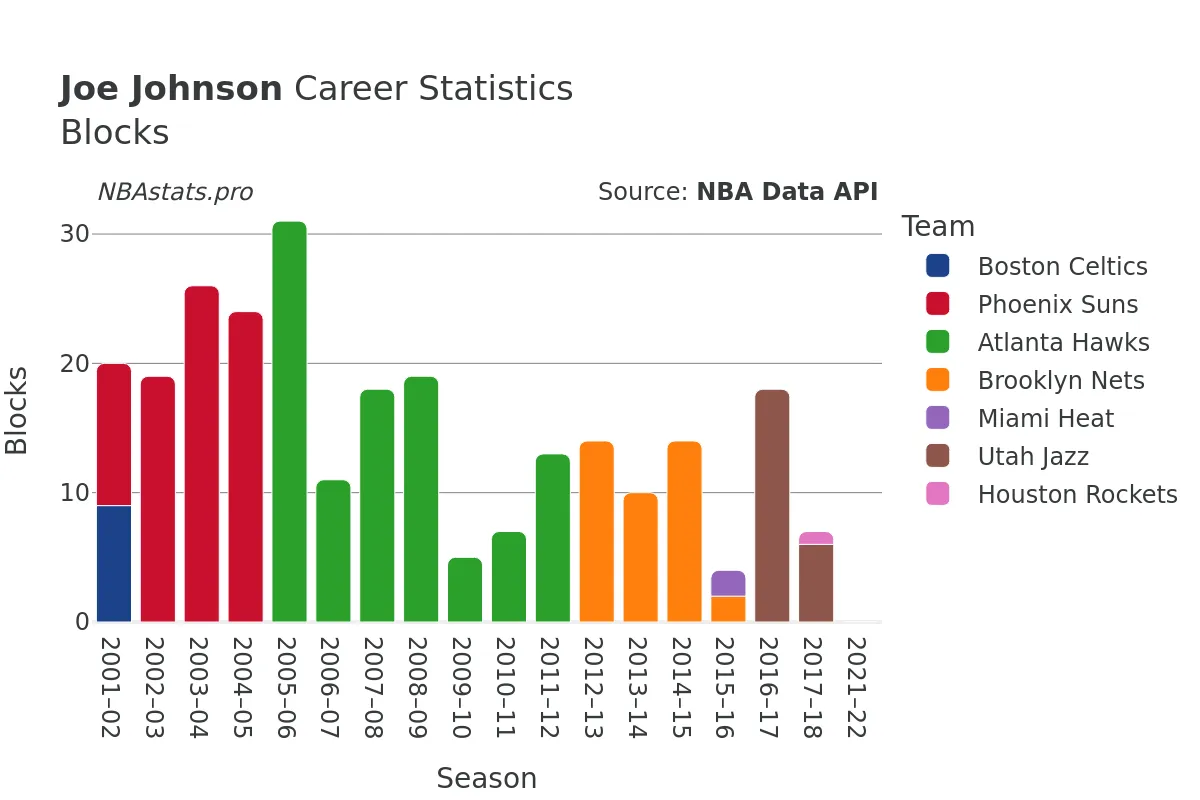
On the defensive end, Joe Johnson was a menace, recording 1,209 steals and 291 blocks in his career, showcasing his ability to disrupt opponents and protect the rim when needed. His well-rounded game and versatility on both ends of the court made him a valuable asset to any team he played for.
As a scorer, Johnson was known for his smooth shooting stroke, crafty footwork, and ability to create his shot in clutch moments. His offensive repertoire was vast, with the ability to score from beyond the arc, mid-range, and around the basket with equal ease. Whether it was draining a game-winning three-pointer or driving to the hoop for a crucial bucket, Johnson was a player who thrived under pressure and delivered when it mattered most.
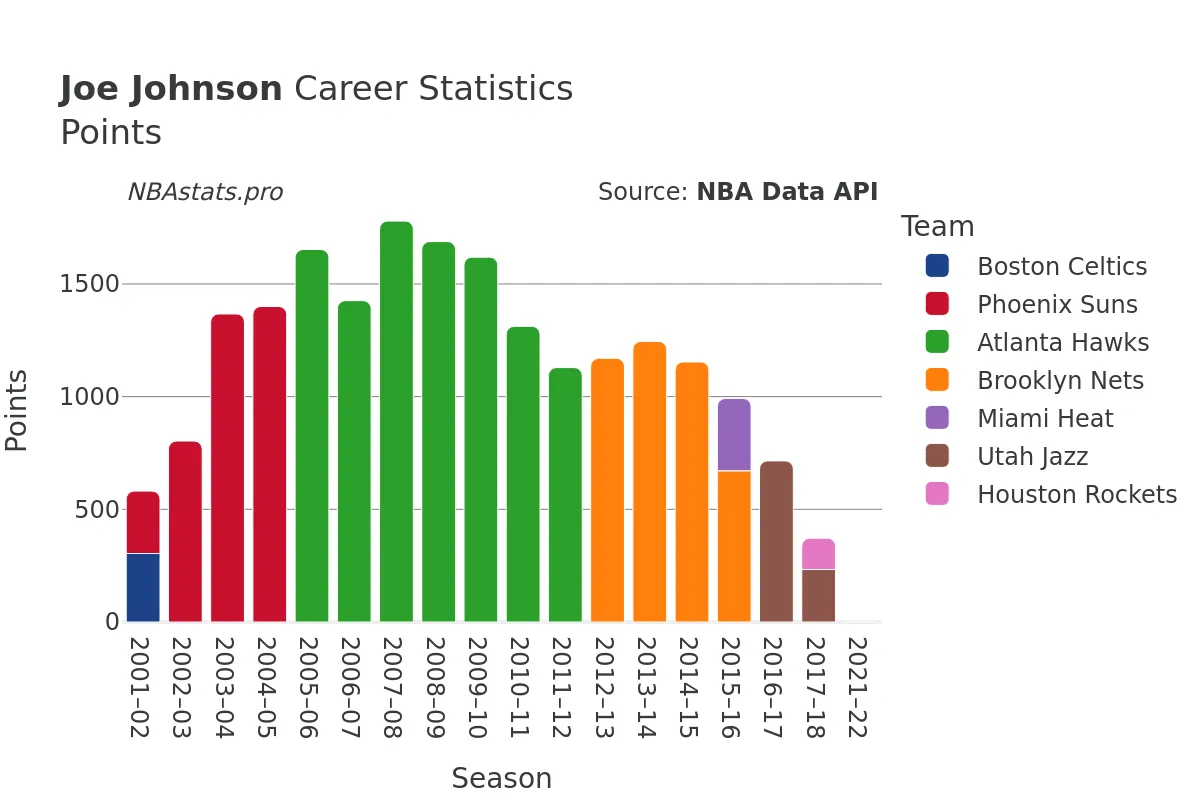
With a career total of 22,352 points, Joe Johnson solidified his status as one of the elite scorers in NBA history. His scoring ability, coupled with his all-around game and basketball IQ, earned him the respect of fans, teammates, and opponents alike.
Although Joe Johnson may no longer be active on the court, his legacy as a player will forever be remembered. His impact on the game of basketball transcends statistics and accolades, encompassing the intangibles that make a player truly great.
For a deeper dive into Joe Johnson's career statistics and achievements, feel free to explore the charts and data on this profile page. Let the numbers tell the story of a player who etched his name in the annals of NBA history with his skill, tenacity, and love for the game.
Read more
Games Played
Points
Assists
Rebounds
Steals
Minutes Played
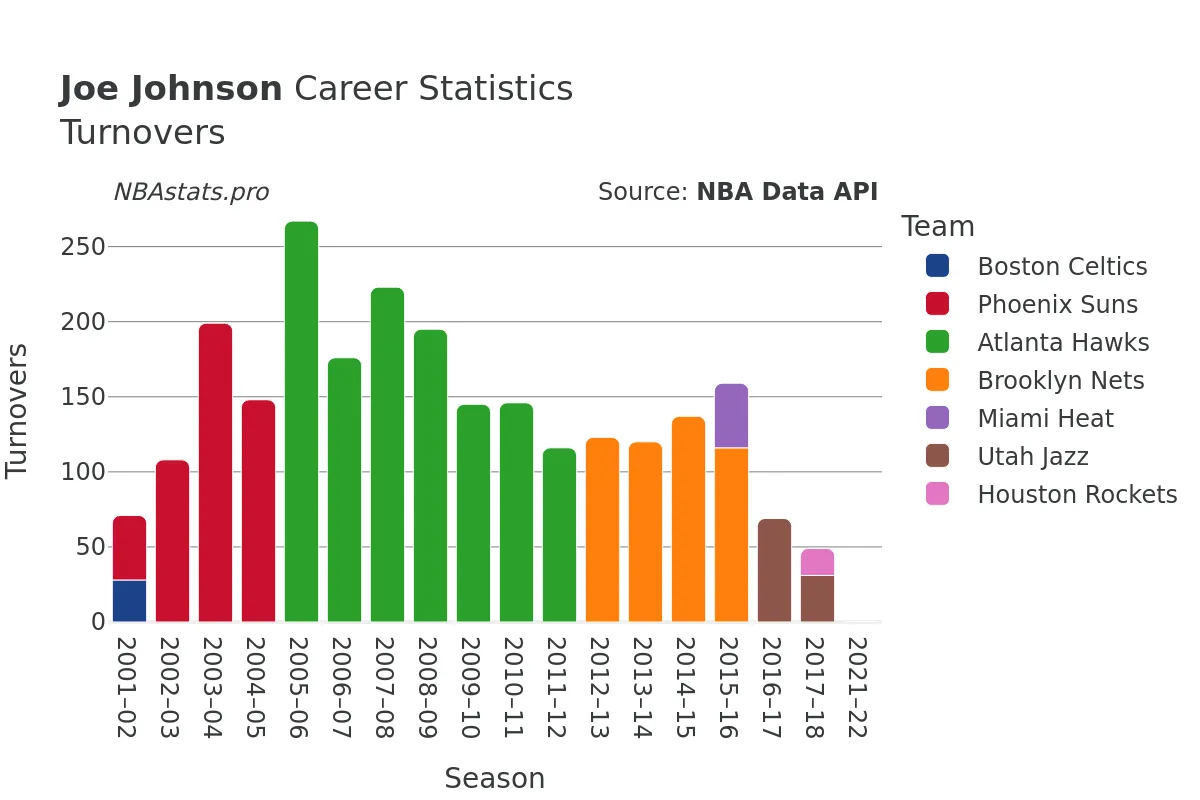
Turnovers
Blocks
Joe Johnson Career Stats Table
| SEASON | TEAM | AGE | GP | GS | MIN | FGM | FGA | FG % | FG3M | FG3A | FG3 % | FTM | FTA | FT % | OREB | DREB | REB | AST | STL | BLK | TOV | PF | PTS | |
|---|---|---|---|---|---|---|---|---|---|---|---|---|---|---|---|---|---|---|---|---|---|---|---|---|
| 1 | 2001-02 | BOS | 21 | 48 | 33 | 1,003 | 130 | 296 | 43.9% | 24 | 88 | 27.3% | 20 | 26 | 76.9% | 40 | 99 | 139 | 74 | 33 | 9 | 28 | 59 | 304 |
| 2 | 2001-02 | PHX | 21 | 29 | 27 | 914 | 121 | 288 | 42.0% | 14 | 42 | 33.3% | 21 | 27 | 77.8% | 35 | 83 | 118 | 105 | 26 | 11 | 43 | 55 | 277 |
| 3 | 2001-02 | TOT | 21 | 77 | 60 | 1,917 | 251 | 584 | 43.0% | 38 | 130 | 29.2% | 41 | 53 | 77.4% | 75 | 182 | 257 | 179 | 59 | 20 | 71 | 114 | 581 |
| 4 | 2002-03 | PHX | 22 | 82 | 34 | 2,253 | 316 | 796 | 39.7% | 75 | 205 | 36.6% | 96 | 124 | 77.4% | 57 | 207 | 264 | 210 | 62 | 19 | 108 | 143 | 803 |
| 5 | 2003-04 | PHX | 23 | 82 | 77 | 3,331 | 555 | 1,291 | 43.0% | 83 | 272 | 30.5% | 174 | 232 | 75.0% | 80 | 305 | 385 | 362 | 93 | 26 | 199 | 177 | 1,367 |
| 6 | 2004-05 | PHX | 24 | 82 | 82 | 3,238 | 544 | 1,179 | 46.1% | 177 | 370 | 47.8% | 135 | 180 | 75.0% | 120 | 302 | 422 | 291 | 79 | 24 | 148 | 167 | 1,400 |
| 7 | 2005-06 | ATL | 25 | 82 | 82 | 3,340 | 632 | 1,395 | 45.3% | 128 | 360 | 35.6% | 261 | 330 | 79.1% | 98 | 237 | 335 | 536 | 103 | 31 | 267 | 187 | 1,653 |
| 8 | 2006-07 | ATL | 26 | 57 | 57 | 2,359 | 536 | 1,139 | 47.1% | 119 | 312 | 38.1% | 235 | 314 | 74.8% | 53 | 186 | 239 | 249 | 60 | 11 | 176 | 115 | 1,426 |
| 9 | 2007-08 | ATL | 27 | 82 | 82 | 3,343 | 647 | 1,497 | 43.2% | 169 | 444 | 38.1% | 316 | 379 | 83.4% | 83 | 284 | 367 | 474 | 84 | 18 | 223 | 168 | 1,779 |
| 10 | 2008-09 | ATL | 28 | 79 | 79 | 3,124 | 620 | 1,420 | 43.7% | 149 | 414 | 36.0% | 299 | 362 | 82.6% | 65 | 281 | 346 | 455 | 84 | 19 | 195 | 176 | 1,688 |
| 11 | 2009-10 | ATL | 29 | 76 | 76 | 2,886 | 635 | 1,386 | 45.8% | 129 | 350 | 36.9% | 220 | 269 | 81.8% | 74 | 279 | 353 | 369 | 82 | 5 | 145 | 145 | 1,619 |
| 12 | 2010-11 | ATL | 30 | 72 | 72 | 2,554 | 514 | 1,161 | 44.3% | 89 | 300 | 29.7% | 195 | 243 | 80.2% | 59 | 232 | 291 | 338 | 47 | 7 | 146 | 131 | 1,312 |
| 13 | 2011-12 | ATL | 31 | 60 | 60 | 2,127 | 423 | 931 | 45.4% | 125 | 322 | 38.8% | 158 | 186 | 84.9% | 53 | 168 | 221 | 232 | 48 | 13 | 116 | 75 | 1,129 |
| 14 | 2012-13 | BKN | 32 | 72 | 72 | 2,642 | 445 | 1,052 | 42.3% | 148 | 395 | 37.5% | 132 | 161 | 82.0% | 53 | 165 | 218 | 253 | 49 | 14 | 123 | 99 | 1,170 |
| 15 | 2013-14 | BKN | 33 | 79 | 79 | 2,575 | 462 | 1,018 | 45.4% | 162 | 404 | 40.1% | 159 | 195 | 81.5% | 48 | 222 | 270 | 216 | 47 | 10 | 120 | 129 | 1,245 |
| 16 | 2014-15 | BKN | 34 | 80 | 80 | 2,791 | 446 | 1,025 | 43.5% | 121 | 337 | 35.9% | 141 | 176 | 80.1% | 53 | 331 | 384 | 292 | 59 | 14 | 137 | 120 | 1,154 |
| 17 | 2015-16 | BKN | 35 | 57 | 57 | 1,934 | 247 | 608 | 40.6% | 85 | 229 | 37.1% | 92 | 108 | 85.2% | 34 | 190 | 224 | 232 | 40 | 2 | 116 | 100 | 671 |
| 18 | 2015-16 | MIA | 35 | 24 | 24 | 769 | 130 | 251 | 51.8% | 35 | 84 | 41.7% | 26 | 34 | 76.5% | 15 | 53 | 68 | 86 | 21 | 2 | 43 | 46 | 321 |
| 19 | 2015-16 | TOT | 35 | 81 | 81 | 2,703 | 377 | 859 | 43.9% | 120 | 313 | 38.3% | 118 | 142 | 83.1% | 49 | 243 | 292 | 318 | 61 | 4 | 159 | 146 | 992 |
| 20 | 2016-17 | UTA | 36 | 78 | 14 | 1,843 | 273 | 626 | 43.6% | 106 | 258 | 41.1% | 63 | 77 | 81.8% | 33 | 210 | 243 | 144 | 36 | 18 | 69 | 93 | 715 |
| 21 | 2017-18 | UTA | 37 | 32 | 3 | 700 | 95 | 226 | 42.0% | 23 | 84 | 27.4% | 20 | 24 | 83.3% | 12 | 95 | 107 | 45 | 12 | 6 | 31 | 32 | 233 |
| 22 | 2017-18 | HOU | 37 | 23 | 1 | 505 | 51 | 134 | 38.1% | 17 | 61 | 27.9% | 20 | 21 | 95.2% | 2 | 63 | 65 | 38 | 6 | 1 | 18 | 35 | 139 |
| 23 | 2017-18 | TOT | 37 | 55 | 4 | 1,205 | 146 | 360 | 40.6% | 40 | 145 | 27.6% | 40 | 45 | 88.9% | 14 | 158 | 172 | 83 | 18 | 7 | 49 | 67 | 372 |
| 24 | 2021-22 | BOS | 41 | 1 | 0 | 2 | 1 | 1 | 100.0% | 0 | 0 | 0.0% | 0 | 0 | 0.0% | 0 | 0 | 0 | 0 | 0 | 0 | 0 | 0 | 2 |
Max Min
NBA Alltime Leaders
Games Played
Robert Parish: 1,611Kareem Abdul-Jabbar: 1,560
Vince Carter: 1,541
Dirk Nowitzki: 1,522
John Stockton: 1,504
Points
LeBron James: 40,474Kareem Abdul-Jabbar: 38,387
Karl Malone: 36,928
Kobe Bryant: 33,643
Michael Jordan: 32,292
Steals
John Stockton: 3,265Jason Kidd: 2,684
Chris Paul: 2,614
Michael Jordan: 2,514
Gary Payton: 2,445
Free Throws Made
Karl Malone: 9,787Moses Malone: 8,531
LeBron James: 8,390
Kobe Bryant: 8,378
Oscar Robertson: 7,694