Joe Ingles Stats: NBA Career

**Joe Ingles: The Versatile Forward Making an Impact on the Court**
When it comes to versatile players who bring a unique skill set to the court, Joe Ingles is a name that cannot be overlooked. With stints at the Utah Jazz, Milwaukee Bucks, and Orlando Magic, Ingles has showcased his talent and adaptability across multiple teams and cities, leaving a lasting impression wherever he goes. Let's dive into the numbers and explore what makes Joe Ingles an indispensable asset on the court.
**Early C...areer and Team Contributions**
Ingles began his NBA journey in the 2014-2015 season, starting with the Utah Jazz. Known for his sharpshooting and playmaking abilities, Ingles quickly made his mark on the team. Throughout his career, he has proven to be a reliable contributor both offensively and defensively, with a keen eye for creating opportunities for his teammates.
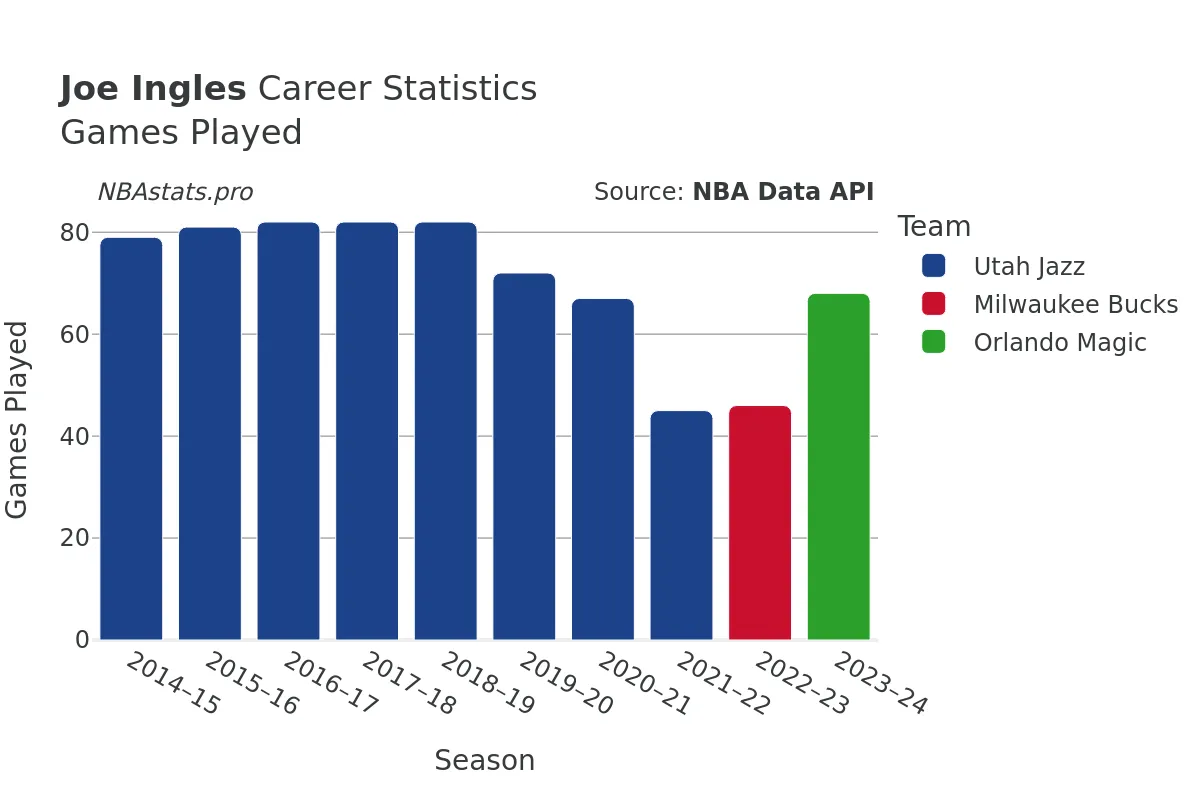
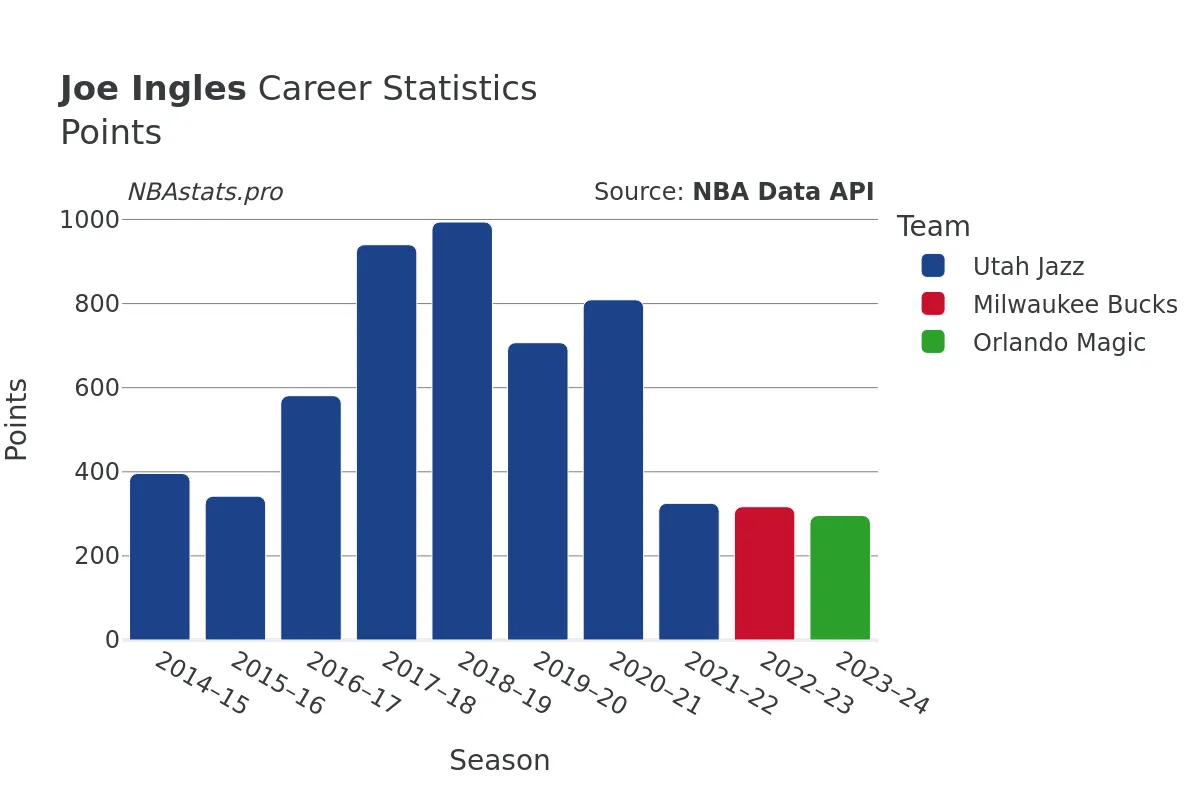
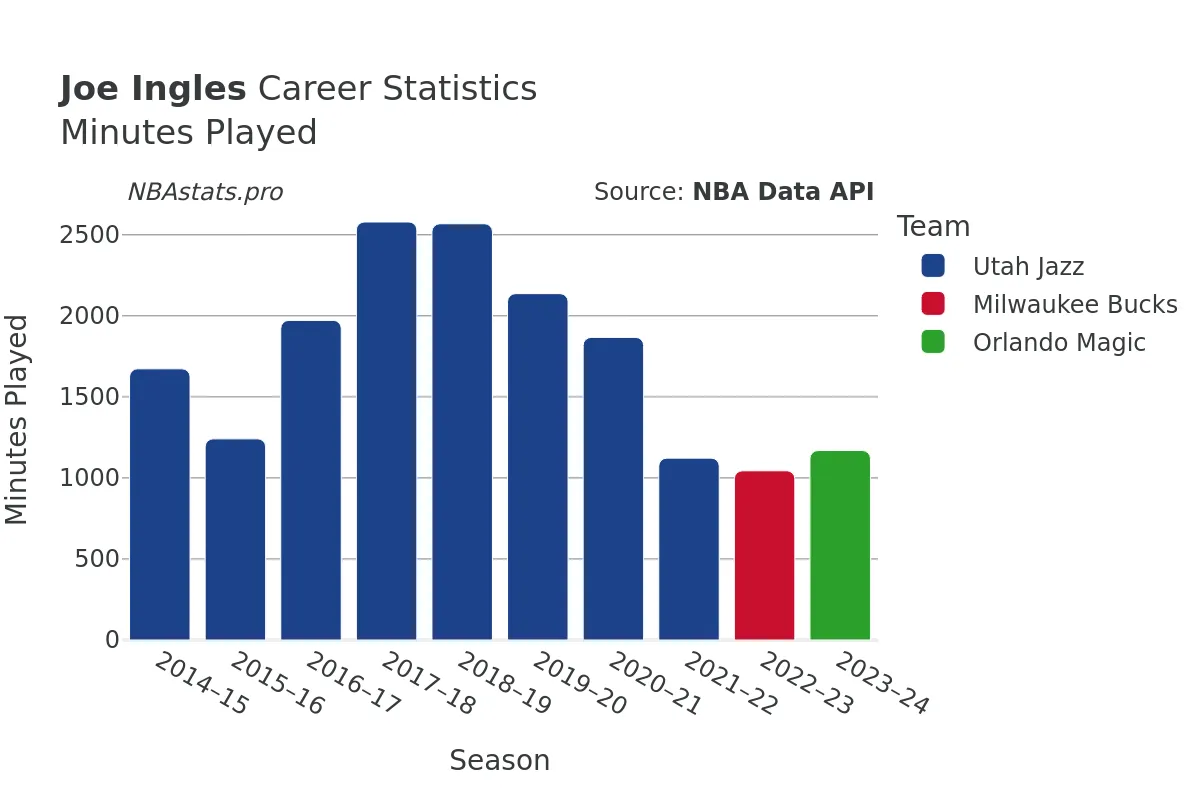
During his time with the Jazz, Ingles has been a consistent presence on the court, appearing in 704 games and racking up an impressive 17,372 minutes played. His scoring prowess is evident in his 2,012 goals made out of 4,491 attempts, showcasing his efficiency and accuracy when it comes to putting points on the board.
**Rebounding and Defensive Presence**
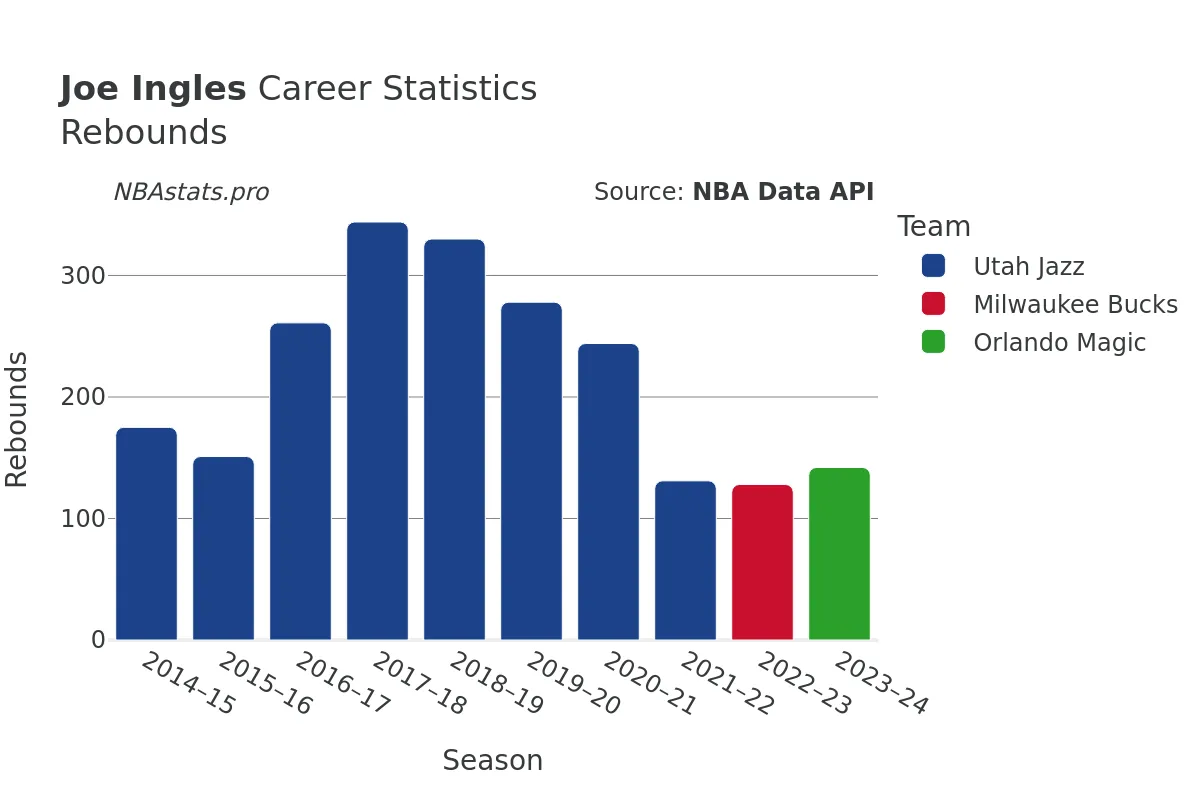
In addition to his scoring capabilities, Ingles is also a force to be reckoned with on the boards. With a total of 2,184 rebounds to his name, including 1,964 defensive rebounds and 220 offensive rebounds, Ingles proves to be a versatile player who can contribute in multiple facets of the game.
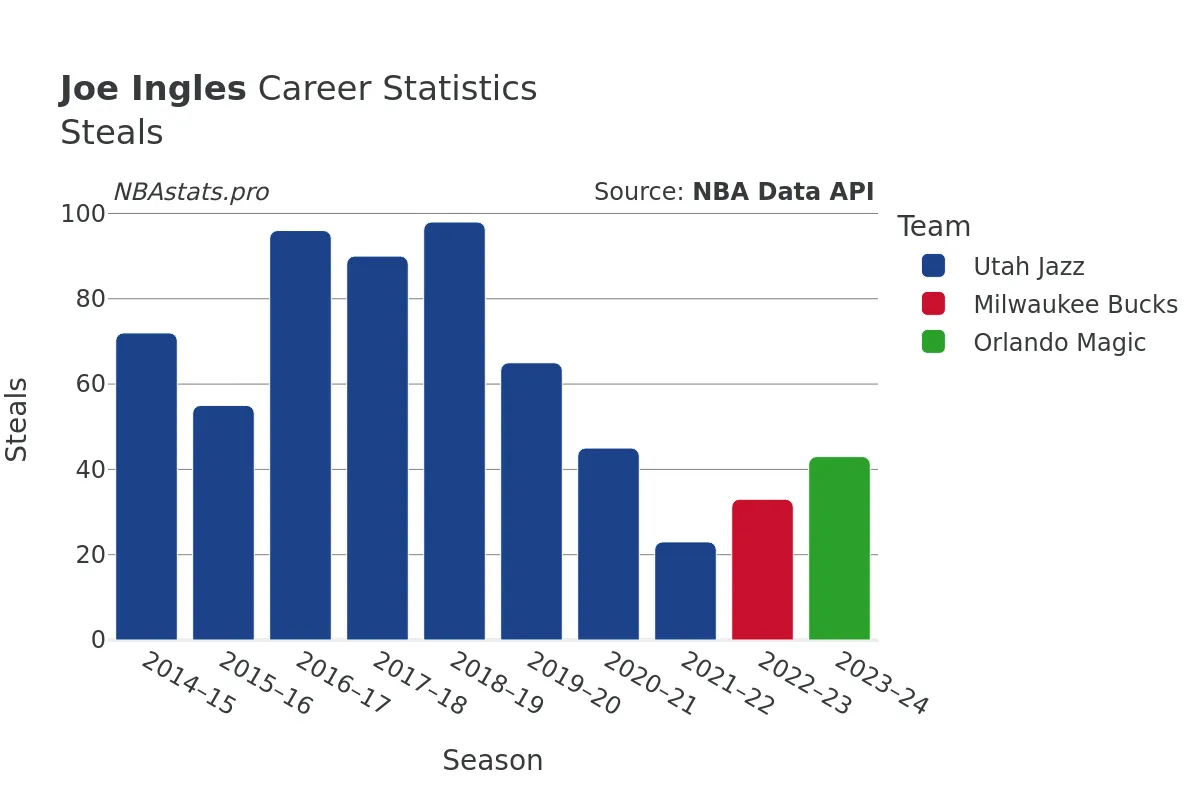
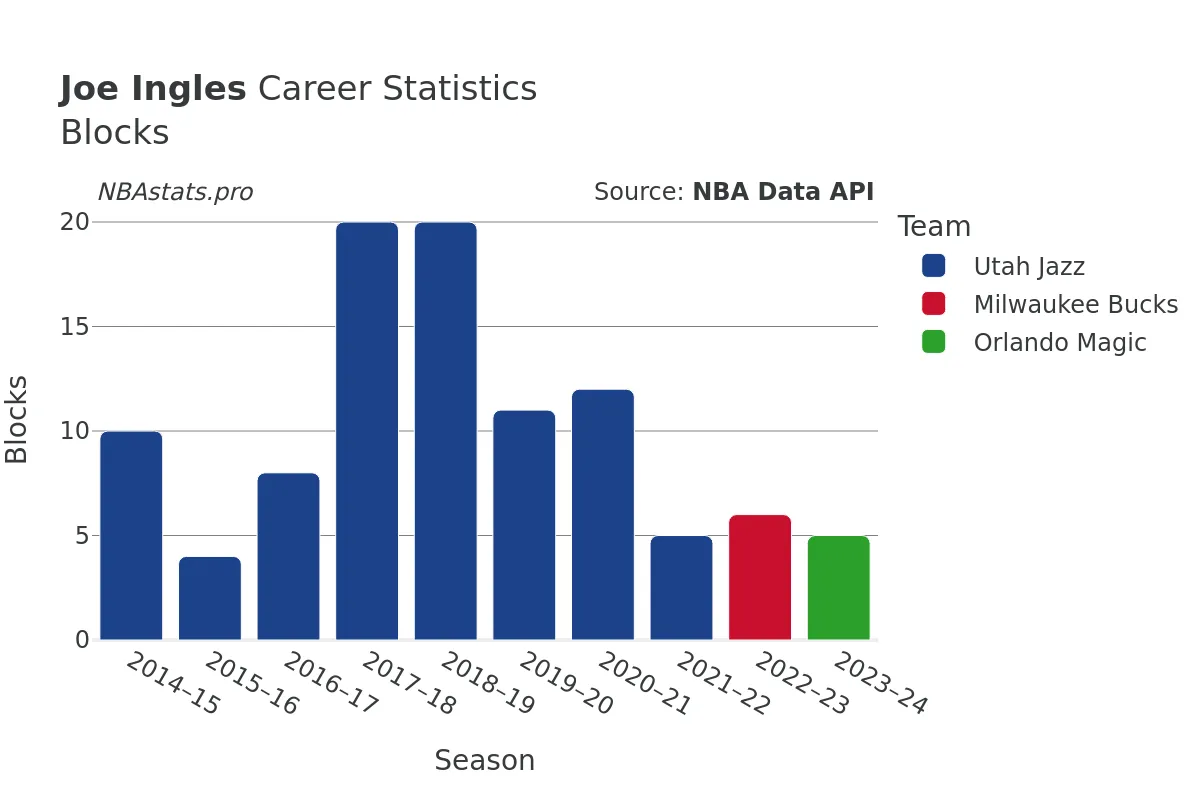
His defensive skills are further highlighted by his 620 steals and 101 blocks, demonstrating his ability to disrupt opponents and create turnovers. Ingles' tenacity and hustle on the defensive end make him a valuable asset for any team looking to shore up their defense and create scoring opportunities off turnovers.
**Playmaking and Team Leadership**
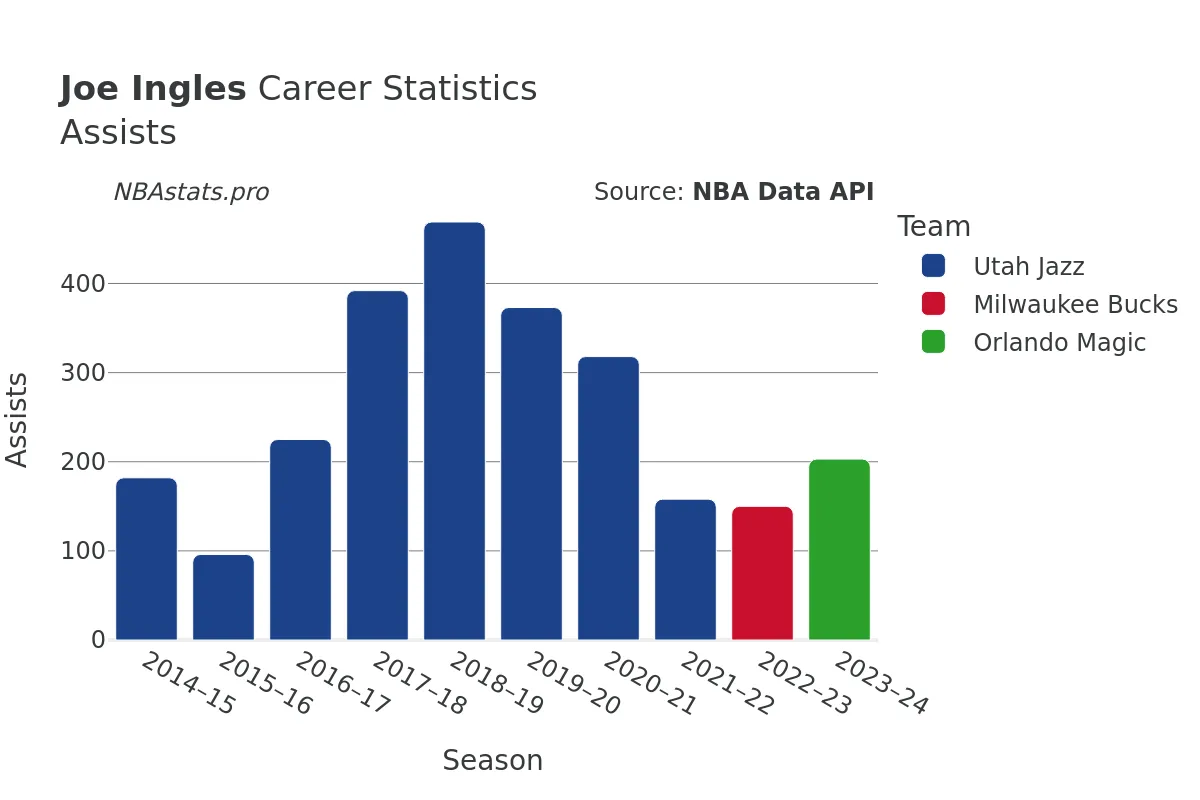
One of the standout qualities of Joe Ingles is his playmaking abilities and court vision. With 2,566 assists to his name, Ingles has a knack for finding his teammates in scoring positions and setting up plays that keep the offense flowing seamlessly. His unselfish play and high basketball IQ make him a natural leader on the court, someone his teammates can rely on to make the right decisions in crucial moments.
**Scoring Efficiency and Free Throw Prowess**
Ingles' scoring efficiency is reflected in his 44.8% field goal percentage, showcasing his ability to convert shots at a high rate and make the most of his scoring opportunities. Additionally, his free throw percentage is a testament to his composure under pressure, with a strong conversion rate from the charity stripe that makes him a reliable option in late-game situations.
**Conclusion**
Joe Ingles is more than just a basketball player; he is a versatile forward who brings a unique skill set and invaluable contributions to any team he plays for. With a well-rounded game that encompasses scoring, rebounding, playmaking, and defense, Ingles is a player who elevates the performance of those around him and makes a tangible impact on the court.
As you delve deeper into the stats and charts on Joe Ingles' profile page, you'll gain a greater appreciation for the nuances of his game and the versatility he brings to the table. Whether you're a fan of the Utah Jazz, Milwaukee Bucks, or Orlando Magic, one thing is certain – Joe Ingles is a player who leaves an indelible mark wherever he goes.
Read more
Games Played
Points
Assists
Rebounds
Steals
Minutes Played
Turnovers
Blocks
Joe Ingles Career Stats Table
| SEASON | TEAM | AGE | GP | GS | MIN | FGM | FGA | FG % | FG3M | FG3A | FG3 % | FTM | FTA | FT % | OREB | DREB | REB | AST | STL | BLK | TOV | PF | PTS | |
|---|---|---|---|---|---|---|---|---|---|---|---|---|---|---|---|---|---|---|---|---|---|---|---|---|
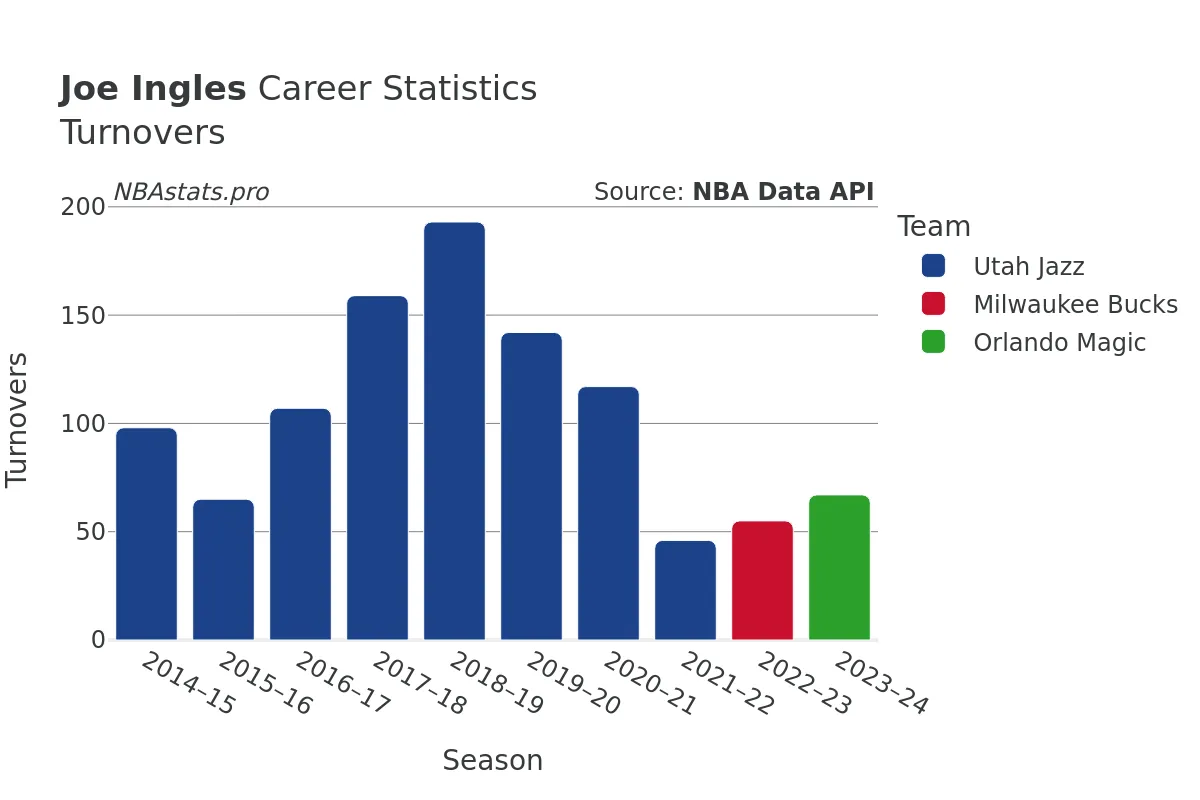
| 1 | 2014-15 | UTA | 27 | 79 | 32 | 1,673 | 147 | 354 | 41.5% | 72 | 202 | 35.6% | 30 | 40 | 75.0% | 22 | 153 | 175 | 182 | 72 | 10 | 98 | 124 | 396 |
| 2 | 2015-16 | UTA | 28 | 81 | 2 | 1,241 | 124 | 291 | 42.6% | 81 | 210 | 38.6% | 13 | 18 | 72.2% | 19 | 132 | 151 | 96 | 55 | 4 | 65 | 98 | 342 |
| 3 | 2016-17 | UTA | 29 | 82 | 26 | 1,972 | 204 | 451 | 45.2% | 123 | 279 | 44.1% | 50 | 68 | 73.5% | 23 | 238 | 261 | 225 | 96 | 8 | 107 | 163 | 581 |
| 4 | 2017-18 | UTA | 30 | 82 | 81 | 2,579 | 335 | 718 | 46.7% | 204 | 464 | 44.0% | 66 | 83 | 79.5% | 24 | 320 | 344 | 392 | 90 | 20 | 159 | 178 | 940 |
| 5 | 2018-19 | UTA | 31 | 82 | 82 | 2,568 | 359 | 802 | 44.8% | 189 | 483 | 39.1% | 87 | 123 | 70.7% | 35 | 295 | 330 | 469 | 98 | 20 | 193 | 180 | 994 |
| 6 | 2019-20 | UTA | 32 | 72 | 45 | 2,137 | 246 | 553 | 44.5% | 141 | 353 | 39.9% | 74 | 94 | 78.7% | 27 | 251 | 278 | 373 | 65 | 11 | 142 | 154 | 707 |
| 7 | 2020-21 | UTA | 33 | 67 | 30 | 1,867 | 275 | 562 | 48.9% | 183 | 406 | 45.1% | 76 | 90 | 84.4% | 27 | 217 | 244 | 318 | 45 | 12 | 117 | 120 | 809 |
| 8 | 2021-22 | UTA | 34 | 45 | 15 | 1,122 | 115 | 285 | 40.4% | 78 | 225 | 34.7% | 17 | 22 | 77.3% | 12 | 119 | 131 | 158 | 23 | 5 | 46 | 82 | 325 |
| 9 | 2022-23 | MIL | 35 | 46 | 0 | 1,044 | 108 | 248 | 43.5% | 83 | 203 | 40.9% | 18 | 21 | 85.7% | 13 | 115 | 128 | 150 | 33 | 6 | 55 | 74 | 317 |
| 10 | 2023-24 | ORL | 36 | 68 | 0 | 1,169 | 99 | 227 | 43.6% | 70 | 161 | 43.5% | 28 | 34 | 82.4% | 18 | 124 | 142 | 203 | 43 | 5 | 67 | 88 | 296 |
Max Min
NBA Alltime Leaders
Games Played
Robert Parish: 1,611Kareem Abdul-Jabbar: 1,560
Vince Carter: 1,541
Dirk Nowitzki: 1,522
John Stockton: 1,504
Points
LeBron James: 40,474Kareem Abdul-Jabbar: 38,387
Karl Malone: 36,928
Kobe Bryant: 33,643
Michael Jordan: 32,292
Steals
John Stockton: 3,265Jason Kidd: 2,684
Chris Paul: 2,614
Michael Jordan: 2,514
Gary Payton: 2,445
Free Throws Made
Karl Malone: 9,787Moses Malone: 8,531
LeBron James: 8,390
Kobe Bryant: 8,378
Oscar Robertson: 7,694