Jerry Reynolds Stats: NBA Career

***Getting to Know Jerry Reynolds: Analyzing the Numbers***
Jerry Reynolds, a seasoned NBA player who graced the courts for the Milwaukee Bucks, Oklahoma City Thunder, and Orlando Magic, left a mark in the basketball world during his career from 1985 to 1996. As we delve into the stats of this remarkable player, prepare to be intrigued by the in-depth analysis of his performance and impact on the teams he played for.
**Shooting Skills:** Reynolds, known for his sharpshooting abilities, attempt...ed an impressive 3399 goals during his career, making 1420 of these attempts. This equates to a field goal percentage of approximately 41.78%. While some may argue the importance of this statistic, it's undeniable that converting over 40% of shot attempts is a commendable feat in the competitive landscape of the NBA.
**Free Throw Expertise:** At the free-throw line, Reynolds showcased his precision and consistency. He attempted 1560 free throws and successfully made 1168 of them. With a free-throw percentage that surpasses the 75% benchmark, Reynolds proved to be a reliable asset when given the opportunity to score uncontested points.
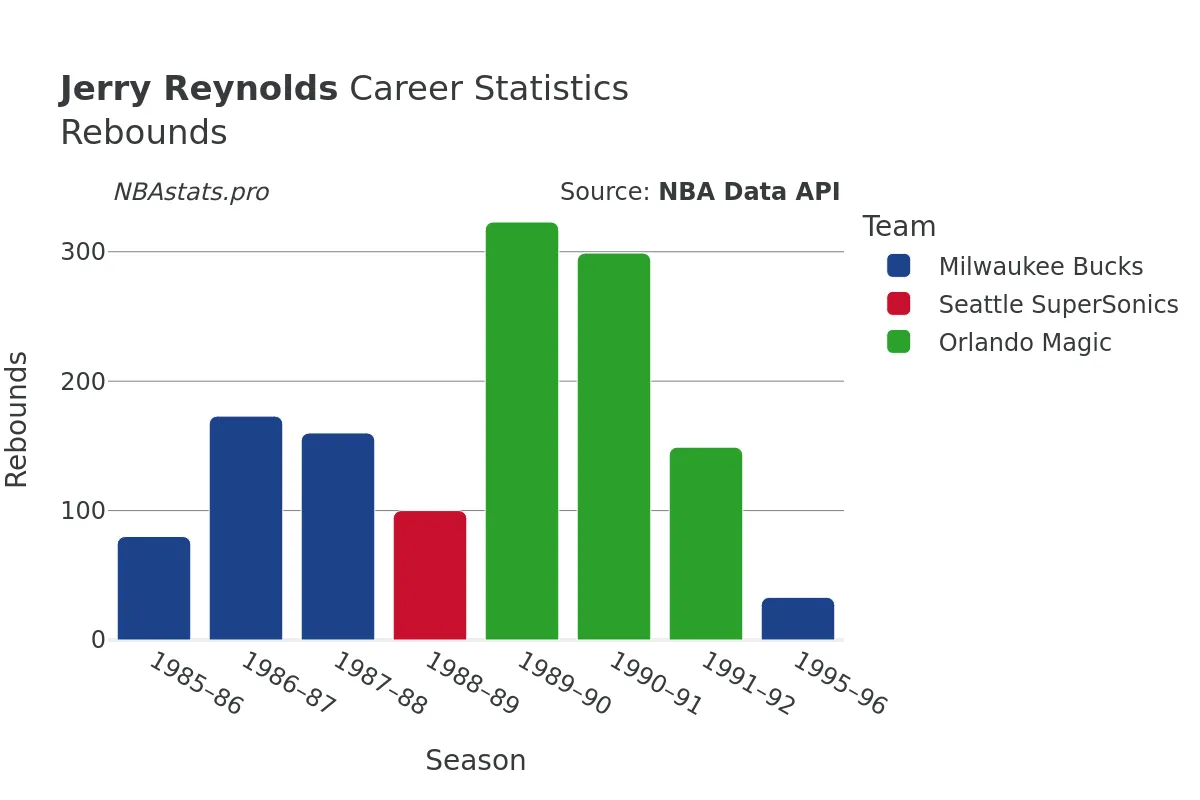
**Rebounding Prowess:** Reynolds's impact transcended scoring as he dominated the boards with 1317 rebounds throughout his career. Of these rebounds, 850 were on the defensive end, showcasing his defensive prowess and ability to thwart opponents' scoring attempts. His 467 offensive rebounds also underscore his tenacity in securing second-chance opportunities for his team.
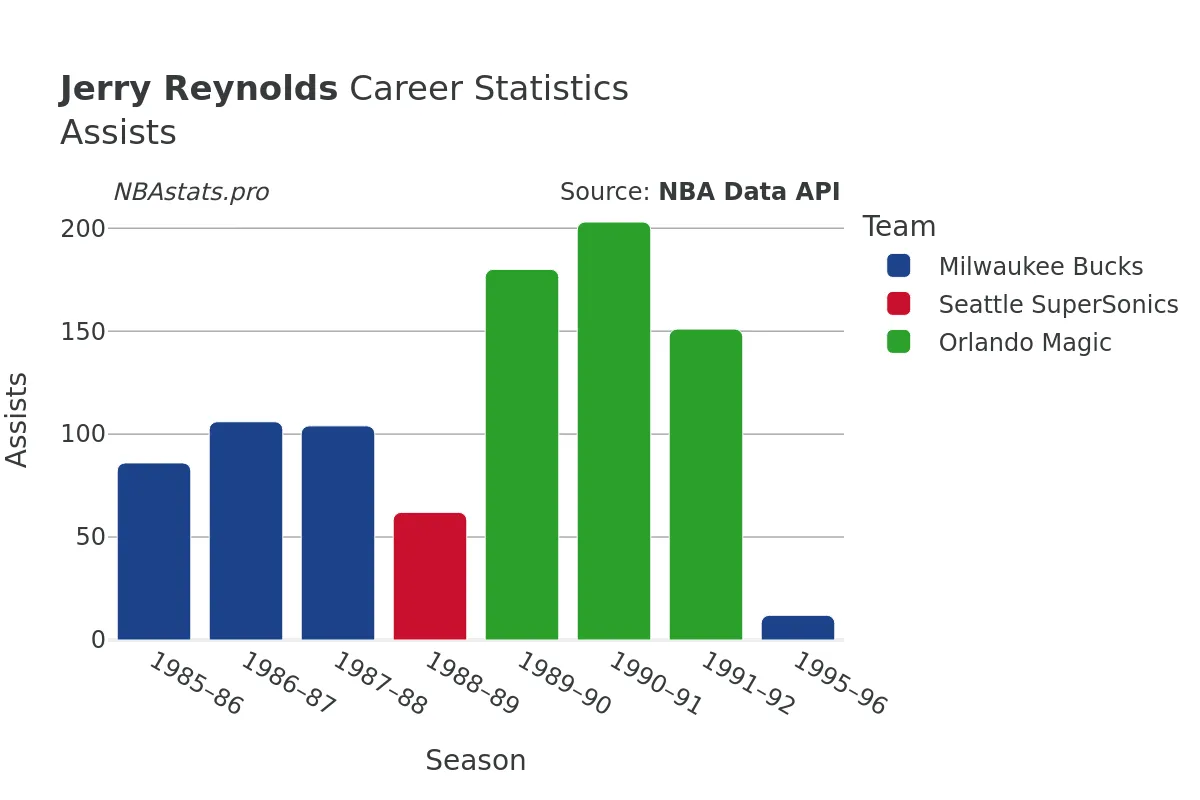
**Playmaking Abilities:** Beyond scoring and rebounding, Reynolds also displayed his aptitude for playmaking, amassing an impressive total of 904 assists. This proficiency in creating scoring opportunities for his teammates highlights his versatility on the court and his willingness to involve his fellow players in the game.
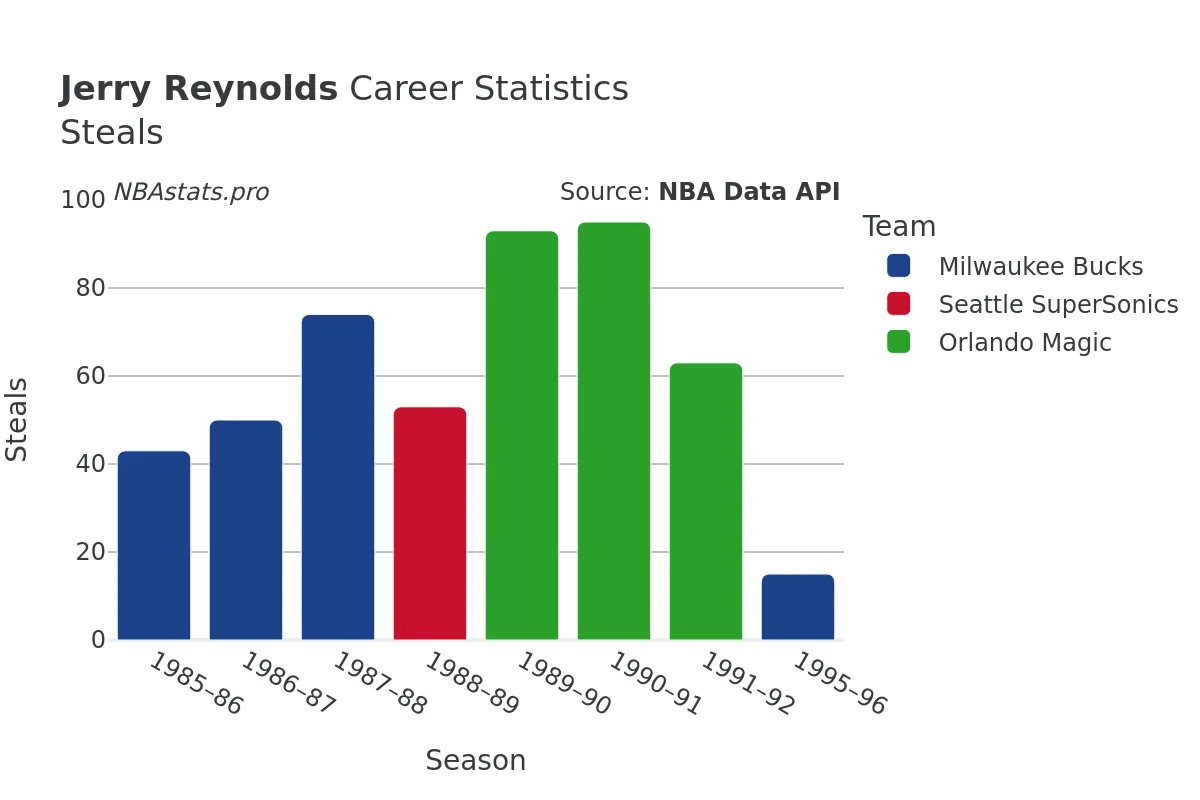
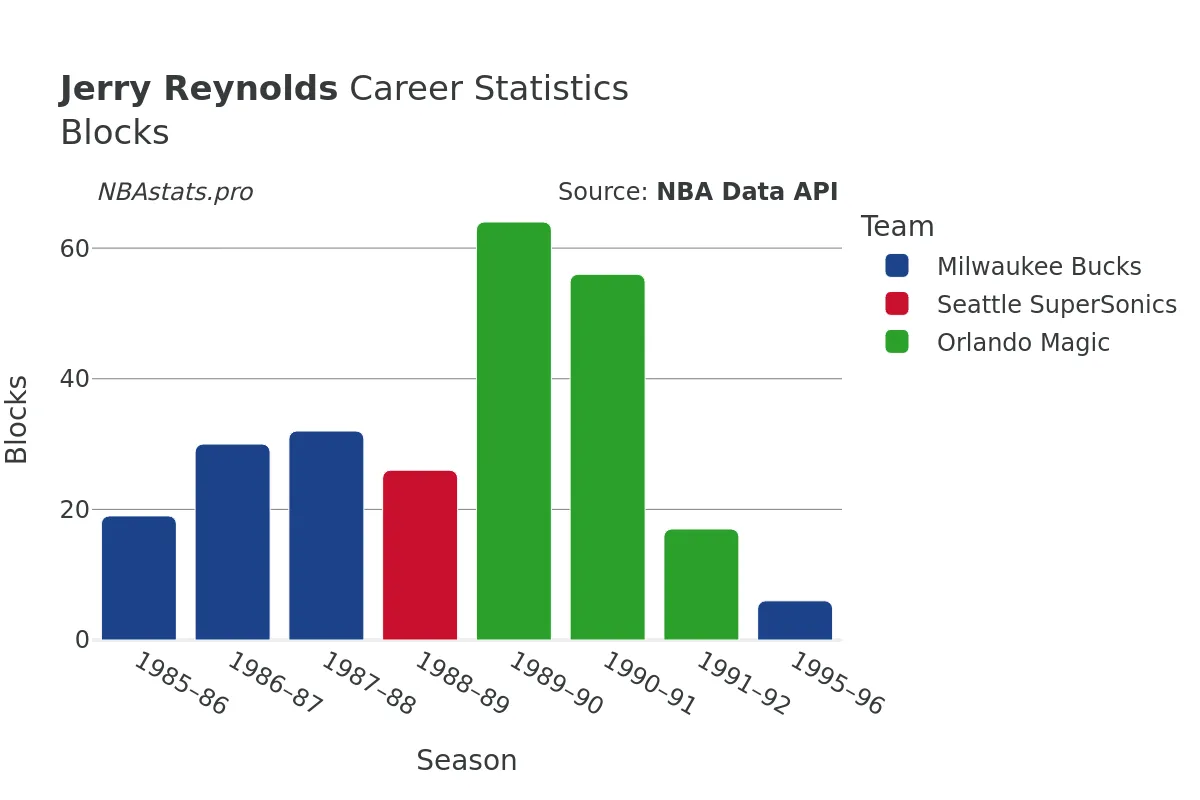
**Defensive Contributions:** On the defensive end, Reynolds was a force to be reckoned with, tallying 486 steals and 250 blocks during his career. These stats reflect his defensive acumen, agility, and ability to disrupt opponents' offensive plays, making him a well-rounded player who could impact the game on both sides of the court.
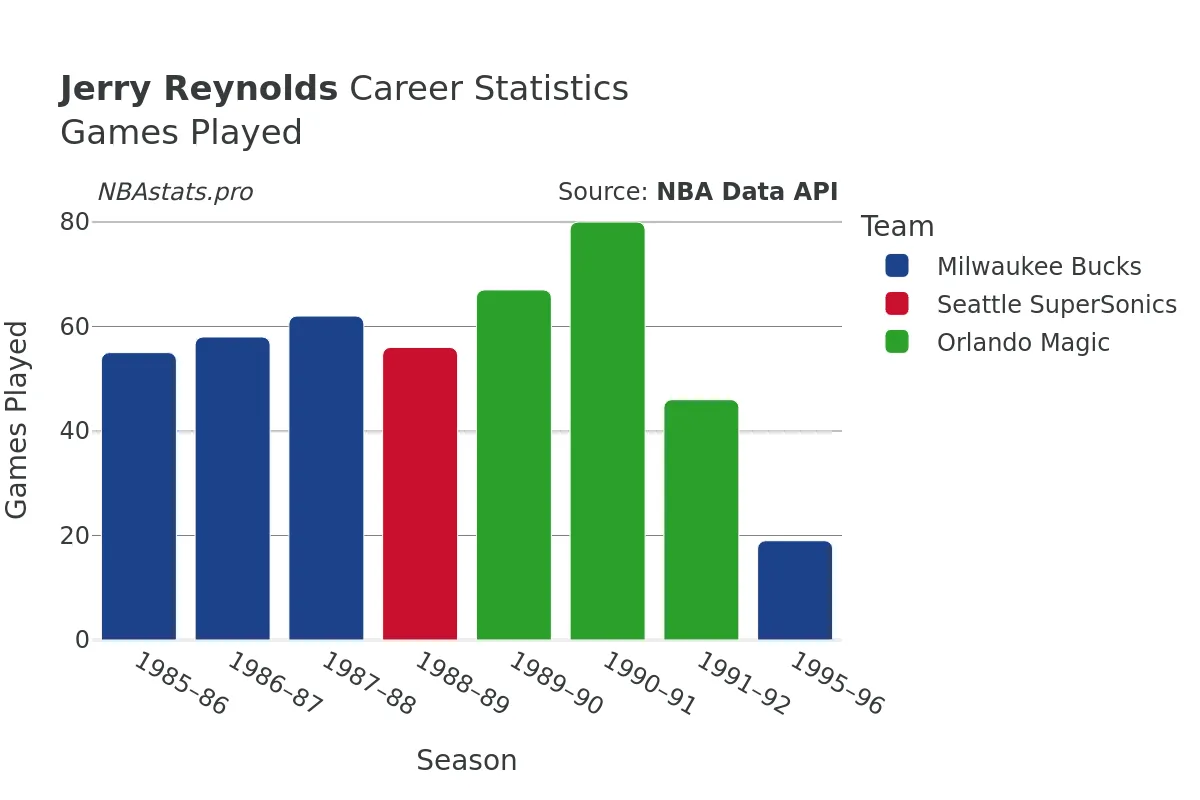
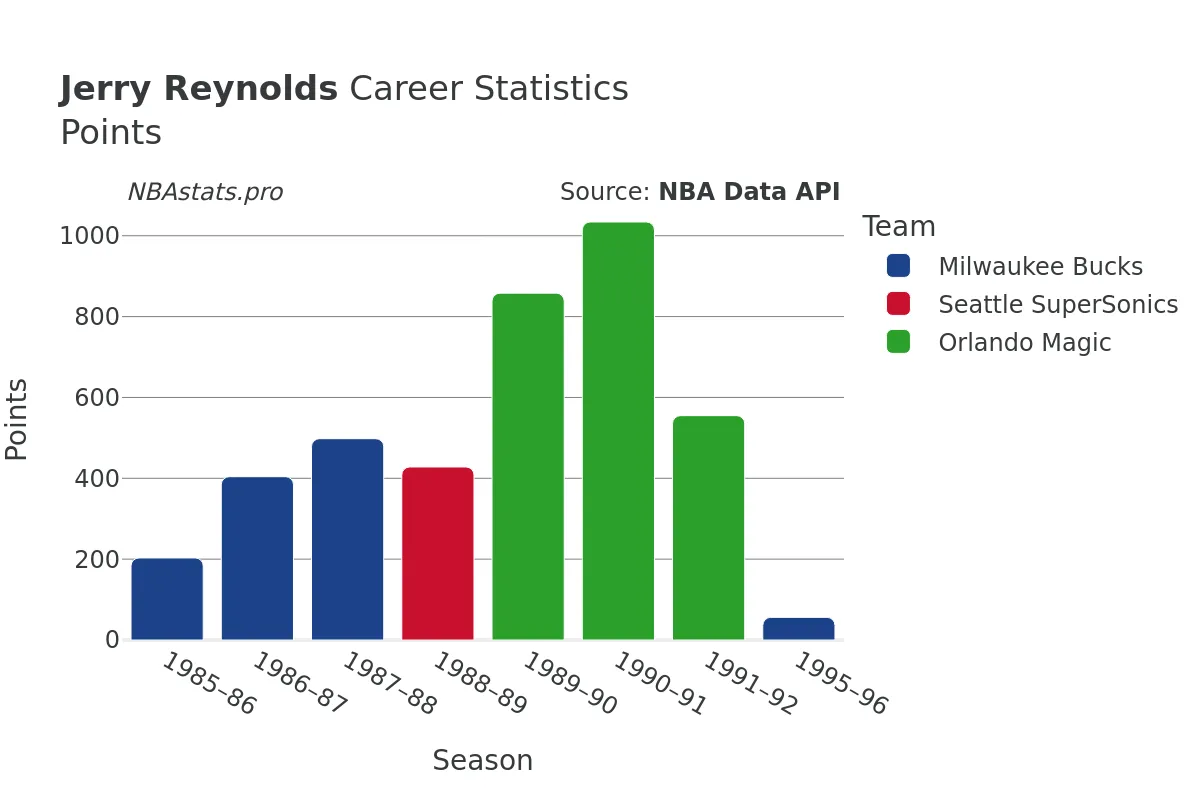
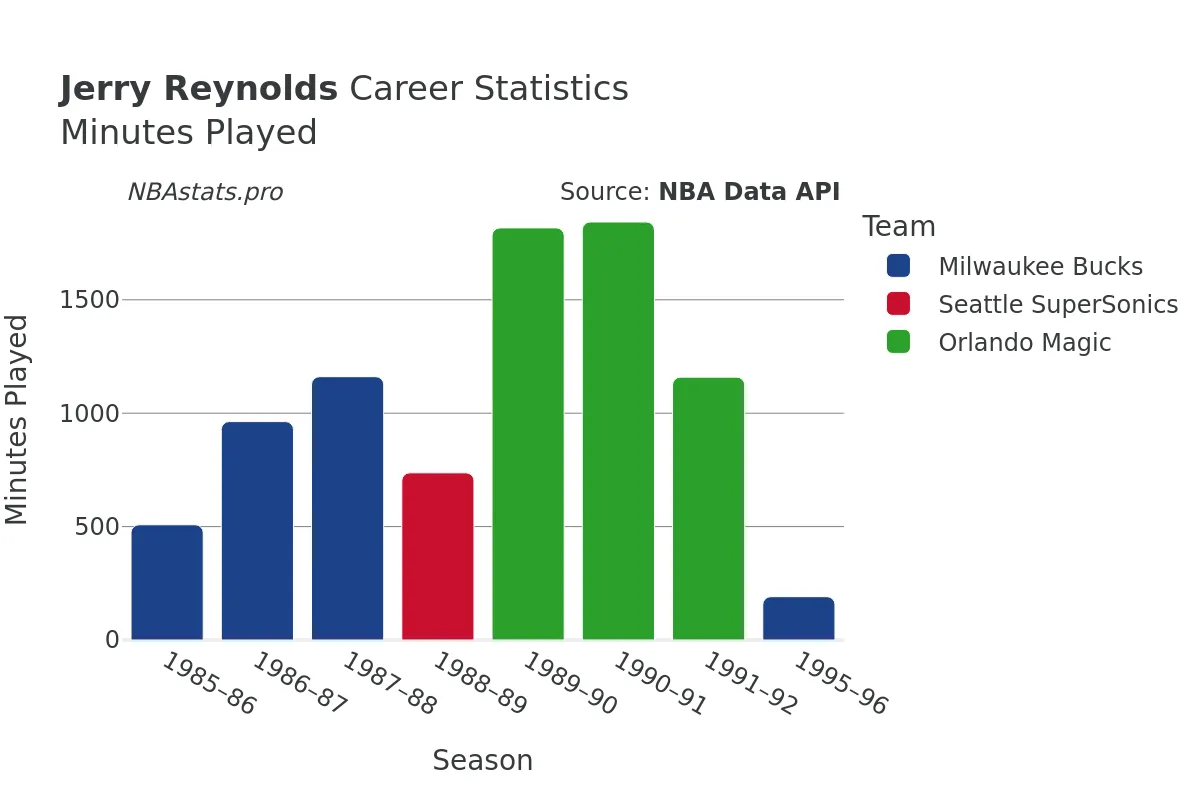
**Overall Impact:** Throughout his 443 games played and 8379 minutes on the court, Jerry Reynolds left a lasting impression with his all-around skills, leadership, and dedication to elevating his team's performance. His total of 4036 points scored further underscores his offensive capabilities and knack for putting up numbers when his team needed it most.
As we dissect the statistics that define Jerry Reynolds's career, it becomes evident that his contributions went beyond mere numbers on a stat sheet. His presence on the court, his leadership qualities, and his ability to elevate the play of those around him make him a player worth remembering and studying for aspiring athletes and basketball enthusiasts alike.
For a more detailed breakdown of Jerry Reynolds's performance and impact on each team he played for, dive into the charts and graphs on this page. Explore how his stats evolved over the years, how he fared in different cities and states, and gain a deeper understanding of the legacy he left behind in the world of professional basketball.
Read more
Games Played
Points
Assists
Rebounds
Steals
Minutes Played
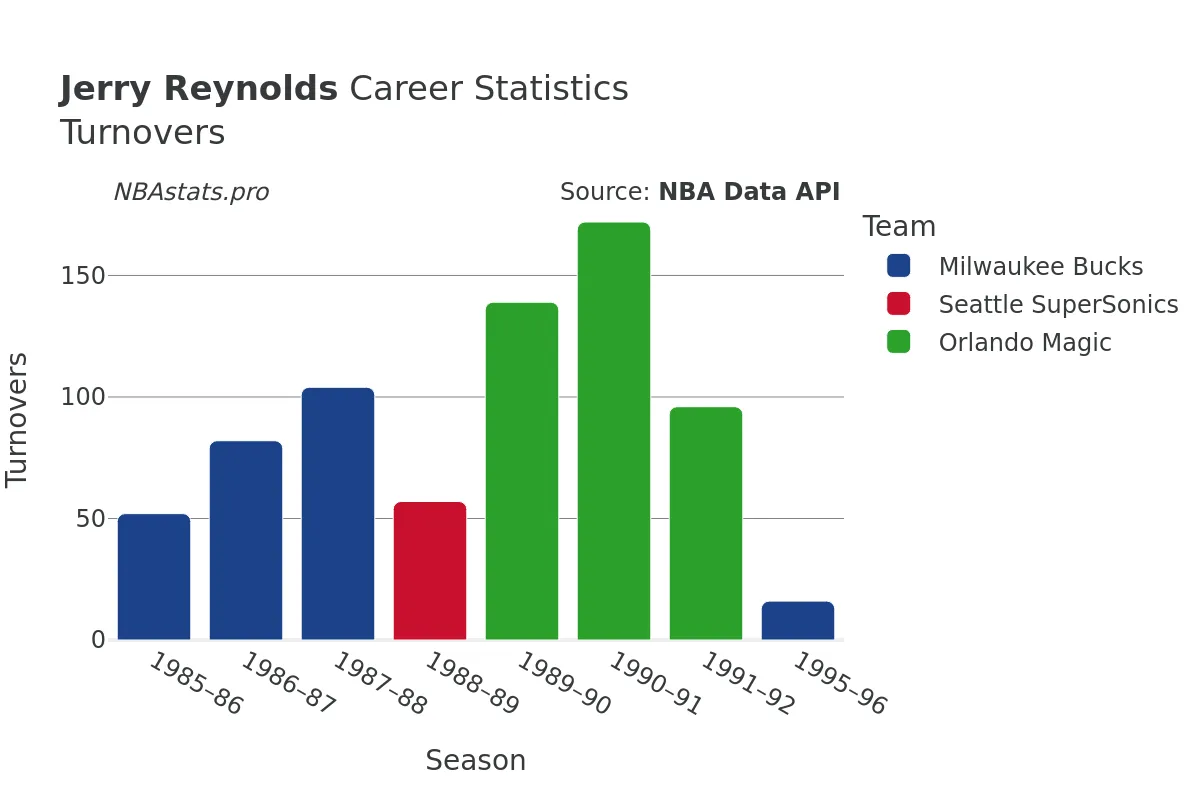
Turnovers
Blocks
Jerry Reynolds Career Stats Table
| SEASON | TEAM | AGE | GP | GS | MIN | FGM | FGA | FG % | FG3M | FG3A | FG3 % | FTM | FTA | FT % | OREB | DREB | REB | AST | STL | BLK | TOV | PF | PTS | |
|---|---|---|---|---|---|---|---|---|---|---|---|---|---|---|---|---|---|---|---|---|---|---|---|---|
| 1 | 1985-86 | MIL | 23 | 55 | 8 | 508 | 72 | 162 | 44.4% | 1 | 2 | 50.0% | 58 | 104 | 55.8% | 37 | 43 | 80 | 86 | 43 | 19 | 52 | 57 | 203 |
| 2 | 1986-87 | MIL | 24 | 58 | 24 | 963 | 140 | 356 | 39.3% | 6 | 18 | 33.3% | 118 | 184 | 64.1% | 72 | 101 | 173 | 106 | 50 | 30 | 82 | 91 | 404 |
| 3 | 1987-88 | MIL | 25 | 62 | 21 | 1,161 | 188 | 419 | 44.9% | 3 | 7 | 42.9% | 119 | 154 | 77.3% | 70 | 90 | 160 | 104 | 74 | 32 | 104 | 97 | 498 |
| 4 | 1988-89 | SEA | 26 | 56 | 0 | 737 | 149 | 357 | 41.7% | 3 | 15 | 20.0% | 127 | 167 | 76.0% | 49 | 51 | 100 | 62 | 53 | 26 | 57 | 58 | 428 |
| 5 | 1989-90 | ORL | 27 | 67 | 40 | 1,817 | 309 | 741 | 41.7% | 1 | 14 | 7.1% | 239 | 322 | 74.2% | 91 | 232 | 323 | 180 | 93 | 64 | 139 | 162 | 858 |
| 6 | 1990-91 | ORL | 28 | 80 | 9 | 1,843 | 344 | 793 | 43.4% | 10 | 34 | 29.4% | 336 | 419 | 80.2% | 88 | 211 | 299 | 203 | 95 | 56 | 172 | 123 | 1,034 |
| 7 | 1991-92 | ORL | 29 | 46 | 16 | 1,159 | 197 | 518 | 38.0% | 3 | 24 | 12.5% | 158 | 189 | 83.6% | 47 | 102 | 149 | 151 | 63 | 17 | 96 | 69 | 555 |
| 8 | 1995-96 | MIL | 33 | 19 | 0 | 191 | 21 | 53 | 39.6% | 1 | 10 | 10.0% | 13 | 21 | 61.9% | 13 | 20 | 33 | 12 | 15 | 6 | 16 | 20 | 56 |
Max Min
NBA Alltime Leaders
Games Played
Robert Parish: 1,611Kareem Abdul-Jabbar: 1,560
Vince Carter: 1,541
Dirk Nowitzki: 1,522
John Stockton: 1,504
Points
LeBron James: 40,474Kareem Abdul-Jabbar: 38,387
Karl Malone: 36,928
Kobe Bryant: 33,643
Michael Jordan: 32,292
Steals
John Stockton: 3,265Jason Kidd: 2,684
Chris Paul: 2,614
Michael Jordan: 2,514
Gary Payton: 2,445
Free Throws Made
Karl Malone: 9,787Moses Malone: 8,531
LeBron James: 8,390
Kobe Bryant: 8,378
Oscar Robertson: 7,694