Jeff Teague Stats: NBA Career

In the fast-paced world of NBA basketball, few players can boast the level of consistency and versatility that Jeff Teague brought to the court throughout his career. From his early days with the Atlanta Hawks to his most recent stints with the Milwaukee Bucks and Boston Celtics, Teague has left a lasting impact on the teams and cities he has represented.
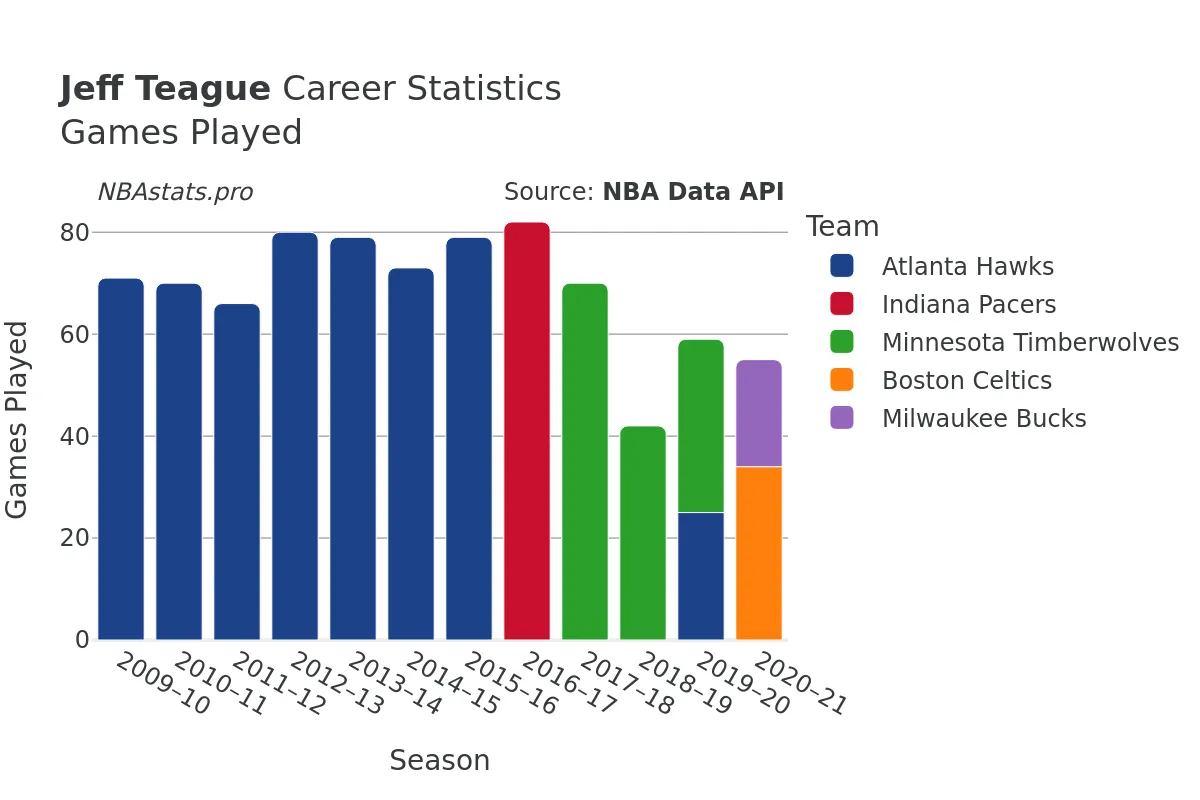
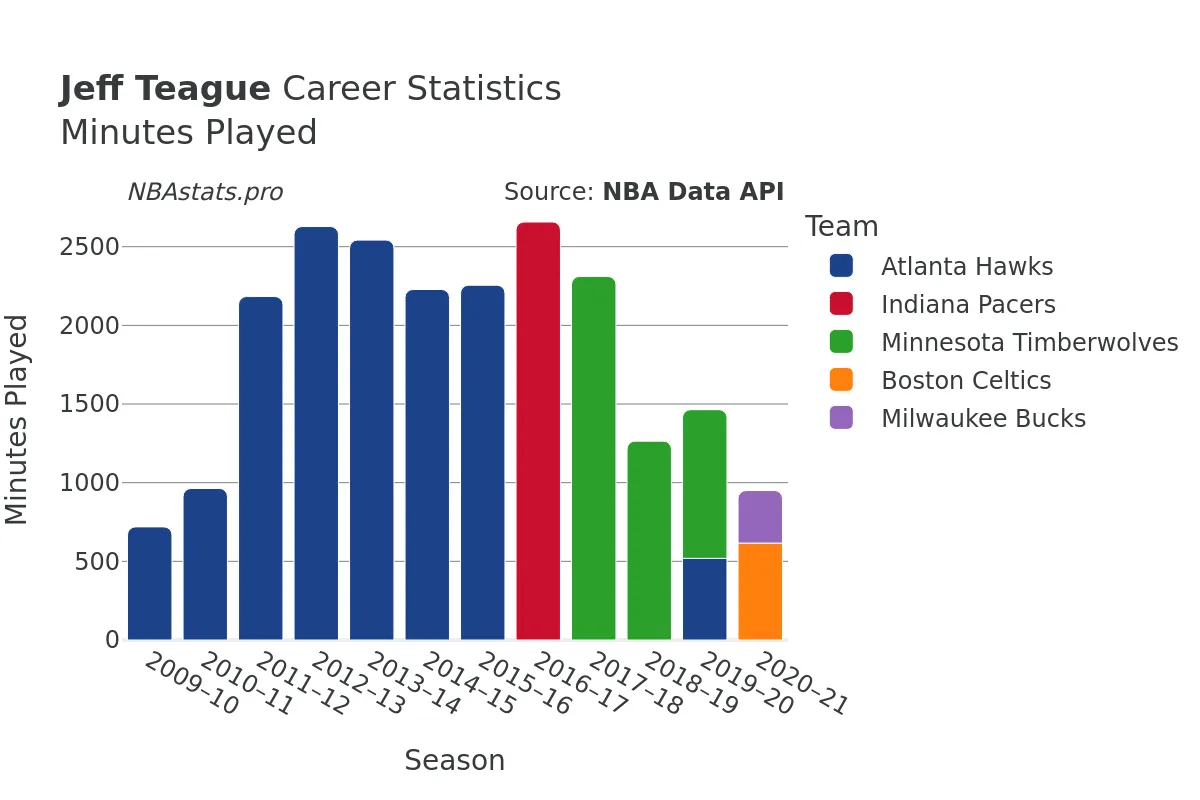
Jeff Teague's journey in the NBA began in the 2009-2010 season when he stepped onto the court as a 22-year-old rookie. Over the next 12 seaso...ns, Teague showcased his skills with finesse, proving to be a valuable asset on both ends of the court. With a total of 940 games played and an impressive 24,578 minutes logged, Teague consistently proved his durability and commitment to the game.
One of Teague's standout attributes is his scoring ability. With 8,757 field goals attempted and 3,884 made, he maintained a solid shooting percentage of 44.35%. This consistency in scoring made him a reliable option for his teams when they needed crucial points on the board. Moreover, his prowess extended to the free-throw line, where he showcased his accuracy with 2,518 successful attempts out of 2,975, highlighting his composure under pressure.
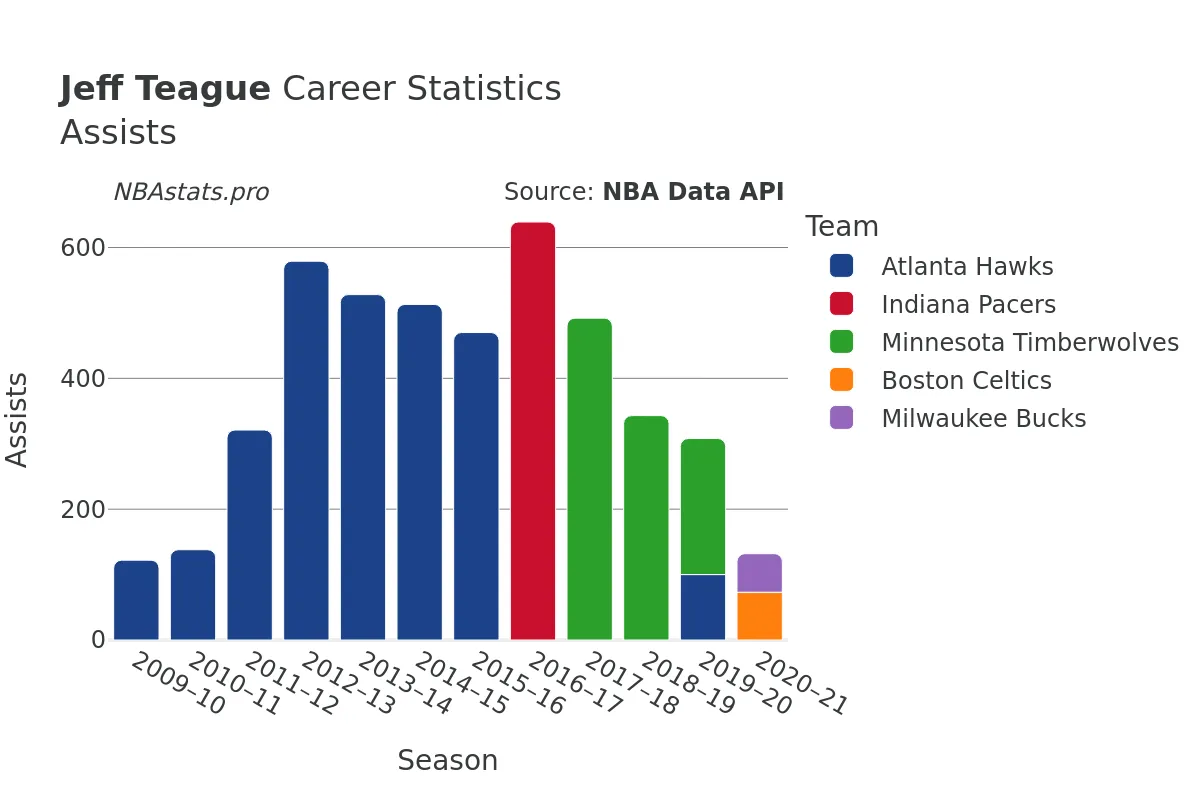
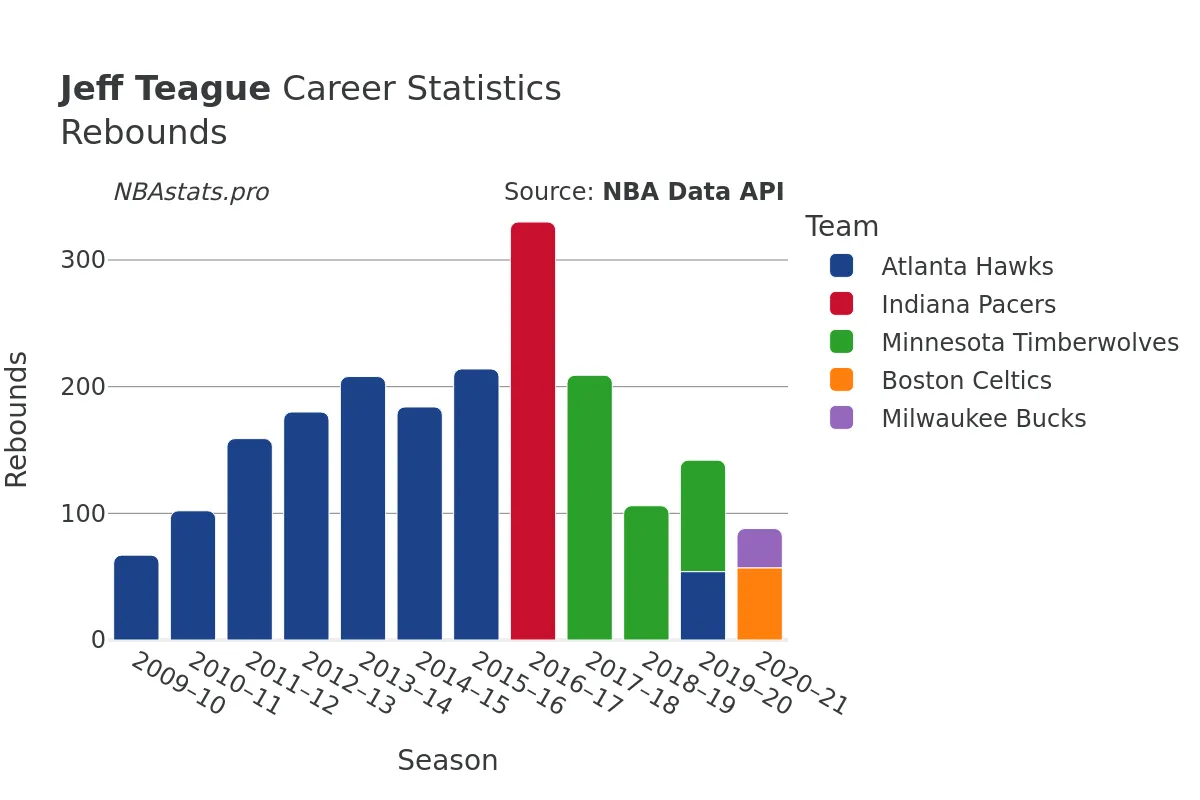
Beyond scoring, Teague made his presence felt in all facets of the game. His contributions on the boards were notable, with a total of 2,219 rebounds throughout his career. Of these, 1,903 were defensive rebounds, showcasing his commitment to protecting the rim and limiting the opposition's second-chance opportunities. Additionally, Teague displayed his playmaking skills with an impressive 5,025 assists, demonstrating his vision and ability to create scoring opportunities for his teammates.
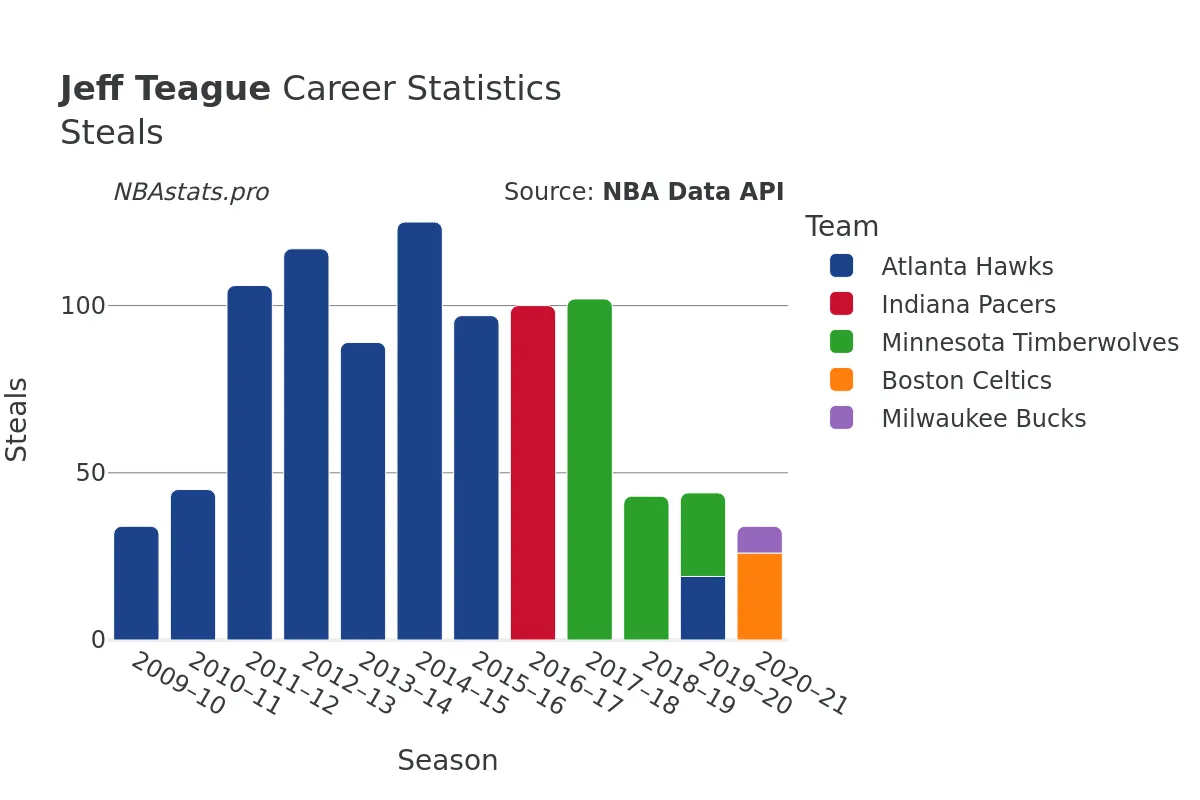
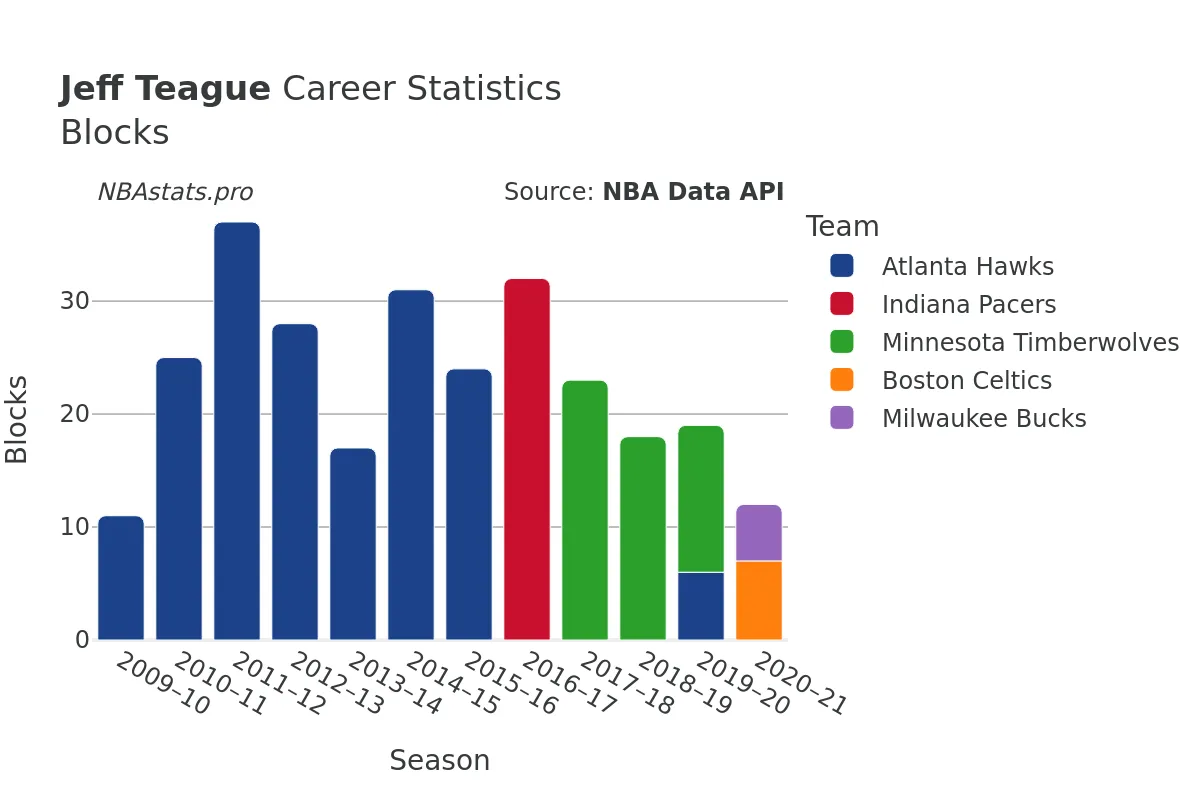
Defensively, Teague was a tenacious player, amassing 1,014 steals and 308 blocks over his career. His defensive prowess was a testament to his basketball IQ and anticipation, as he consistently disrupted opponents' plays and created turnovers that swung the momentum in his team's favor.
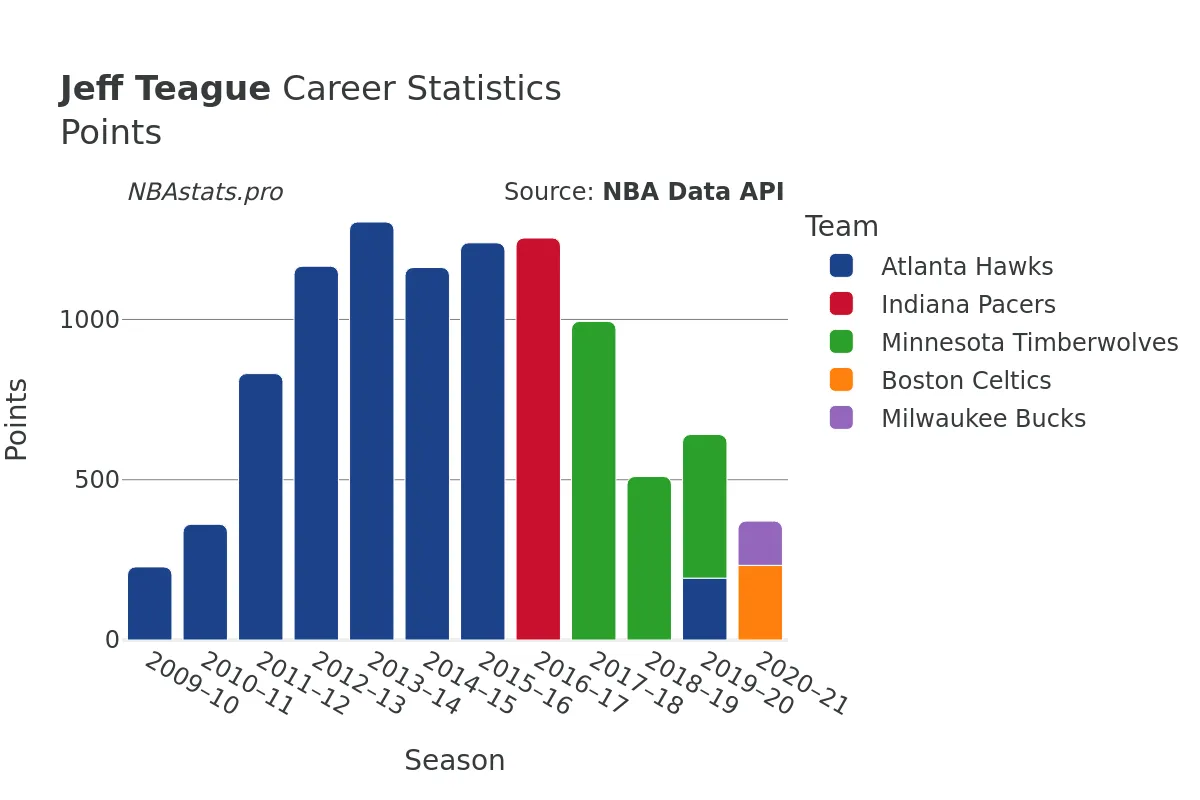
With a total of 11,073 points scored throughout his tenure in the NBA, Teague proved time and again that he could be counted on to deliver when it mattered most. Whether driving to the hoop for a layup, sinking a crucial three-pointer, or setting up a teammate for an easy basket, Teague's offensive versatility was a key asset for any team he played for.
As a fan of the game or a basketball enthusiast looking to delve deeper into the stats and performance of a skilled player, Jeff Teague's profile offers a treasure trove of data to explore. From his early days with the Atlanta Hawks to his final seasons with the Milwaukee Bucks and Boston Celtics, Teague's impact on the court is evident in the numbers he produced.
So, dive into the charts, analyze the numbers, and uncover the story of Jeff Teague's remarkable career in the NBA. From Atlanta to Indiana, Minnesota to Boston, and finally, Milwaukee, Teague's journey is a testament to hard work, dedication, and a passion for the game of basketball.
Read more
Games Played
Points
Assists
Rebounds
Steals
Minutes Played
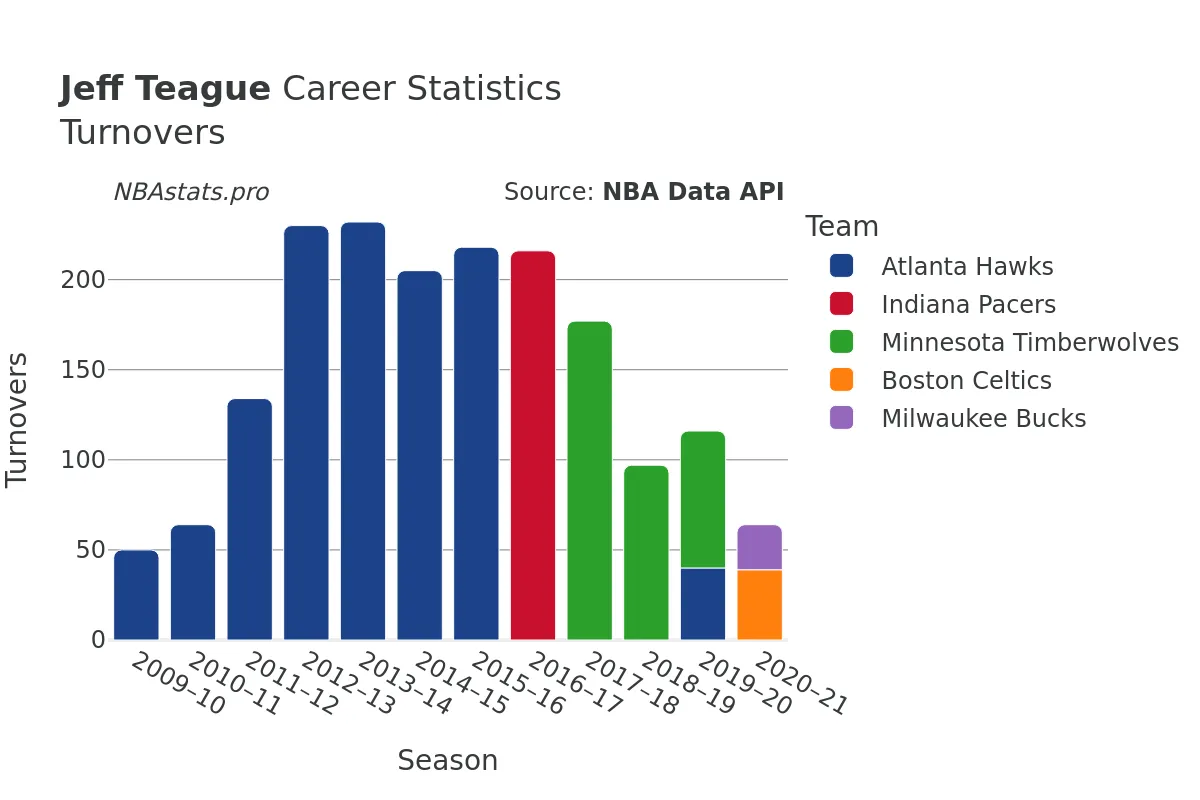
Turnovers
Blocks
Jeff Teague Career Stats Table
| SEASON | TEAM | AGE | GP | GS | MIN | FGM | FGA | FG % | FG3M | FG3A | FG3 % | FTM | FTA | FT % | OREB | DREB | REB | AST | STL | BLK | TOV | PF | PTS | |
|---|---|---|---|---|---|---|---|---|---|---|---|---|---|---|---|---|---|---|---|---|---|---|---|---|
| 1 | 2009-10 | ATL | 22 | 71 | 3 | 719 | 90 | 227 | 39.6% | 7 | 32 | 21.9% | 41 | 49 | 83.7% | 5 | 62 | 67 | 122 | 34 | 11 | 50 | 82 | 228 |
| 2 | 2010-11 | ATL | 23 | 70 | 7 | 963 | 133 | 304 | 43.8% | 18 | 48 | 37.5% | 77 | 97 | 79.4% | 11 | 91 | 102 | 138 | 45 | 25 | 64 | 82 | 361 |
| 3 | 2011-12 | ATL | 24 | 66 | 66 | 2,183 | 320 | 672 | 47.6% | 51 | 149 | 34.2% | 140 | 185 | 75.7% | 21 | 138 | 159 | 321 | 106 | 37 | 134 | 145 | 831 |
| 4 | 2012-13 | ATL | 25 | 80 | 78 | 2,628 | 439 | 974 | 45.1% | 89 | 248 | 35.9% | 199 | 226 | 88.1% | 25 | 155 | 180 | 579 | 117 | 28 | 230 | 181 | 1,166 |
| 5 | 2013-14 | ATL | 26 | 79 | 79 | 2,542 | 456 | 1,040 | 43.8% | 74 | 225 | 32.9% | 318 | 376 | 84.6% | 34 | 174 | 208 | 528 | 89 | 17 | 232 | 158 | 1,304 |
| 6 | 2014-15 | ATL | 27 | 73 | 72 | 2,228 | 408 | 887 | 46.0% | 71 | 207 | 34.3% | 275 | 319 | 86.2% | 30 | 154 | 184 | 513 | 125 | 31 | 205 | 139 | 1,162 |
| 7 | 2015-16 | ATL | 28 | 79 | 78 | 2,255 | 434 | 988 | 43.9% | 110 | 274 | 40.1% | 261 | 312 | 83.7% | 33 | 181 | 214 | 470 | 97 | 24 | 218 | 167 | 1,239 |
| 8 | 2016-17 | IND | 29 | 82 | 82 | 2,657 | 402 | 909 | 44.2% | 90 | 252 | 35.7% | 360 | 415 | 86.7% | 33 | 297 | 330 | 639 | 100 | 32 | 216 | 165 | 1,254 |
| 9 | 2017-18 | MIN | 30 | 70 | 70 | 2,311 | 354 | 794 | 44.6% | 84 | 228 | 36.8% | 202 | 239 | 84.5% | 24 | 185 | 209 | 492 | 102 | 23 | 177 | 171 | 994 |
| 10 | 2018-19 | MIN | 31 | 42 | 41 | 1,264 | 176 | 416 | 42.3% | 35 | 105 | 33.3% | 123 | 153 | 80.4% | 16 | 90 | 106 | 343 | 43 | 18 | 97 | 90 | 510 |
| 11 | 2019-20 | MIN | 32 | 34 | 13 | 945 | 145 | 324 | 44.8% | 33 | 87 | 37.9% | 125 | 144 | 86.8% | 15 | 73 | 88 | 208 | 25 | 13 | 76 | 70 | 448 |
| 12 | 2019-20 | ATL | 32 | 25 | 4 | 519 | 68 | 165 | 41.2% | 10 | 30 | 33.3% | 47 | 53 | 88.7% | 12 | 42 | 54 | 100 | 19 | 6 | 40 | 36 | 193 |
| 13 | 2019-20 | TOT | 32 | 59 | 17 | 1,464 | 213 | 489 | 43.6% | 43 | 117 | 36.8% | 172 | 197 | 87.3% | 27 | 115 | 142 | 308 | 44 | 19 | 116 | 106 | 641 |
| 14 | 2020-21 | BOS | 33 | 34 | 5 | 616 | 78 | 188 | 41.5% | 26 | 56 | 46.4% | 51 | 61 | 83.6% | 10 | 47 | 57 | 73 | 26 | 7 | 39 | 43 | 233 |
| 15 | 2020-21 | MIL | 33 | 21 | 2 | 334 | 45 | 96 | 46.9% | 10 | 26 | 38.5% | 38 | 44 | 86.4% | 5 | 26 | 31 | 59 | 8 | 5 | 25 | 13 | 138 |
| 16 | 2020-21 | TOT | 33 | 55 | 7 | 950 | 123 | 284 | 43.3% | 36 | 82 | 43.9% | 89 | 105 | 84.8% | 15 | 73 | 88 | 132 | 34 | 12 | 64 | 56 | 371 |
Max Min
NBA Alltime Leaders
Games Played
Robert Parish: 1,611Kareem Abdul-Jabbar: 1,560
Vince Carter: 1,541
Dirk Nowitzki: 1,522
John Stockton: 1,504
Points
LeBron James: 40,474Kareem Abdul-Jabbar: 38,387
Karl Malone: 36,928
Kobe Bryant: 33,643
Michael Jordan: 32,292
Steals
John Stockton: 3,265Jason Kidd: 2,684
Chris Paul: 2,614
Michael Jordan: 2,514
Gary Payton: 2,445
Free Throws Made
Karl Malone: 9,787Moses Malone: 8,531
LeBron James: 8,390
Kobe Bryant: 8,378
Oscar Robertson: 7,694