Jarred Vanderbilt Stats: NBA Career

**Unlocking the Versatility of NBA Forward Jarred Vanderbilt**
In the fast-paced world of the NBA, versatility is a prized asset that can elevate a player's impact on the court. Among the talented pool of basketball stars, Jarred Vanderbilt has emerged as a dynamic force, leaving his mark on multiple NBA teams. Let's dive into the numbers and explore the journey of this promising forward across the Denver Nuggets, Minnesota Timberwolves, Utah Jazz, and the Los Angeles Lakers.
**A Journey Acros...s States and Teams**
Jarred Vanderbilt's NBA odyssey kicked off in the 2018-19 season when he entered the league at the age of 20. Since then, he has been an active player, showcasing his skills and adaptability on the court. His career has taken him through various cities and states, starting with the Denver Nuggets and later moving on to the Minnesota Timberwolves, Utah Jazz, and the Los Angeles Lakers. This journey has not only shaped his game but also highlighted his ability to integrate seamlessly into different team dynamics.
**A Closer Look at the Numbers**
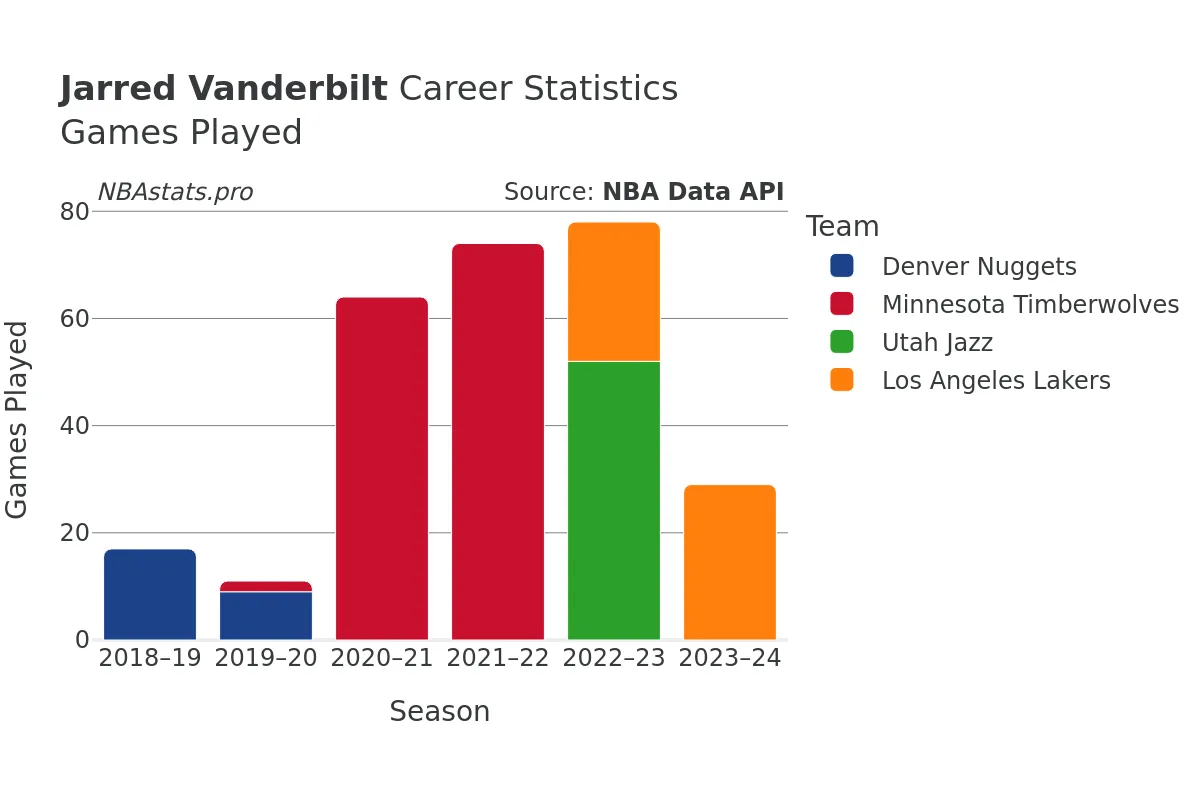
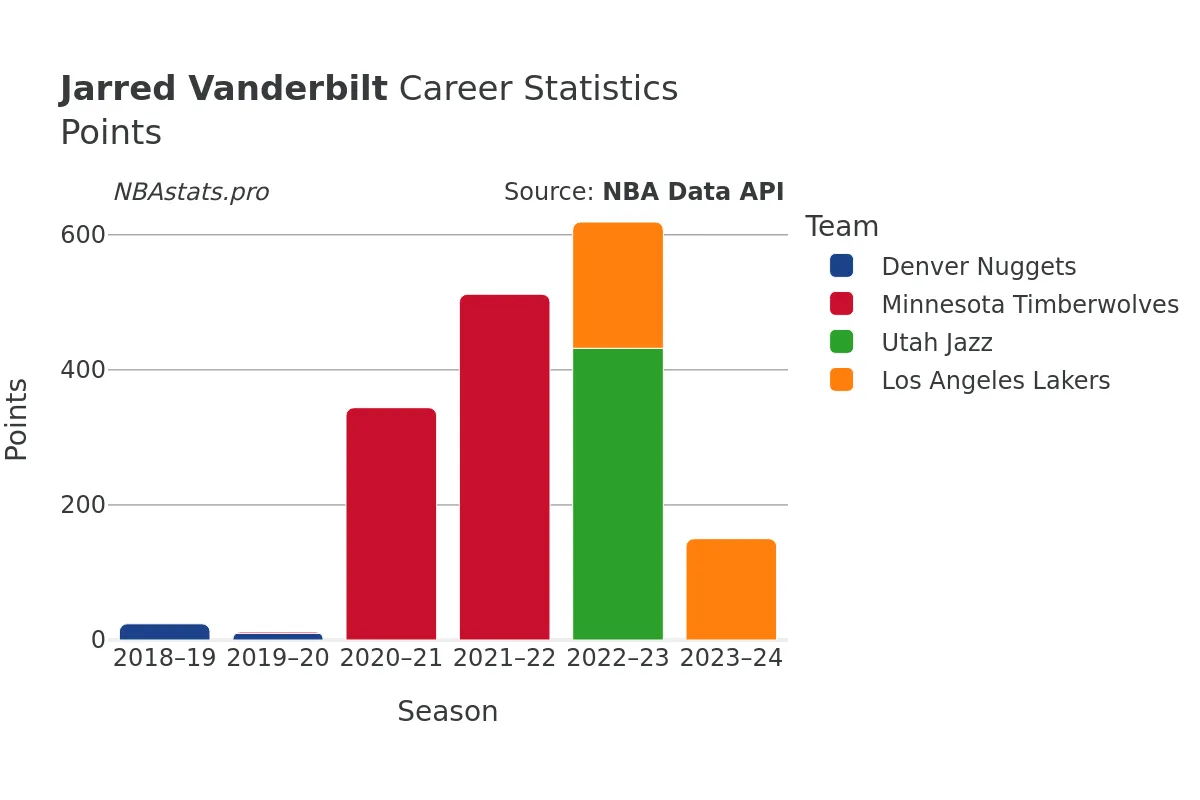
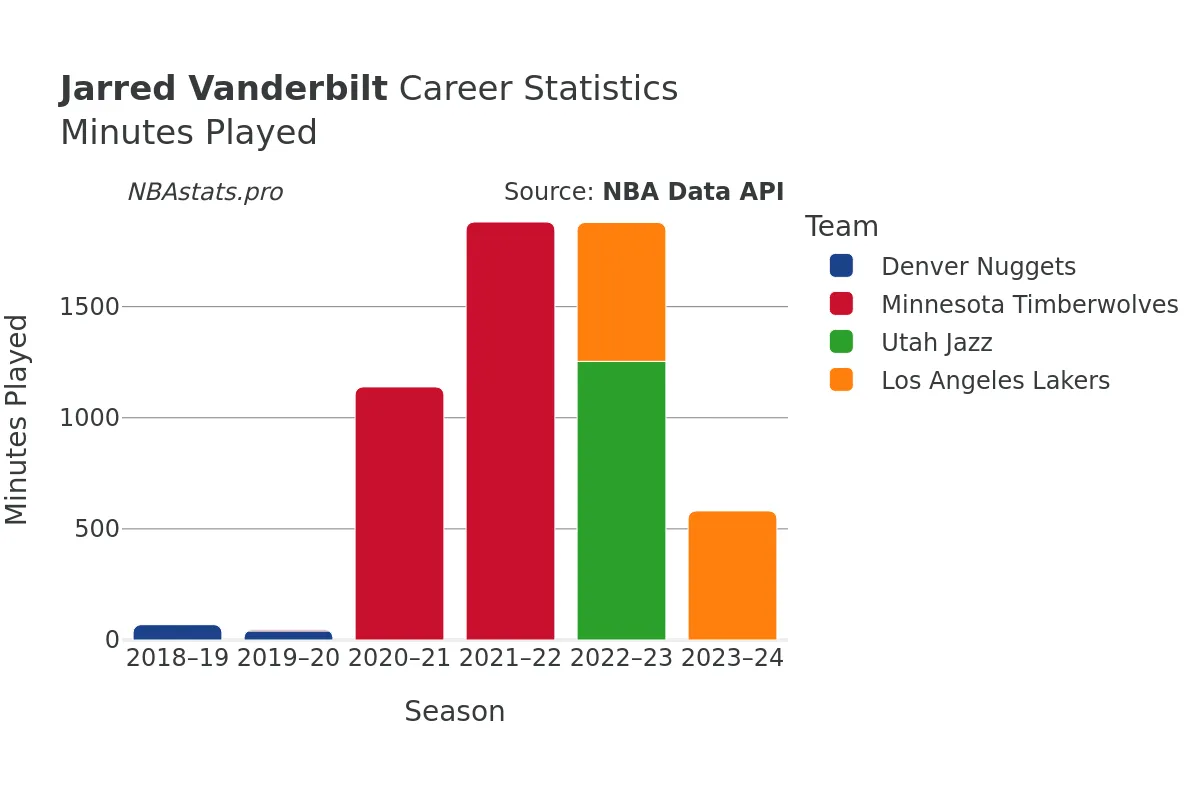
Vanderbilt's stats speak volumes about his on-court prowess and contribution to his teams. In his 362 games played, he has logged an impressive 7522 minutes, demonstrating his durability and consistency. His scoring ability is evident in his 927 goals made out of 1648 attempts, with an impressive shooting percentage of 56.25%.
Furthermore, his effectiveness extends to the free-throw line, where he has shown composure by converting 369 out of 561 attempts. This reflects a strong free-throw percentage, underlining his reliability in crucial moments of the game.
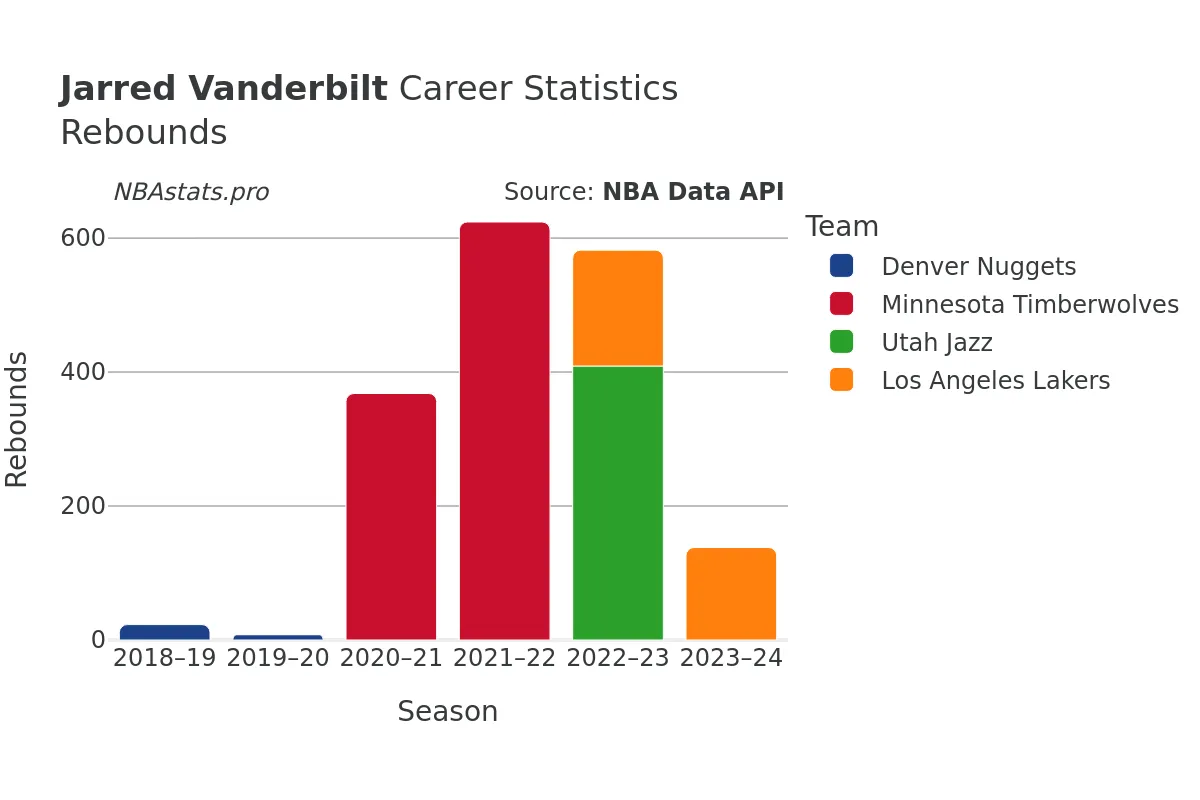
Rebounding is another area where Vanderbilt shines, amassing a total of 2335 rebounds throughout his career. His tenacity on the boards is evident in the distribution between defensive rebounds (1608) and offensive rebounds (727), showcasing his ability to control the glass on both ends of the court.
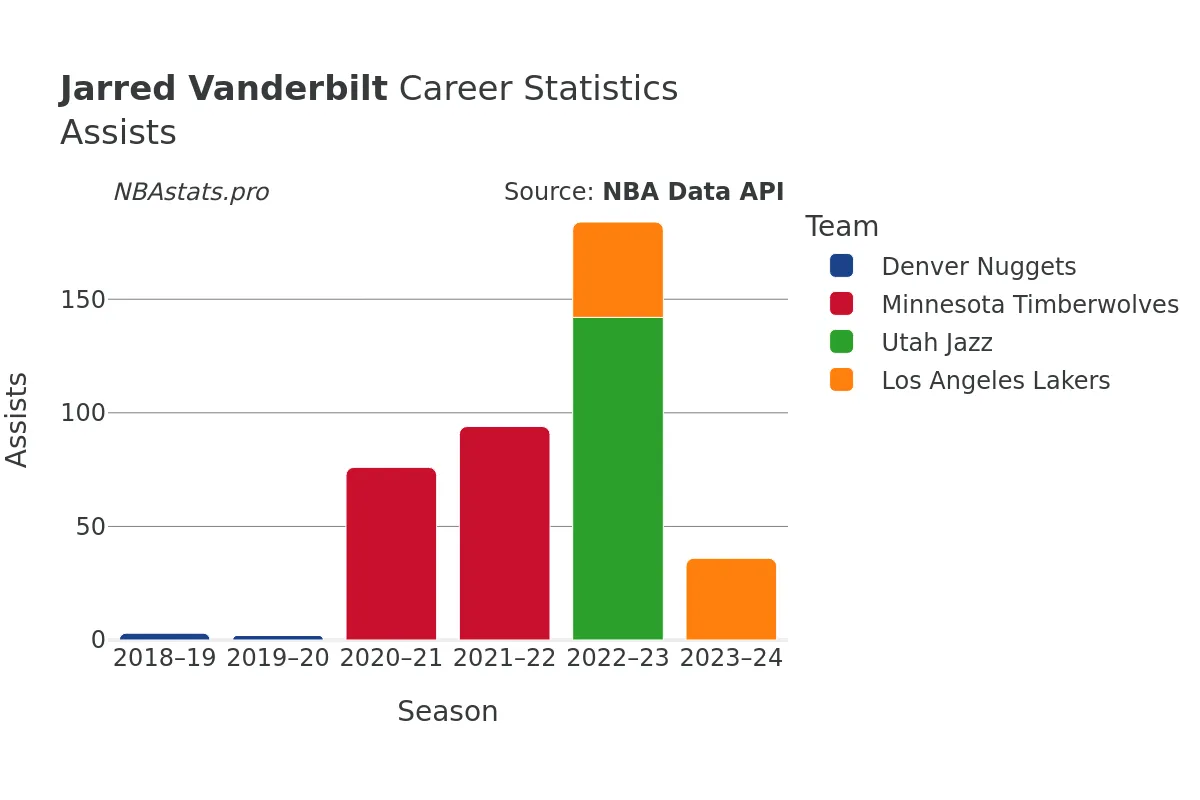
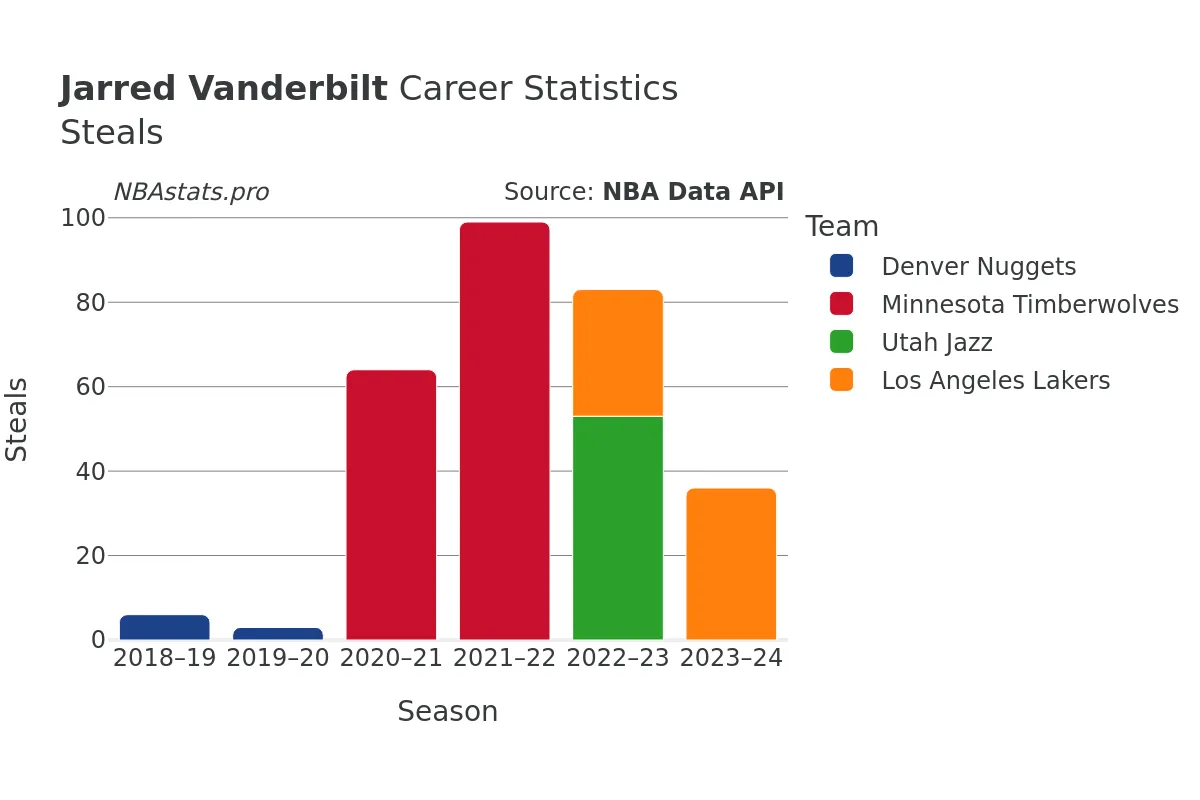
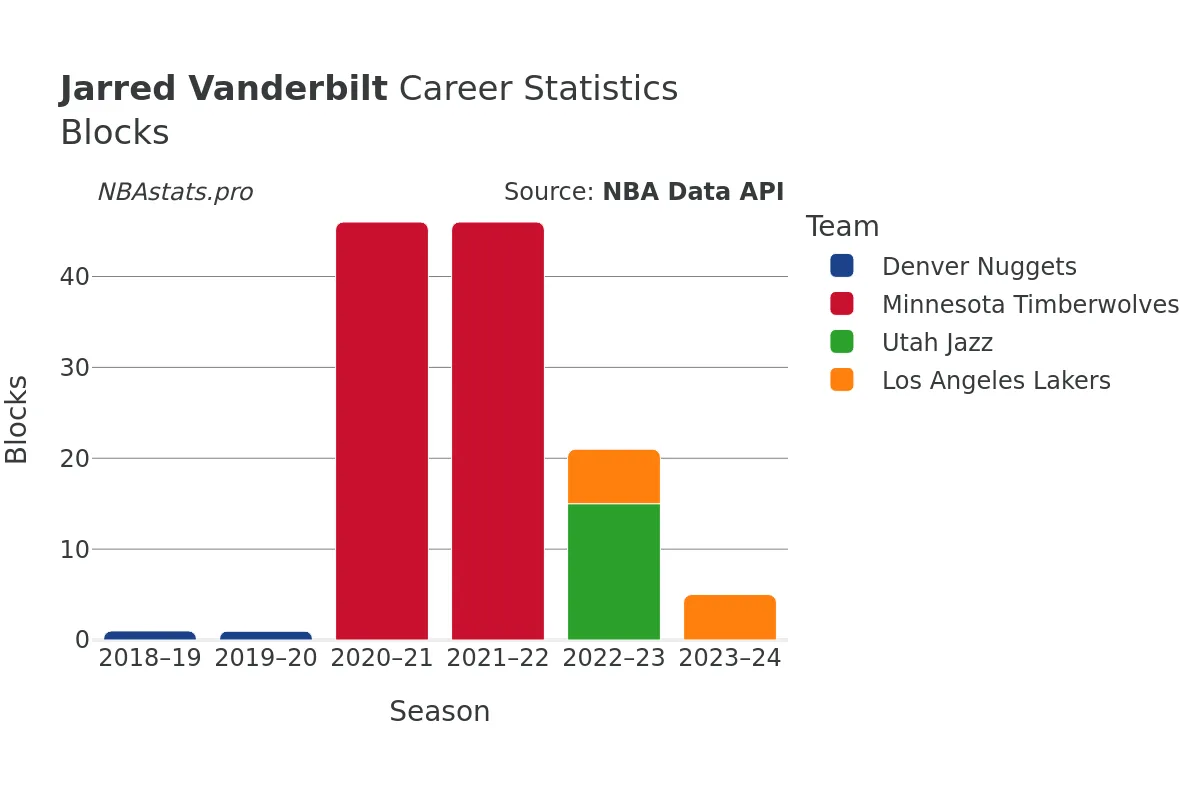
As a well-rounded player, Vanderbilt also contributes in playmaking, with 581 assists to his name. His defensive presence is felt through 377 steals and 142 blocks, underscoring his ability to disrupt the opposition's offensive flow and protect the rim when needed.
**The Impact of Vanderbilt**
Beyond the numbers, Jarred Vanderbilt's impact on the court goes beyond individual stats. His versatility allows him to fill multiple roles within a team, adapting to various playing styles and defensive assignments. Whether it's crashing the boards, setting up teammates, or making crucial defensive stops, Vanderbilt's contributions are invaluable to his team's success.
As he continues to evolve and refine his game, NBA fans can expect even greater feats from this promising forward. His journey across different teams and states has not only showcased his adaptability but also laid the foundation for a promising career ahead. With each game, Vanderbilt cements his status as a versatile and impactful player, capable of making a difference on both ends of the court.
**In Conclusion**
With a blend of athleticism, skill, and basketball IQ, Jarred Vanderbilt stands out as a player to watch in the NBA. His journey through multiple teams has honed his abilities and expanded his basketball horizons. By delving into the stats and exploring his impact on the court, fans can better appreciate the unique skill set that sets Vanderbilt apart in the league. As he continues to grow and make his mark in the NBA, the future looks bright for this dynamic forward.
Read more
Games Played
Points
Assists
Rebounds
Steals
Minutes Played
Turnovers
Blocks
Jarred Vanderbilt Career Stats Table
| SEASON | TEAM | AGE | GP | GS | MIN | FGM | FGA | FG % | FG3M | FG3A | FG3 % | FTM | FTA | FT % | OREB | DREB | REB | AST | STL | BLK | TOV | PF | PTS | |
|---|---|---|---|---|---|---|---|---|---|---|---|---|---|---|---|---|---|---|---|---|---|---|---|---|
| 1 | 2018-19 | DEN | 20 | 17 | 0 | 69 | 9 | 19 | 47.4% | 0 | 1 | 0.0% | 6 | 10 | 60.0% | 7 | 16 | 23 | 3 | 6 | 1 | 8 | 8 | 24 |
| 2 | 2019-20 | DEN | 21 | 9 | 0 | 41 | 5 | 7 | 71.4% | 0 | 0 | 0.0% | 0 | 0 | 0.0% | 3 | 5 | 8 | 2 | 3 | 1 | 7 | 6 | 10 |
| 3 | 2019-20 | MIN | 21 | 2 | 0 | 5 | 0 | 1 | 0.0% | 0 | 1 | 0.0% | 2 | 2 | 100.0% | 0 | 1 | 1 | 0 | 0 | 0 | 0 | 0 | 2 |
| 4 | 2019-20 | TOT | 21 | 11 | 0 | 47 | 5 | 8 | 62.5% | 0 | 1 | 0.0% | 2 | 2 | 100.0% | 3 | 6 | 9 | 2 | 3 | 1 | 7 | 6 | 12 |
| 5 | 2020-21 | MIN | 22 | 64 | 30 | 1,139 | 143 | 236 | 60.6% | 1 | 5 | 20.0% | 57 | 102 | 55.9% | 118 | 250 | 368 | 76 | 64 | 46 | 53 | 123 | 344 |
| 6 | 2021-22 | MIN | 23 | 74 | 67 | 1,881 | 212 | 361 | 58.7% | 2 | 14 | 14.3% | 86 | 131 | 65.6% | 215 | 409 | 624 | 94 | 99 | 46 | 73 | 181 | 512 |
| 7 | 2022-23 | UTA | 24 | 52 | 41 | 1,254 | 173 | 311 | 55.6% | 19 | 57 | 33.3% | 67 | 102 | 65.7% | 121 | 288 | 409 | 142 | 53 | 15 | 68 | 133 | 432 |
| 8 | 2022-23 | LAL | 24 | 26 | 24 | 625 | 74 | 140 | 52.9% | 10 | 33 | 30.3% | 29 | 37 | 78.4% | 49 | 124 | 173 | 42 | 30 | 6 | 29 | 57 | 187 |
| 9 | 2022-23 | TOT | 24 | 78 | 65 | 1,880 | 247 | 451 | 54.8% | 29 | 90 | 32.2% | 96 | 139 | 69.1% | 170 | 412 | 582 | 184 | 83 | 21 | 97 | 190 | 619 |
| 10 | 2023-24 | LAL | 25 | 29 | 6 | 581 | 59 | 114 | 51.8% | 8 | 27 | 29.6% | 24 | 36 | 66.7% | 41 | 97 | 138 | 36 | 36 | 5 | 28 | 43 | 150 |
Max Min
NBA Alltime Leaders
Games Played
Robert Parish: 1,611Kareem Abdul-Jabbar: 1,560
Vince Carter: 1,541
Dirk Nowitzki: 1,522
John Stockton: 1,504
Points
LeBron James: 40,474Kareem Abdul-Jabbar: 38,387
Karl Malone: 36,928
Kobe Bryant: 33,643
Michael Jordan: 32,292
Steals
John Stockton: 3,265Jason Kidd: 2,684
Chris Paul: 2,614
Michael Jordan: 2,514
Gary Payton: 2,445
Free Throws Made
Karl Malone: 9,787Moses Malone: 8,531
LeBron James: 8,390
Kobe Bryant: 8,378
Oscar Robertson: 7,694