Jamaal Tinsley Stats: NBA Career

Jamaal Tinsley: The Crafty Playmaker Who Left His Mark on the NBA
When it comes to the realm of professional basketball, some players make their mark through sheer athleticism, while others rely on their strategic prowess and court vision to leave a lasting impact. Jamaal Tinsley, a seasoned point guard who graced the courts of the NBA for over a decade, certainly falls into the latter category. With a career spanning from the 2001-02 season to the 2013-14 season, Tinsley donned the jerseys of ...the Indiana Pacers, Memphis Grizzlies, and Utah Jazz, showcasing his talents in various cities across the United States.
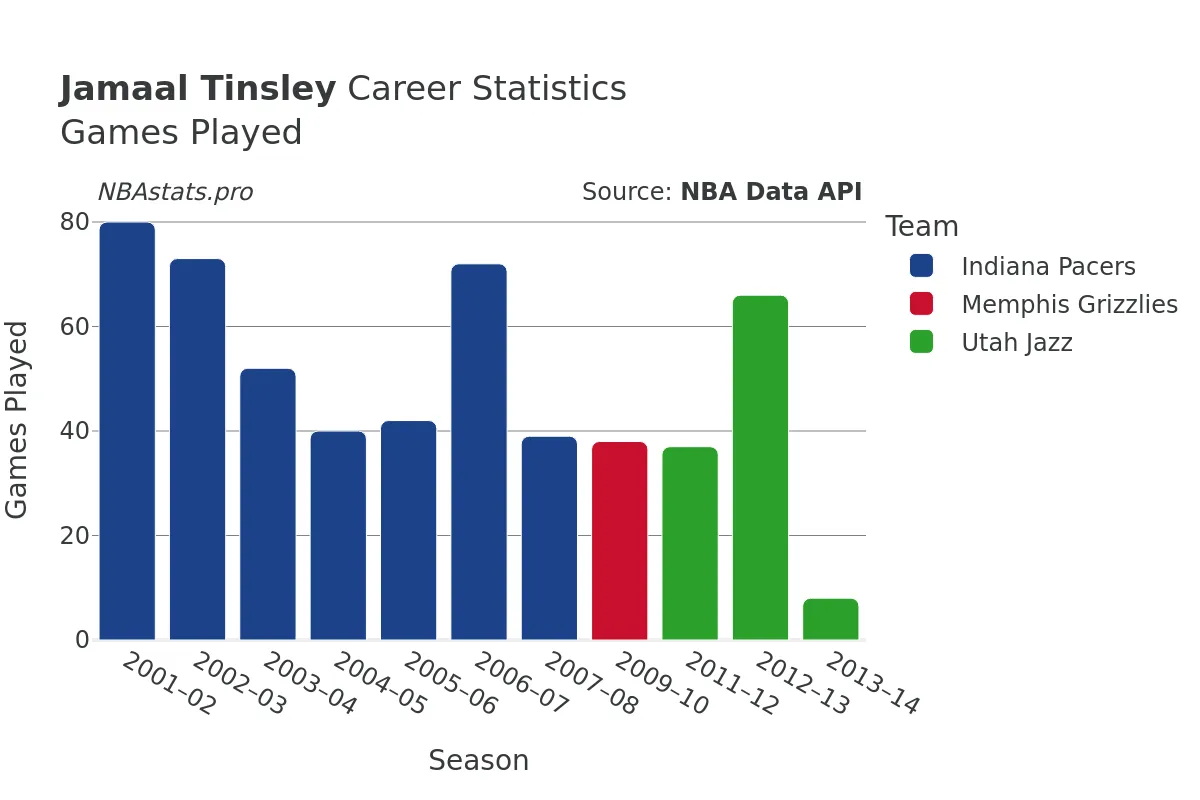
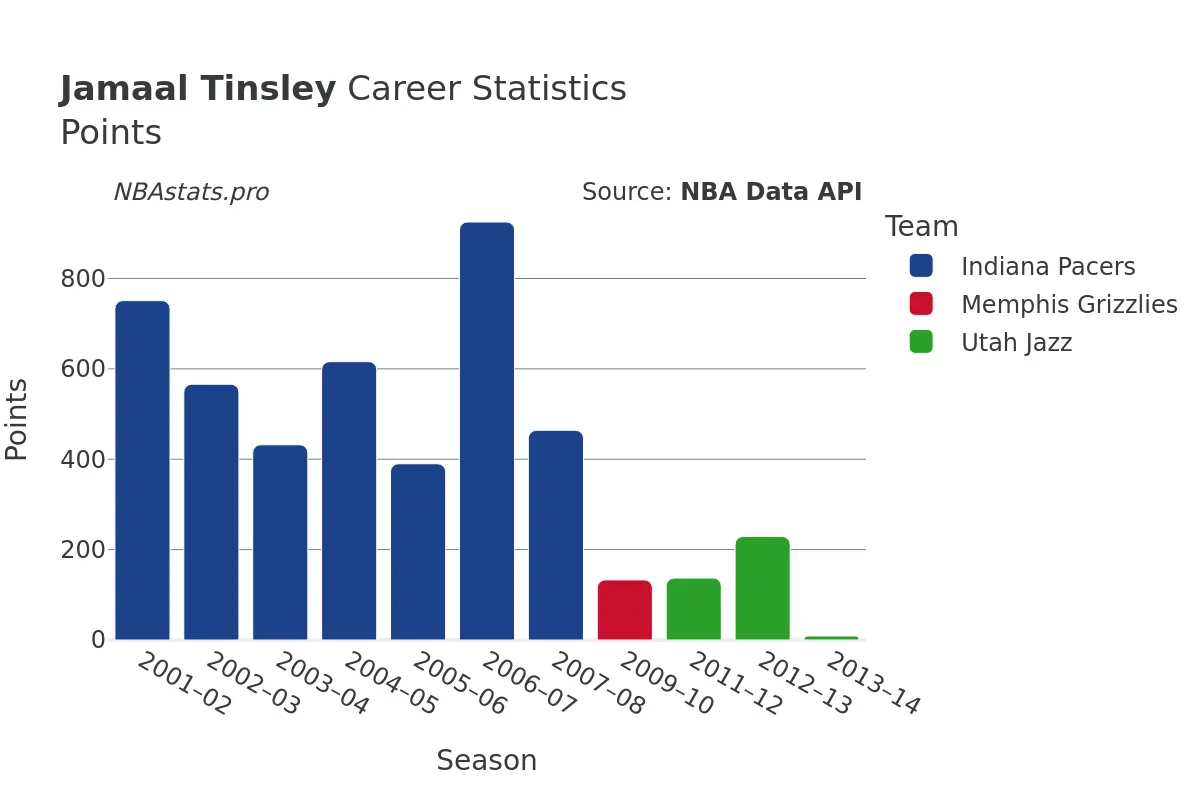
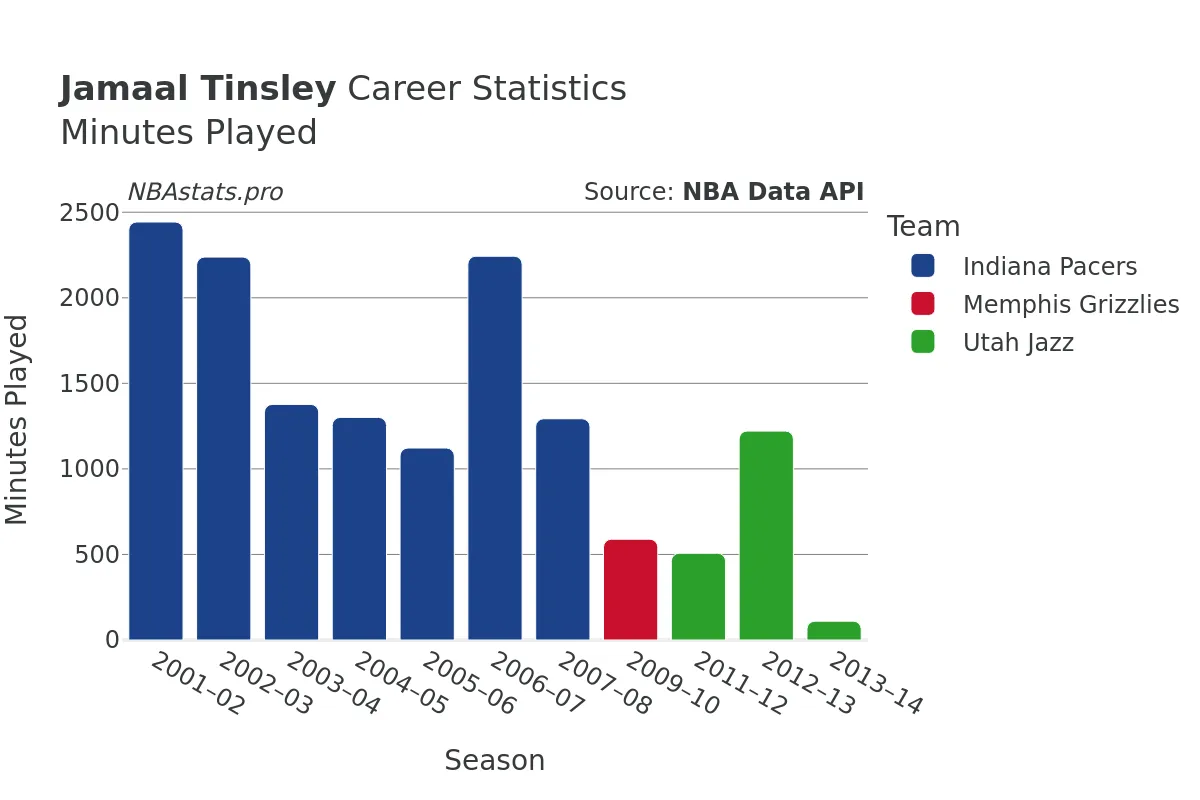
As a player who excelled in orchestrating plays and setting up his teammates for success, Tinsley's statistics paint a vivid picture of his on-court contributions. Over the course of his career, Tinsley played a total of 547 games, accumulating an impressive tally of 14444 minutes on the hardwood. Known for his calculated shot selection, Tinsley attempted 4481 field goals, sinking 1759 of them at a solid percentage of 39.25%. His ability to knock down shots from the charity stripe was equally commendable, as he converted 737 out of 1029 free throw attempts, boasting an efficient free throw percentage.
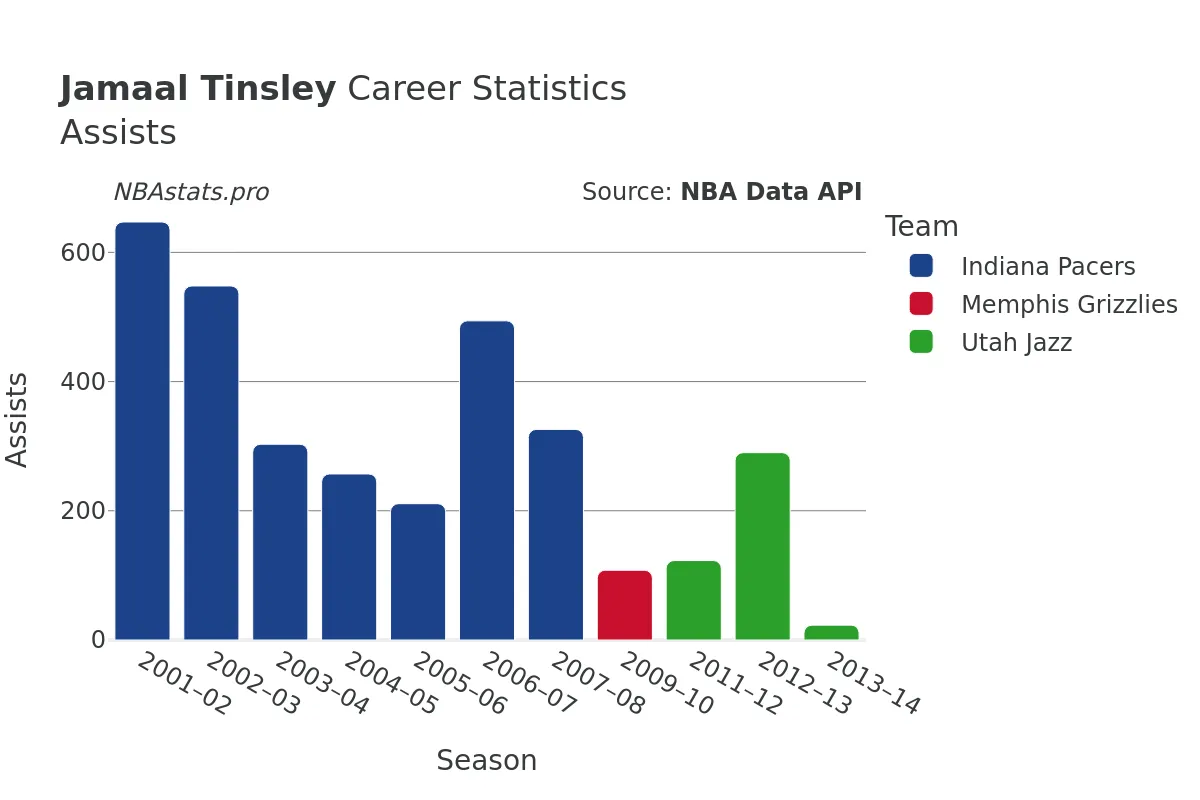
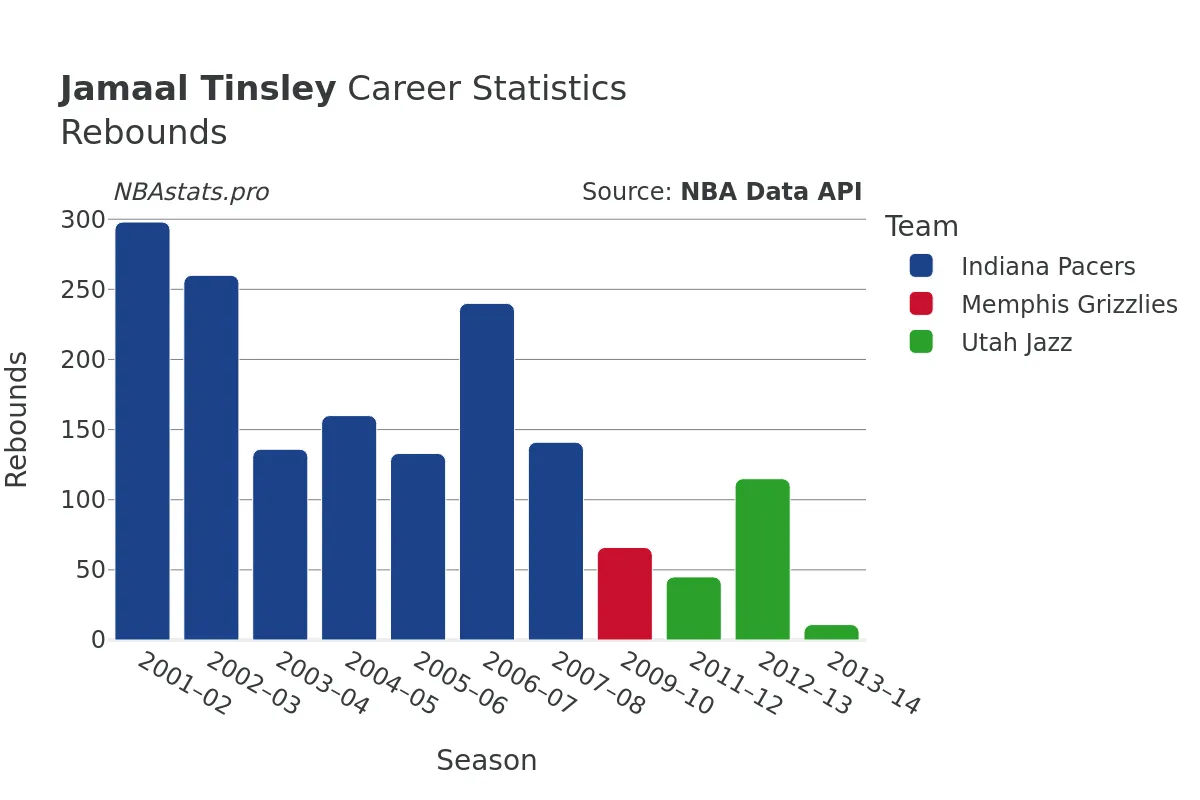
Beyond his scoring proficiency, Tinsley also made a significant impact on the boards, showcasing his tenacity and hustle on both ends of the floor. Adept at securing rebounds, Tinsley amassed a total of 1605 boards throughout his career, with 1260 coming on the defensive end and 345 on the offensive glass. His prowess as a facilitator was truly remarkable, evidenced by his impressive assist total of 3330, highlighting his knack for creating scoring opportunities for his teammates.
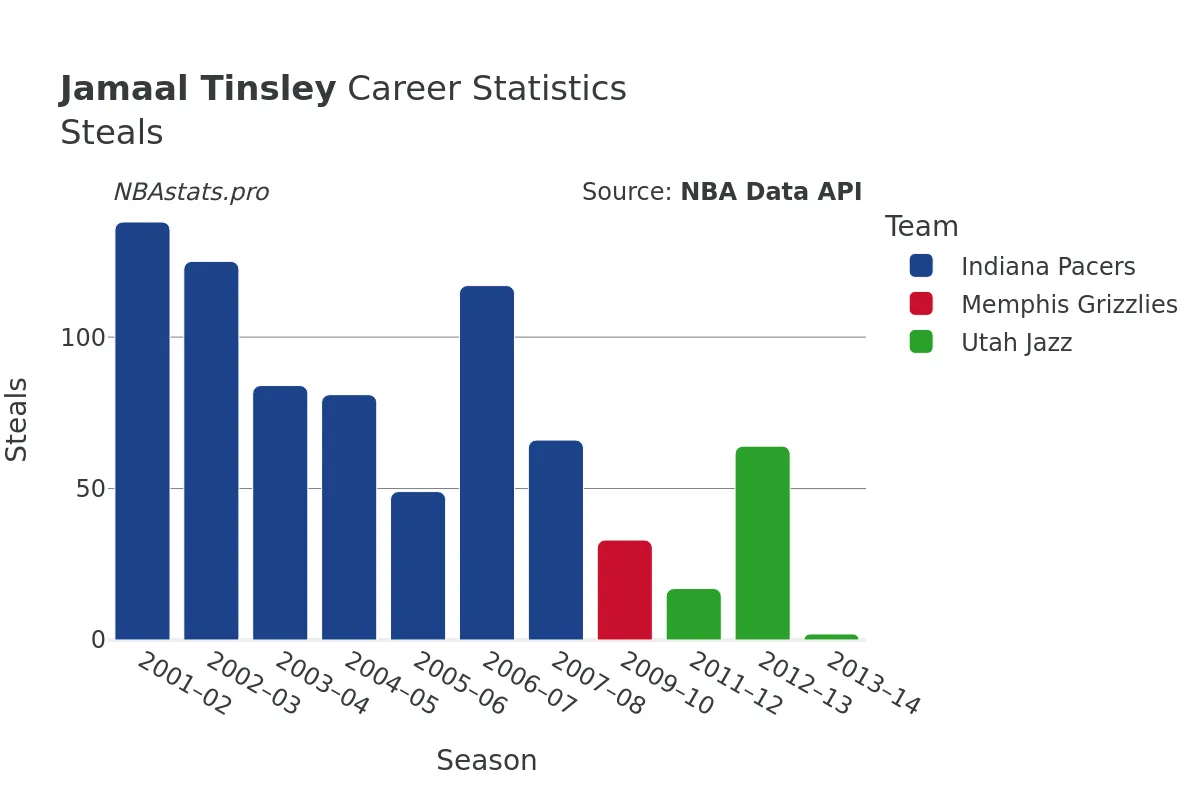
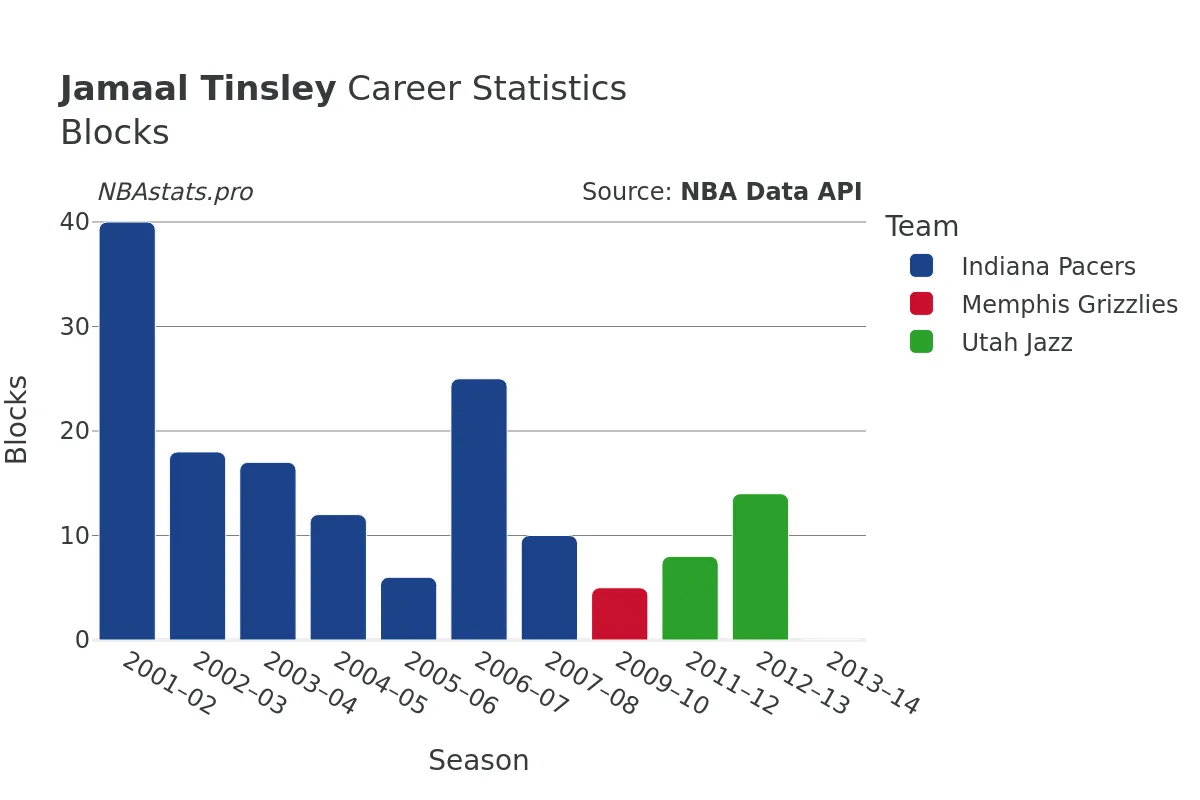
Defensively, Tinsley was a disruptive force, tallying 776 steals and 155 blocks over the course of his career. His ability to anticipate passing lanes and force turnovers added another dimension to his game, making him a valuable asset on both ends of the floor. While his contributions may not always have been flashy or eye-catching, Tinsley's impact was felt in the subtle nuances of his play, whether it be his timely steal, a crafty assist, or a crucial defensive stop.
As a veteran player who brought a wealth of experience and basketball IQ to every team he played for, Tinsley's influence extended beyond the box score. His leadership on the court, coupled with his ability to mentor younger players and guide them through the rigors of the NBA, solidified his status as a respected figure in the league. Despite facing challenges and setbacks along the way, Tinsley's perseverance and resilience were unwavering, exemplifying the grit and determination that define a true competitor.
In retrospect, Jamaal Tinsley's career serves as a testament to the enduring impact of a player who approaches the game with intelligence, precision, and heart. While his name may not always be the first to come to mind when discussing NBA legends, those who had the opportunity to witness Tinsley weave his magic on the court know that his contributions were invaluable. To truly appreciate the essence of Jamaal Tinsley, dive into the detailed charts and statistics that capture the essence of his playing style, and discover the nuances that made him a standout player in the world of professional basketball.
Read more
Games Played
Points
Assists
Rebounds
Steals
Minutes Played
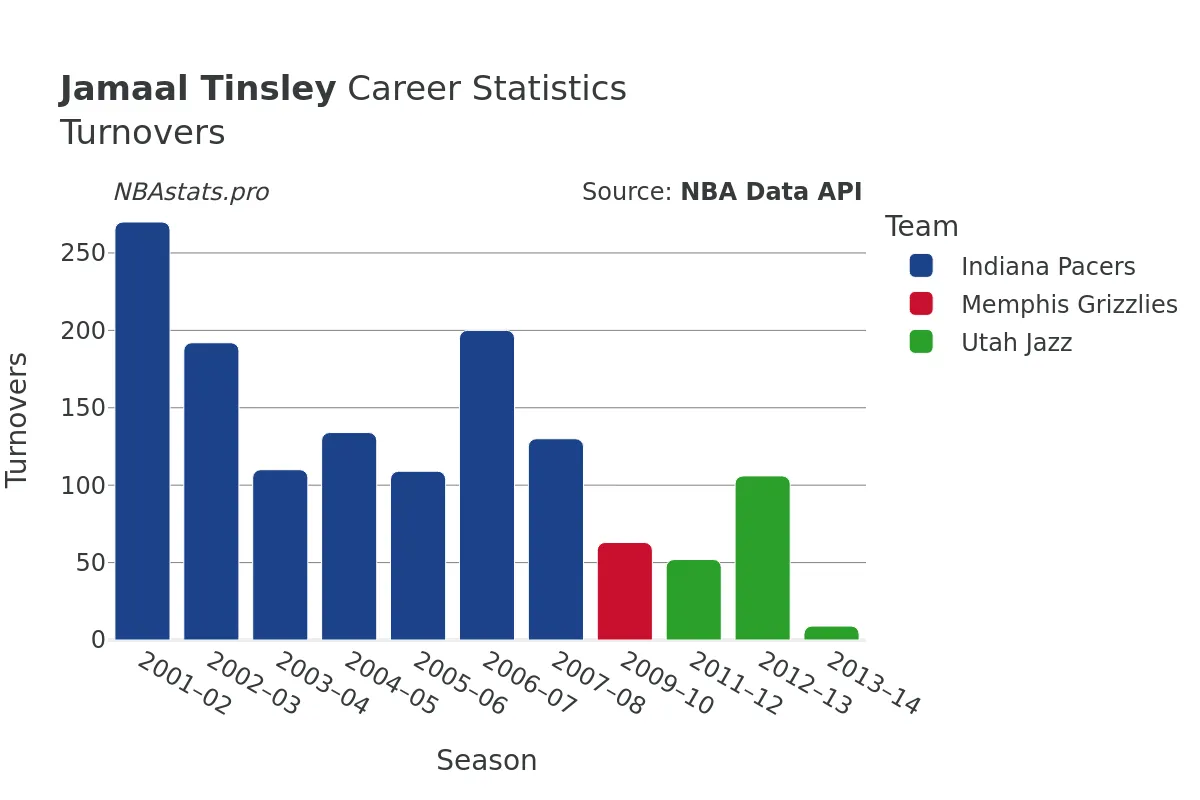
Turnovers
Blocks
Jamaal Tinsley Career Stats Table
| SEASON | TEAM | AGE | GP | GS | MIN | FGM | FGA | FG % | FG3M | FG3A | FG3 % | FTM | FTA | FT % | OREB | DREB | REB | AST | STL | BLK | TOV | PF | PTS | |
|---|---|---|---|---|---|---|---|---|---|---|---|---|---|---|---|---|---|---|---|---|---|---|---|---|
| 1 | 2001-02 | IND | 24 | 80 | 78 | 2,443 | 289 | 760 | 38.0% | 42 | 175 | 24.0% | 131 | 186 | 70.4% | 78 | 220 | 298 | 647 | 138 | 40 | 270 | 248 | 751 |
| 2 | 2002-03 | IND | 25 | 73 | 69 | 2,238 | 220 | 556 | 39.6% | 46 | 166 | 27.7% | 80 | 112 | 71.4% | 58 | 202 | 260 | 548 | 125 | 18 | 192 | 201 | 566 |
| 3 | 2003-04 | IND | 26 | 52 | 43 | 1,377 | 153 | 370 | 41.4% | 77 | 207 | 37.2% | 49 | 67 | 73.1% | 28 | 108 | 136 | 303 | 84 | 17 | 110 | 132 | 432 |
| 4 | 2004-05 | IND | 27 | 40 | 40 | 1,301 | 218 | 522 | 41.8% | 58 | 156 | 37.2% | 122 | 164 | 74.4% | 26 | 134 | 160 | 257 | 81 | 12 | 134 | 112 | 616 |
| 5 | 2005-06 | IND | 28 | 42 | 27 | 1,122 | 158 | 386 | 40.9% | 16 | 70 | 22.9% | 58 | 91 | 63.7% | 35 | 98 | 133 | 211 | 49 | 6 | 109 | 96 | 390 |
| 6 | 2006-07 | IND | 29 | 72 | 72 | 2,243 | 346 | 889 | 38.9% | 61 | 193 | 31.6% | 172 | 239 | 72.0% | 60 | 180 | 240 | 494 | 117 | 25 | 200 | 190 | 925 |
| 7 | 2007-08 | IND | 30 | 39 | 36 | 1,293 | 176 | 463 | 38.0% | 40 | 141 | 28.4% | 72 | 100 | 72.0% | 24 | 117 | 141 | 326 | 66 | 10 | 130 | 97 | 464 |
| 8 | 2009-10 | MEM | 32 | 38 | 1 | 589 | 52 | 140 | 37.1% | 7 | 39 | 17.9% | 22 | 27 | 81.5% | 11 | 55 | 66 | 108 | 33 | 5 | 63 | 67 | 133 |
| 9 | 2011-12 | UTA | 34 | 37 | 1 | 507 | 57 | 141 | 40.4% | 10 | 37 | 27.0% | 13 | 17 | 76.5% | 6 | 39 | 45 | 123 | 17 | 8 | 52 | 47 | 137 |
| 10 | 2012-13 | UTA | 35 | 66 | 32 | 1,221 | 86 | 234 | 36.8% | 39 | 127 | 30.7% | 18 | 26 | 69.2% | 17 | 98 | 115 | 290 | 64 | 14 | 106 | 106 | 229 |
| 11 | 2013-14 | UTA | 36 | 8 | 5 | 110 | 4 | 20 | 20.0% | 1 | 15 | 6.7% | 0 | 0 | 0.0% | 2 | 9 | 11 | 23 | 2 | 0 | 9 | 10 | 9 |
Max Min
NBA Alltime Leaders
Games Played
Robert Parish: 1,611Kareem Abdul-Jabbar: 1,560
Vince Carter: 1,541
Dirk Nowitzki: 1,522
John Stockton: 1,504
Points
LeBron James: 40,474Kareem Abdul-Jabbar: 38,387
Karl Malone: 36,928
Kobe Bryant: 33,643
Michael Jordan: 32,292
Steals
John Stockton: 3,265Jason Kidd: 2,684
Chris Paul: 2,614
Michael Jordan: 2,514
Gary Payton: 2,445
Free Throws Made
Karl Malone: 9,787Moses Malone: 8,531
LeBron James: 8,390
Kobe Bryant: 8,378
Oscar Robertson: 7,694