JR Smith Stats: NBA Career

Welcome to the profile page of JR Smith, the sharpshooting NBA player who made waves with his incredible scoring ability and knack for hitting clutch shots throughout his career. With stints in various teams across different states, JR Smith's journey in the NBA is one filled with ups and downs, but his impact on the court cannot be denied.
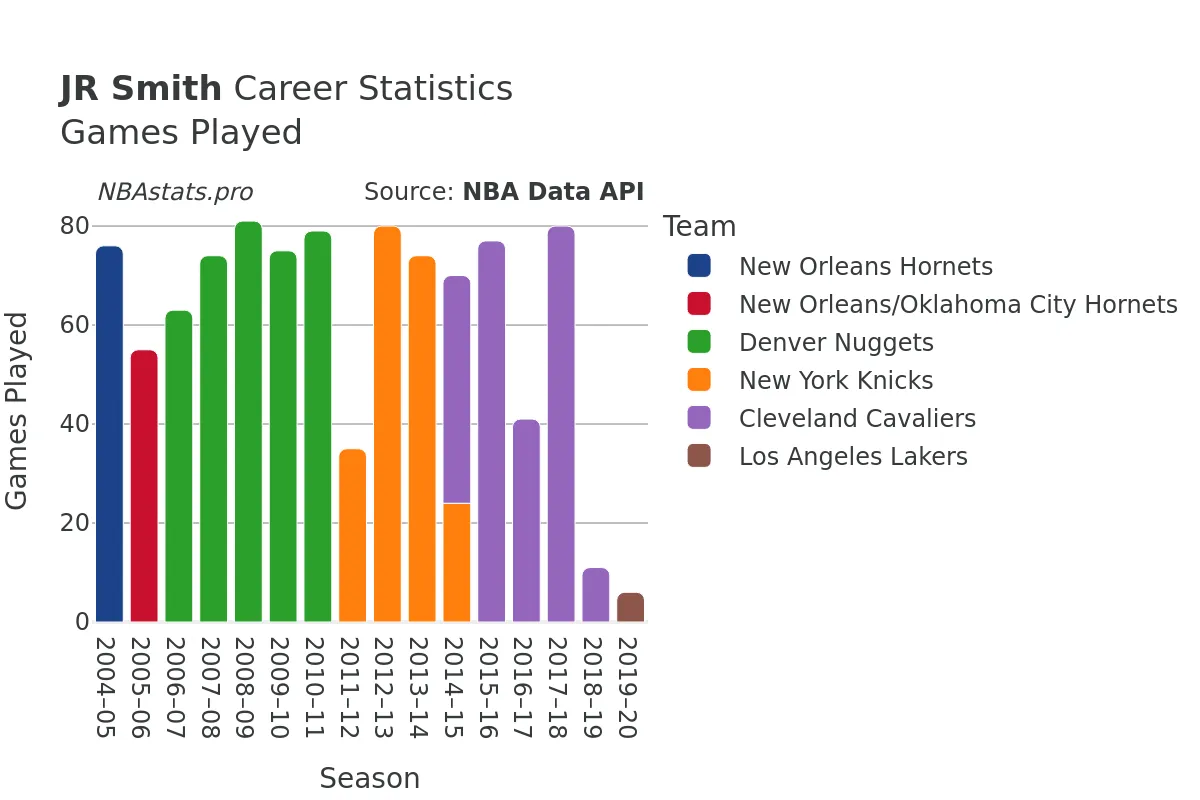
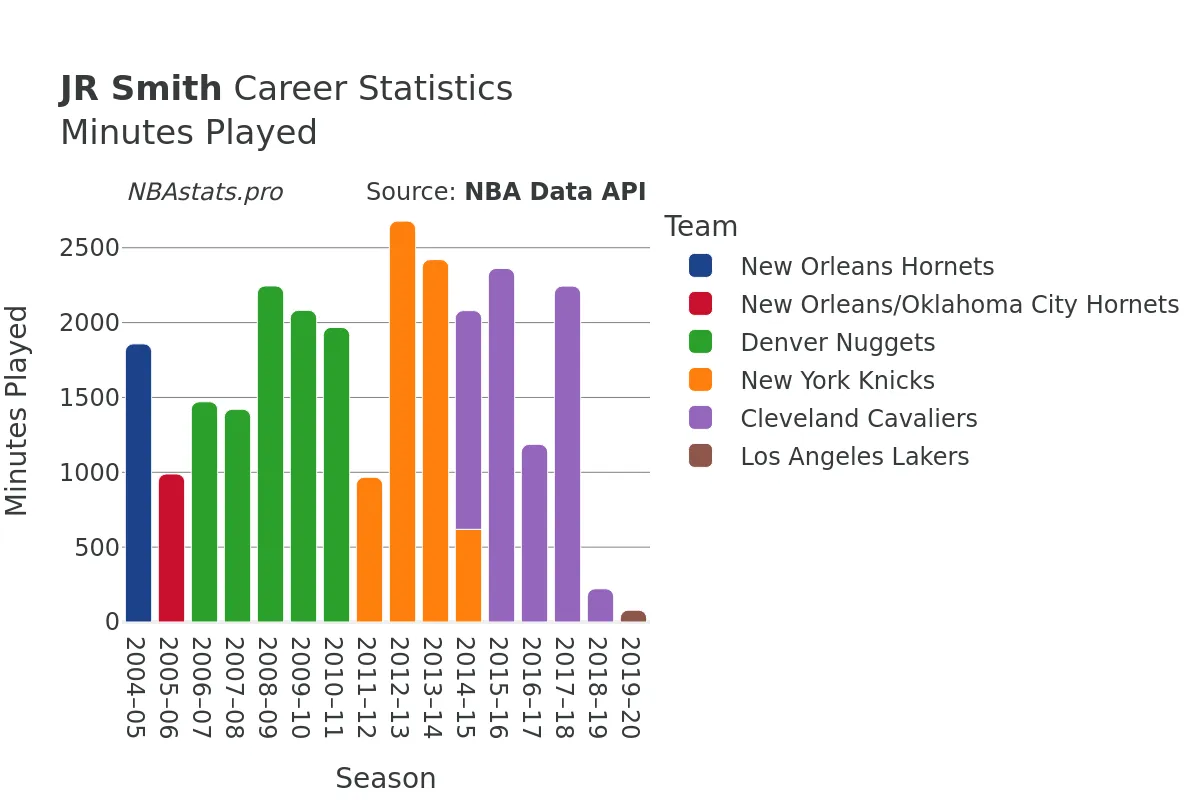
JR Smith began his professional basketball career in the 2004-05 NBA season at just 19 years old, showcasing his raw talent and potential from the get-go. O...ver the span of 16 seasons, he played a total of 1047 games, accumulating an impressive 28,353 minutes on the court. His offensive prowess is evident in his 11,220 field goals attempted, with 4,695 finding the bottom of the net, giving him a field goal percentage of 41.8%.
One of JR Smith's strengths as a player was his ability to draw fouls and get to the free-throw line. He attempted 2,062 free throws and made 1,512 of them, showcasing his confidence and reliability in crucial moments at the charity stripe. His free throw percentage further solidifies his status as a clutch player known for stepping up when the pressure is on.
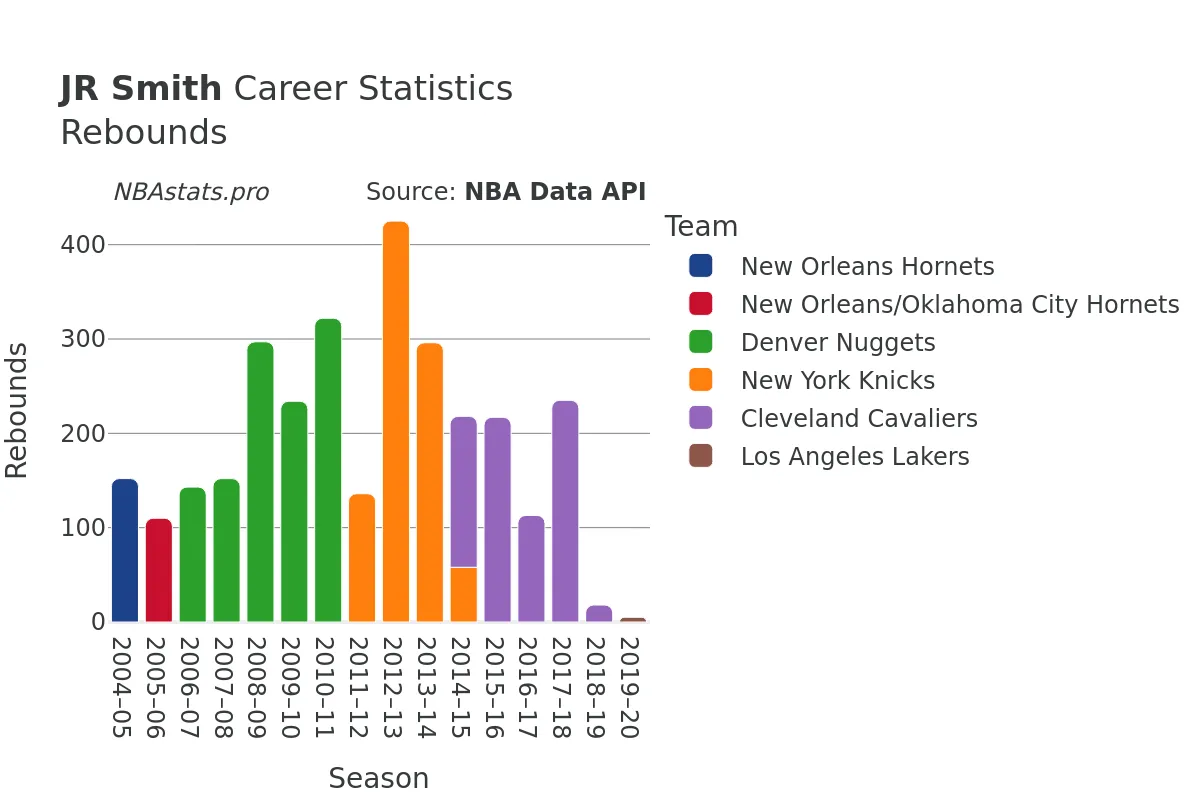
Rebounding was another aspect of JR Smith's game where he excelled, pulling down a total of 3,291 rebounds throughout his career. His tenacity on the boards is highlighted by his 2,767 defensive rebounds and 524 offensive rebounds, showing his willingness to crash the glass and contribute in every aspect of the game.
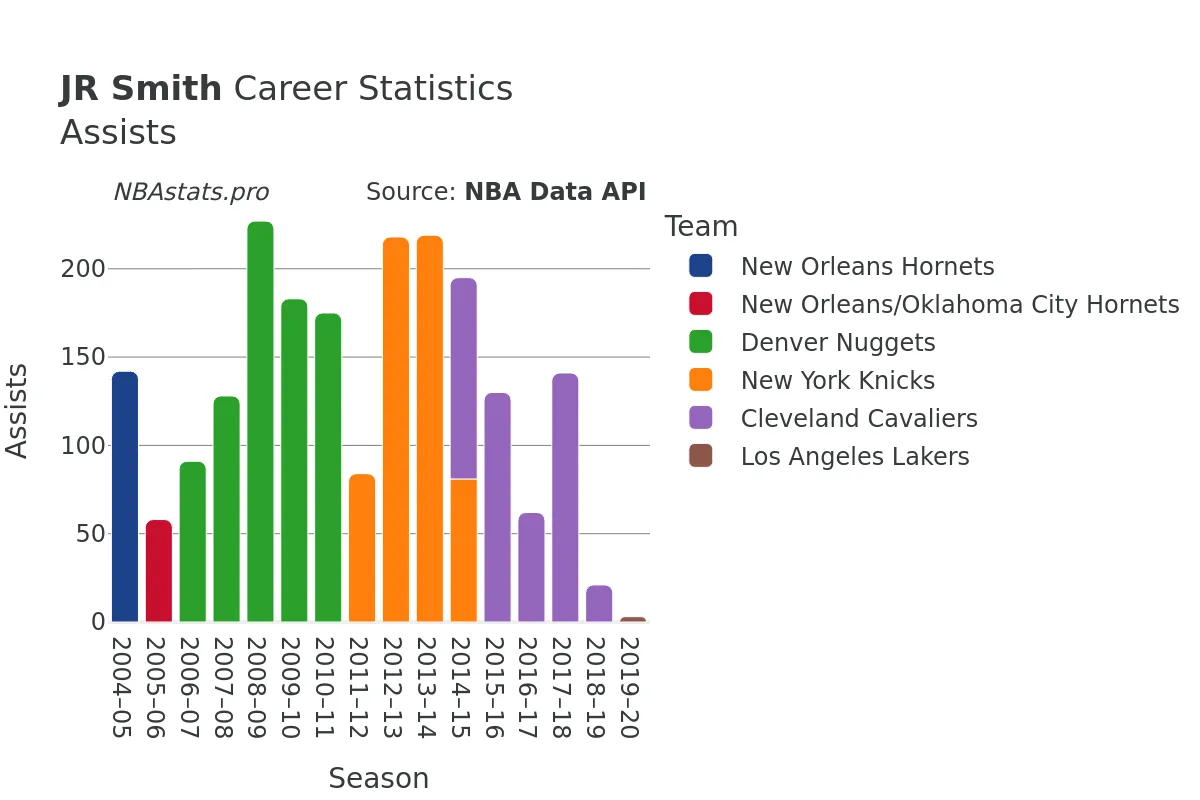
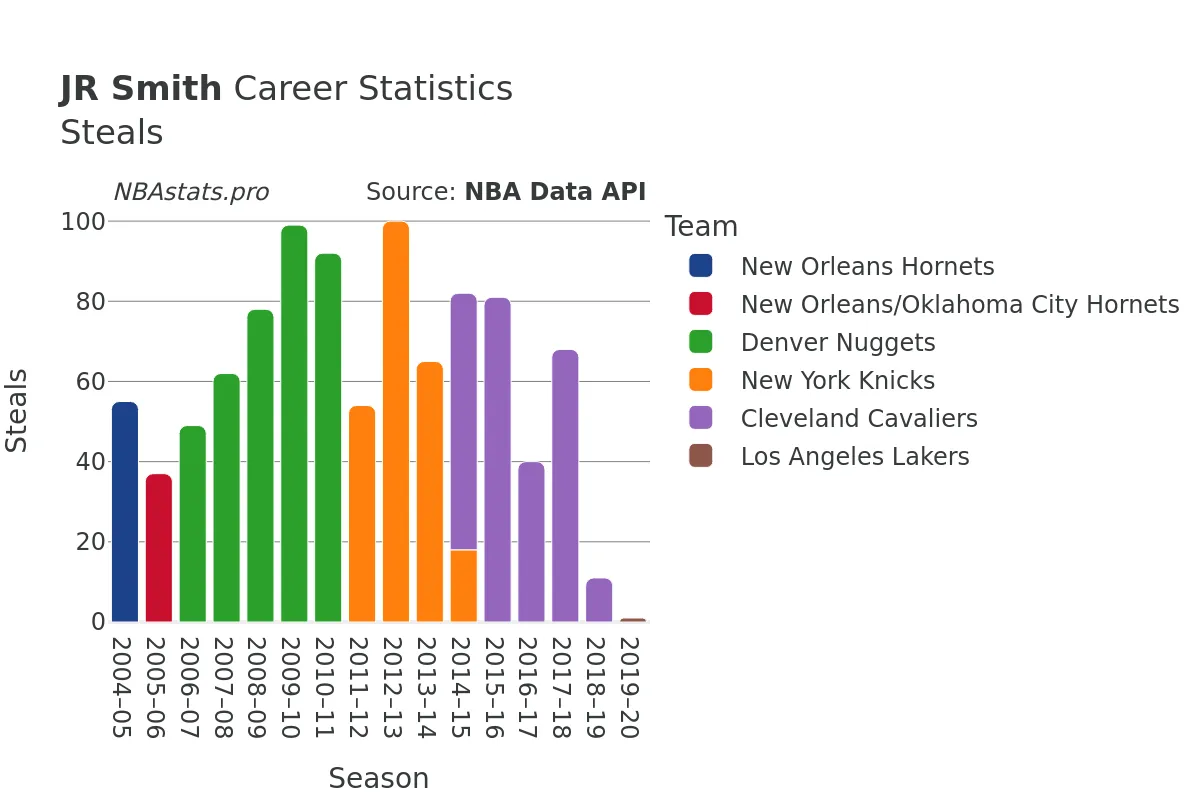
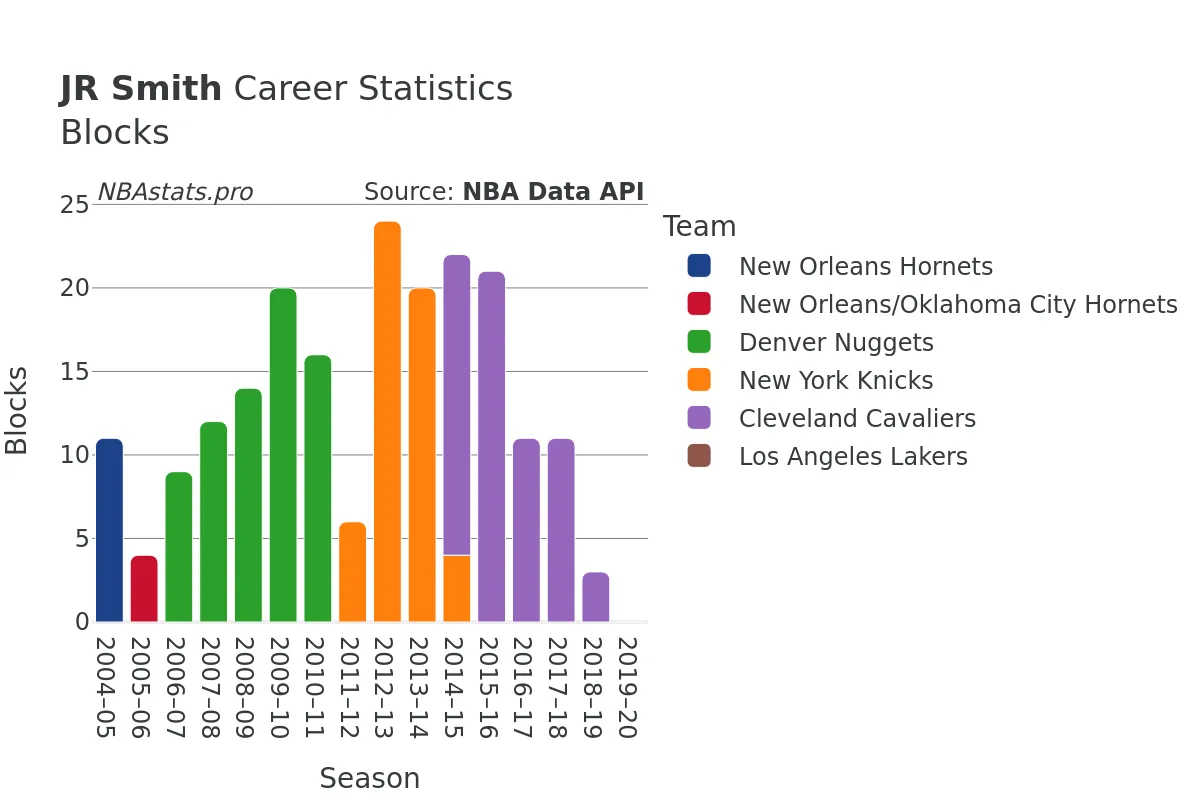
In addition to scoring and rebounding, JR Smith was a willing facilitator on the court, amassing 2,272 assists over his career. His court vision and playmaking ability allowed him to create opportunities for his teammates and elevate the overall performance of the team. Furthermore, JR Smith was a defensive stalwart, recording an impressive 1,056 steals and 226 blocks, showcasing his versatility and impact on both ends of the floor.
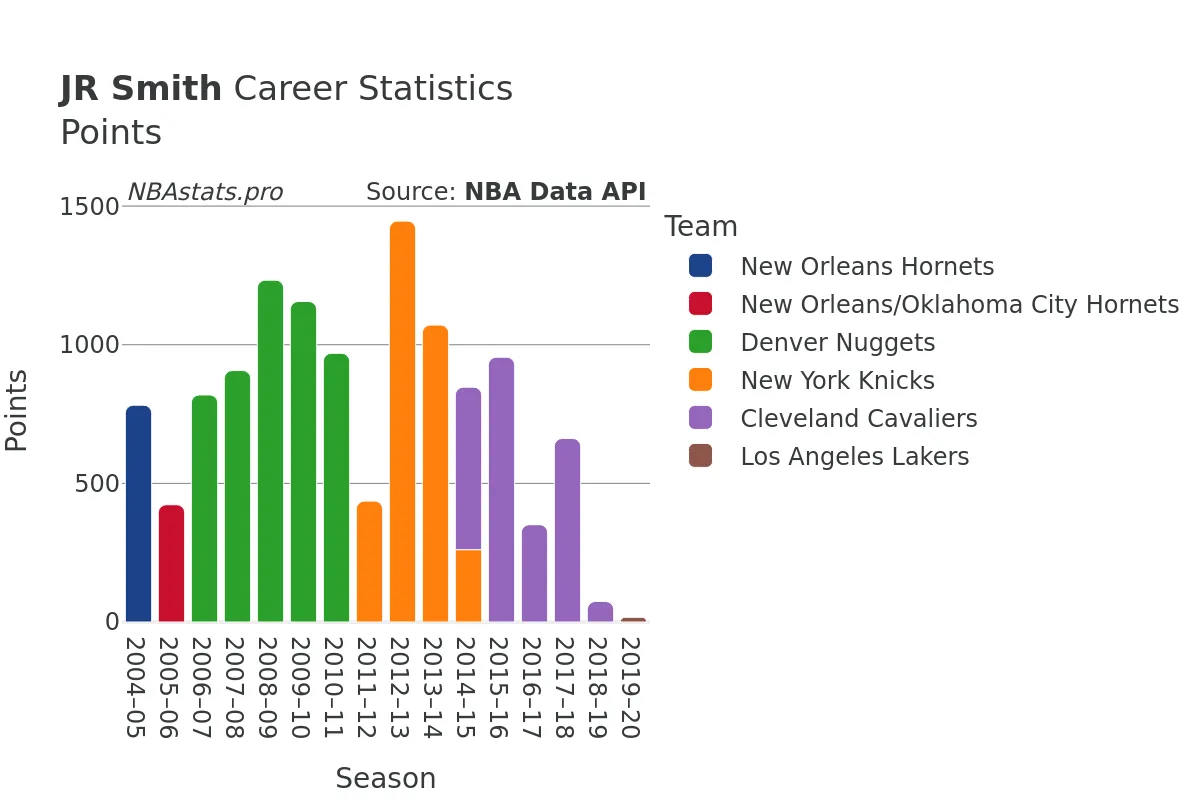
When it comes to scoring, JR Smith was a prolific scorer throughout his career, totaling 12,995 points. His ability to score in a variety of ways, whether it be from beyond the arc, driving to the basket, or knocking down mid-range jumpers, made him a constant offensive threat that opposing teams had to respect and game plan for.
Throughout his career, JR Smith brought a level of excitement and energy to the court that endeared him to fans across the league. His confidence, swagger, and fearlessness in big moments made him a fan favorite and a player that could change the course of a game with his scoring outbursts.
As we delve deeper into the statistics and charts on JR Smith's profile page, we get a clearer picture of the impact he had on the teams he played for and the legacy he leaves behind in the NBA. So, come explore the numbers, analyze the trends, and discover the story of JR Smith, a player who left an indelible mark on the game of basketball.
Read more
Games Played
Points
Assists
Rebounds
Steals
Minutes Played
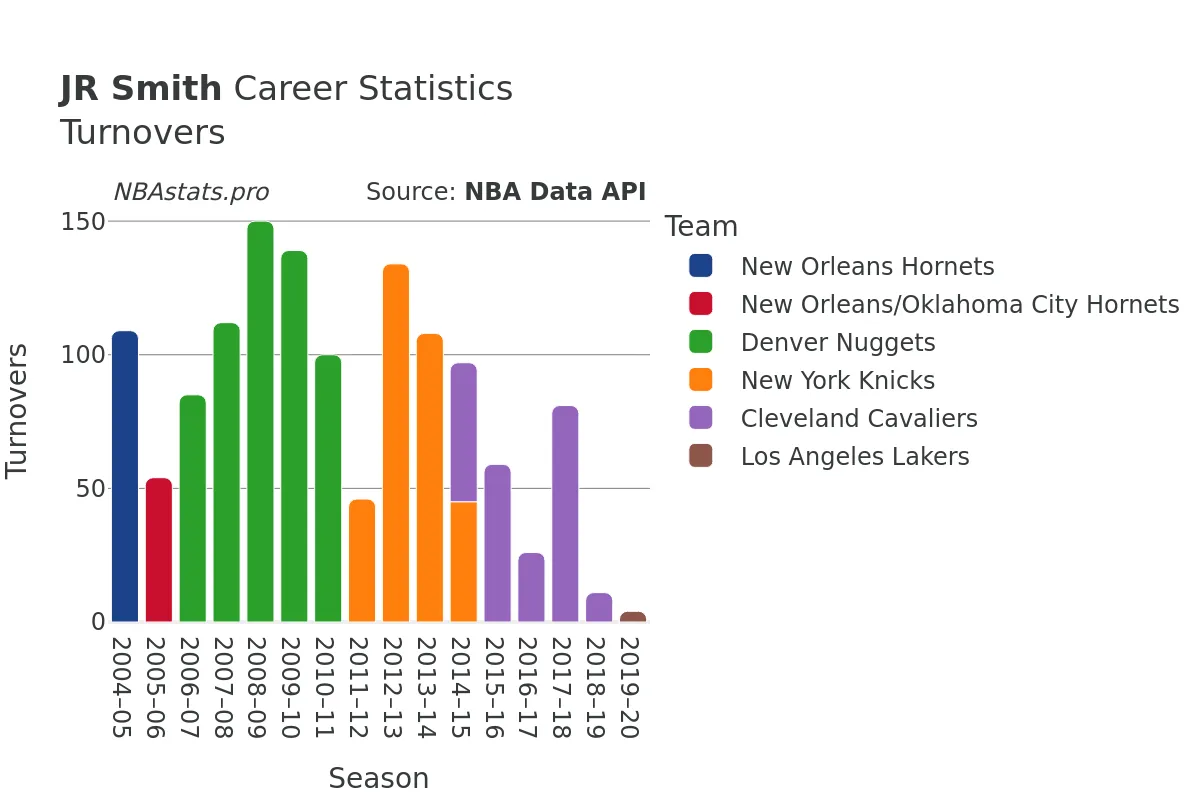
Turnovers
Blocks
JR Smith Career Stats Table
| SEASON | TEAM | AGE | GP | GS | MIN | FGM | FGA | FG % | FG3M | FG3A | FG3 % | FTM | FTA | FT % | OREB | DREB | REB | AST | STL | BLK | TOV | PF | PTS | |
|---|---|---|---|---|---|---|---|---|---|---|---|---|---|---|---|---|---|---|---|---|---|---|---|---|
| 1 | 2004-05 | NOH | 19 | 76 | 56 | 1,858 | 295 | 748 | 39.4% | 81 | 281 | 28.8% | 111 | 161 | 68.9% | 39 | 113 | 152 | 142 | 55 | 11 | 109 | 135 | 782 |
| 2 | 2005-06 | NOK | 20 | 55 | 25 | 989 | 144 | 366 | 39.3% | 52 | 140 | 37.1% | 83 | 101 | 82.2% | 19 | 91 | 110 | 58 | 37 | 4 | 54 | 90 | 423 |
| 3 | 2006-07 | DEN | 21 | 63 | 24 | 1,471 | 284 | 644 | 44.1% | 149 | 382 | 39.0% | 102 | 126 | 81.0% | 30 | 113 | 143 | 91 | 49 | 9 | 85 | 147 | 819 |
| 4 | 2007-08 | DEN | 22 | 74 | 0 | 1,421 | 311 | 674 | 46.1% | 157 | 390 | 40.3% | 128 | 178 | 71.9% | 43 | 109 | 152 | 128 | 62 | 12 | 112 | 144 | 907 |
| 5 | 2008-09 | DEN | 23 | 81 | 18 | 2,245 | 424 | 950 | 44.6% | 180 | 453 | 39.7% | 205 | 272 | 75.4% | 43 | 254 | 297 | 227 | 78 | 14 | 150 | 190 | 1,233 |
| 6 | 2009-10 | DEN | 24 | 75 | 0 | 2,082 | 428 | 1,033 | 41.4% | 158 | 467 | 33.8% | 142 | 201 | 70.6% | 28 | 206 | 234 | 183 | 99 | 20 | 139 | 174 | 1,156 |
| 7 | 2010-11 | DEN | 25 | 79 | 6 | 1,968 | 341 | 784 | 43.5% | 124 | 318 | 39.0% | 163 | 221 | 73.8% | 45 | 277 | 322 | 175 | 92 | 16 | 100 | 173 | 969 |
| 8 | 2011-12 | NYK | 26 | 35 | 1 | 967 | 165 | 405 | 40.7% | 67 | 193 | 34.7% | 39 | 55 | 70.9% | 29 | 107 | 136 | 84 | 54 | 6 | 46 | 87 | 436 |
| 9 | 2012-13 | NYK | 27 | 80 | 0 | 2,678 | 527 | 1,249 | 42.2% | 155 | 436 | 35.6% | 237 | 311 | 76.2% | 64 | 361 | 425 | 218 | 100 | 24 | 134 | 226 | 1,446 |
| 10 | 2013-14 | NYK | 28 | 74 | 37 | 2,421 | 396 | 955 | 41.5% | 189 | 480 | 39.4% | 90 | 138 | 65.2% | 35 | 261 | 296 | 219 | 65 | 20 | 108 | 196 | 1,071 |
| 11 | 2014-15 | NYK | 29 | 24 | 6 | 619 | 101 | 251 | 40.2% | 32 | 90 | 35.6% | 27 | 39 | 69.2% | 4 | 54 | 58 | 81 | 18 | 4 | 45 | 44 | 261 |
| 12 | 2014-15 | CLE | 29 | 46 | 45 | 1,461 | 214 | 504 | 42.5% | 131 | 336 | 39.0% | 27 | 33 | 81.8% | 26 | 134 | 160 | 114 | 64 | 18 | 52 | 119 | 586 |
| 13 | 2014-15 | TOT | 29 | 70 | 51 | 2,079 | 315 | 755 | 41.7% | 163 | 426 | 38.3% | 54 | 72 | 75.0% | 30 | 188 | 218 | 195 | 82 | 22 | 97 | 163 | 847 |
| 14 | 2015-16 | CLE | 30 | 77 | 77 | 2,362 | 353 | 850 | 41.5% | 204 | 510 | 40.0% | 45 | 71 | 63.4% | 43 | 174 | 217 | 130 | 81 | 21 | 59 | 204 | 955 |
| 15 | 2016-17 | CLE | 31 | 41 | 35 | 1,187 | 123 | 356 | 34.6% | 95 | 271 | 35.1% | 10 | 15 | 66.7% | 17 | 96 | 113 | 62 | 40 | 11 | 26 | 77 | 351 |
| 16 | 2017-18 | CLE | 32 | 80 | 61 | 2,244 | 240 | 595 | 40.3% | 143 | 381 | 37.5% | 39 | 56 | 69.6% | 29 | 206 | 235 | 141 | 68 | 11 | 81 | 161 | 662 |
| 17 | 2018-19 | CLE | 33 | 11 | 4 | 222 | 27 | 79 | 34.2% | 12 | 39 | 30.8% | 8 | 10 | 80.0% | 0 | 18 | 18 | 21 | 11 | 3 | 11 | 19 | 74 |
| 18 | 2019-20 | LAL | 34 | 6 | 0 | 79 | 7 | 22 | 31.8% | 1 | 11 | 9.1% | 2 | 2 | 100.0% | 0 | 5 | 5 | 3 | 1 | 0 | 4 | 5 | 17 |
Max Min
NBA Alltime Leaders
Games Played
Robert Parish: 1,611Kareem Abdul-Jabbar: 1,560
Vince Carter: 1,541
Dirk Nowitzki: 1,522
John Stockton: 1,504
Points
LeBron James: 40,474Kareem Abdul-Jabbar: 38,387
Karl Malone: 36,928
Kobe Bryant: 33,643
Michael Jordan: 32,292
Steals
John Stockton: 3,265Jason Kidd: 2,684
Chris Paul: 2,614
Michael Jordan: 2,514
Gary Payton: 2,445
Free Throws Made
Karl Malone: 9,787Moses Malone: 8,531
LeBron James: 8,390
Kobe Bryant: 8,378
Oscar Robertson: 7,694