J.J. Barea Stats: NBA Career

At just 6 feet tall, J.J. Barea may not be the tallest player on the court, but his impact on the game is nothing short of monumental. With a career spanning over a decade in the NBA, Barea has proven himself to be a valuable asset to any team lucky enough to have him on their roster.
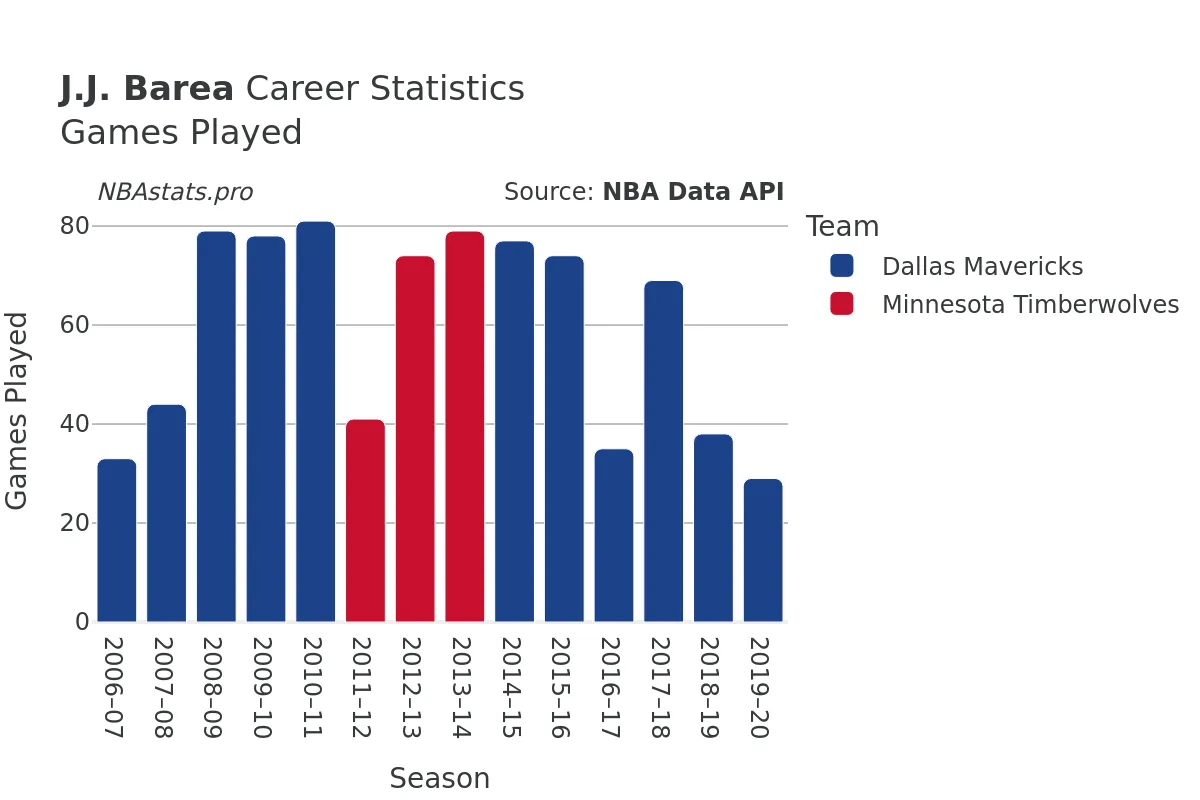
Barea began his NBA journey in the 2006-07 season, starting out with the Dallas Mavericks. Over the years, he also spent time with the Minnesota Timberwolves before eventually retiring at the end of the 2019-20 se...ason. Throughout his career, Barea showcased his skills in two different cities – Dallas, Texas, and Minnesota – leaving a lasting impression wherever he went.
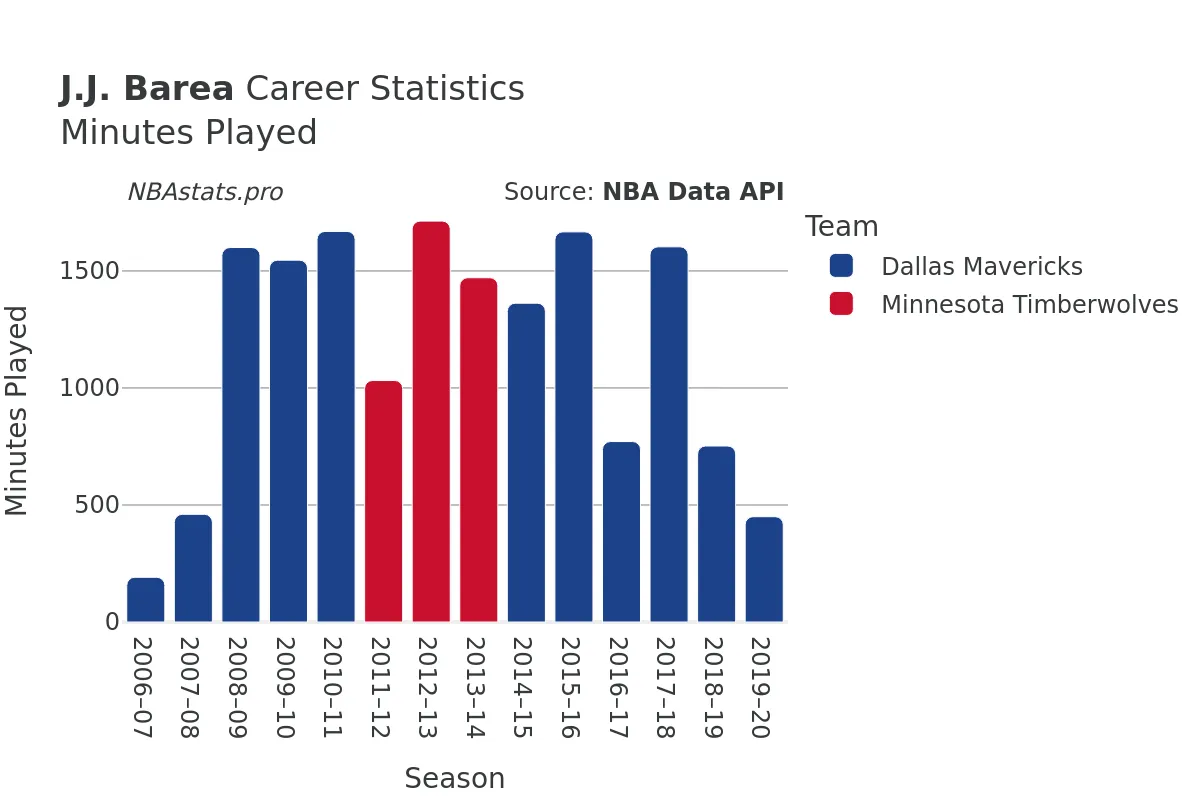
Over the course of 831 games played, Barea accumulated an impressive 16,287 minutes on the court. His sharpshooting abilities were evident in his 42.36% field goal percentage, with 2,832 goals made out of 6,685 attempted. Barea's accuracy extended to the free-throw line as well, where he boasted a solid free-throw percentage.
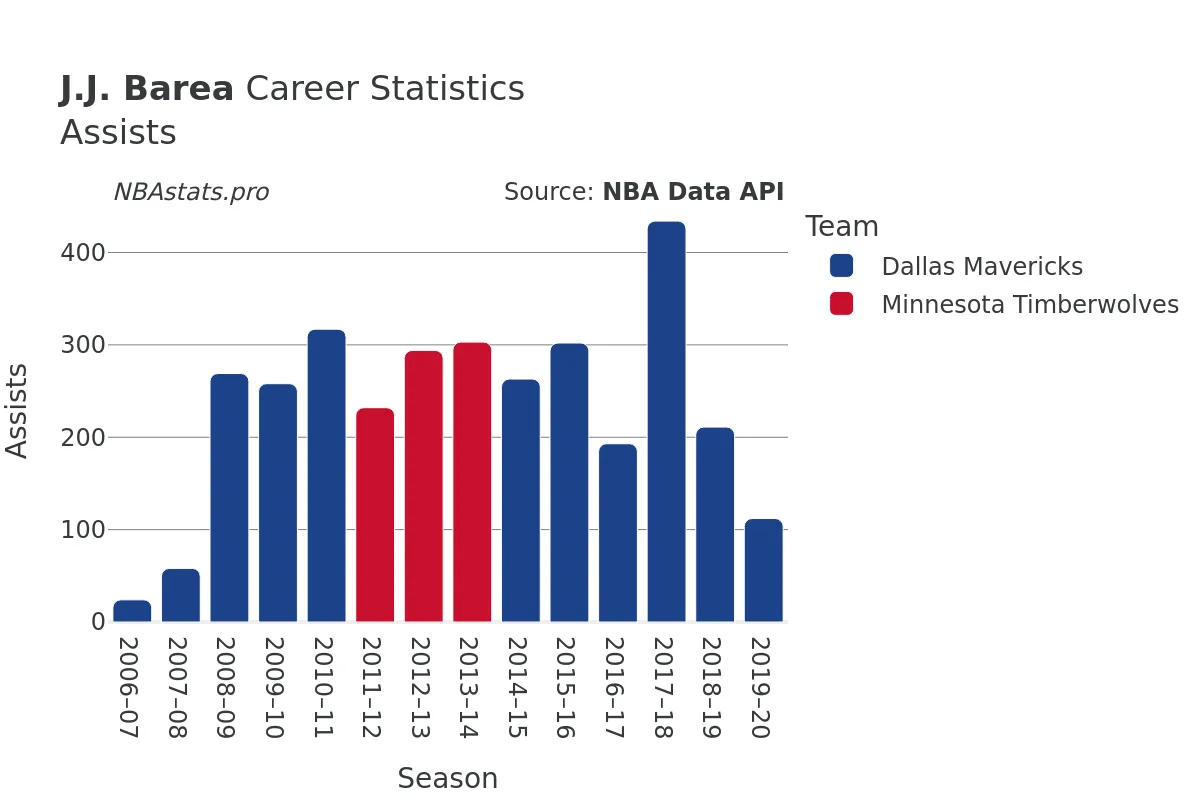
While scoring points is essential in basketball, Barea's contributions went beyond just putting the ball in the basket. He excelled in playmaking, racking up an impressive 3,270 assists throughout his career. His court vision and ability to set up his teammates for scoring opportunities were second to none.
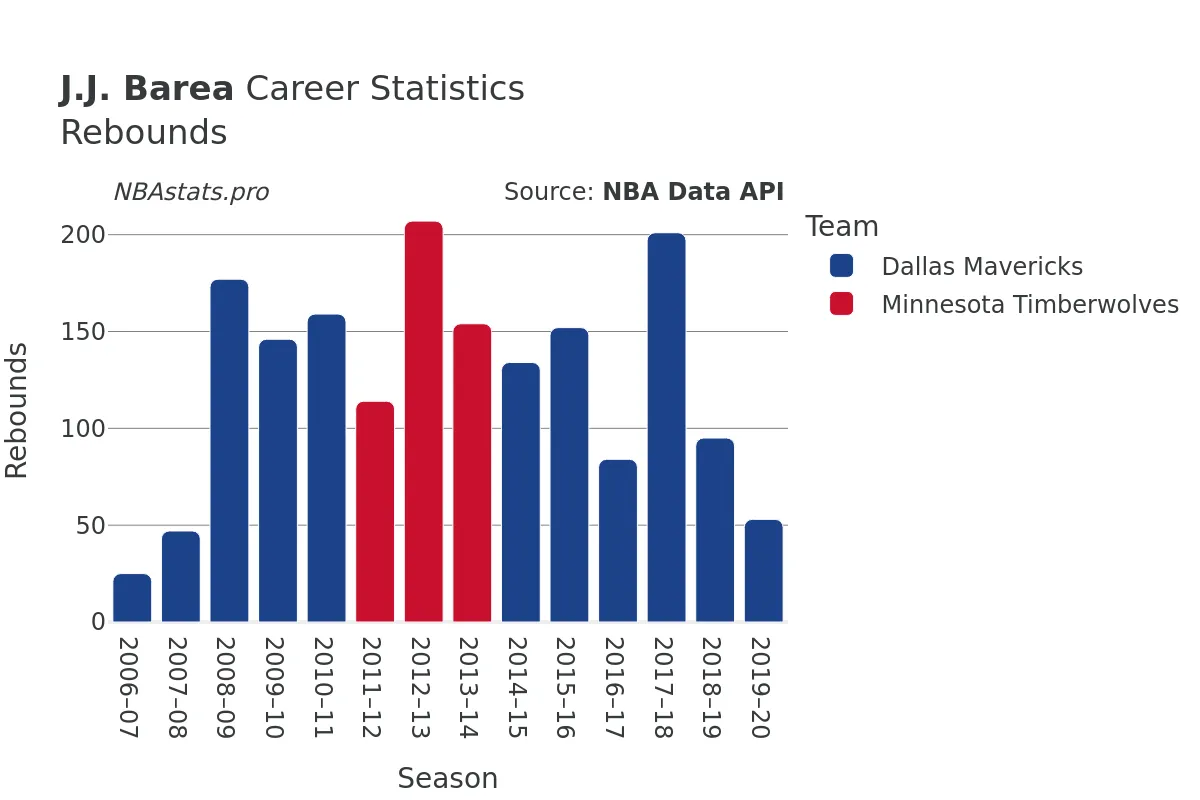
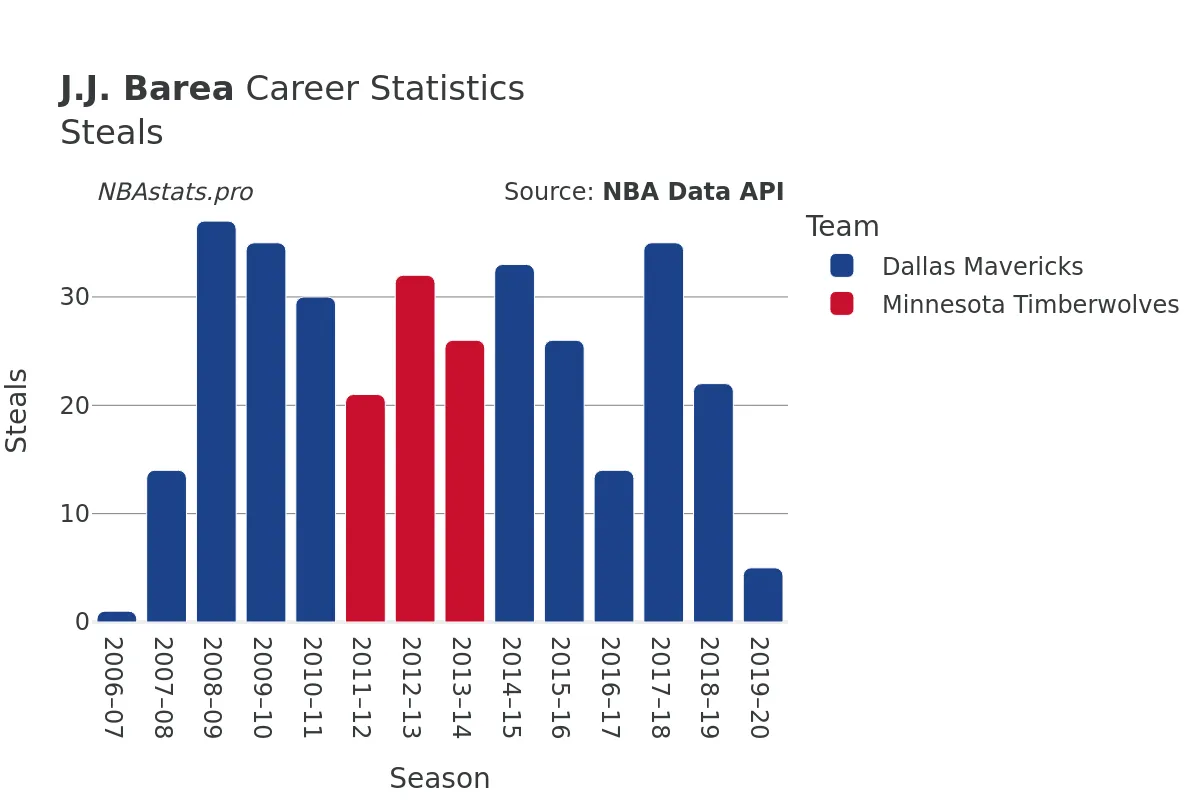
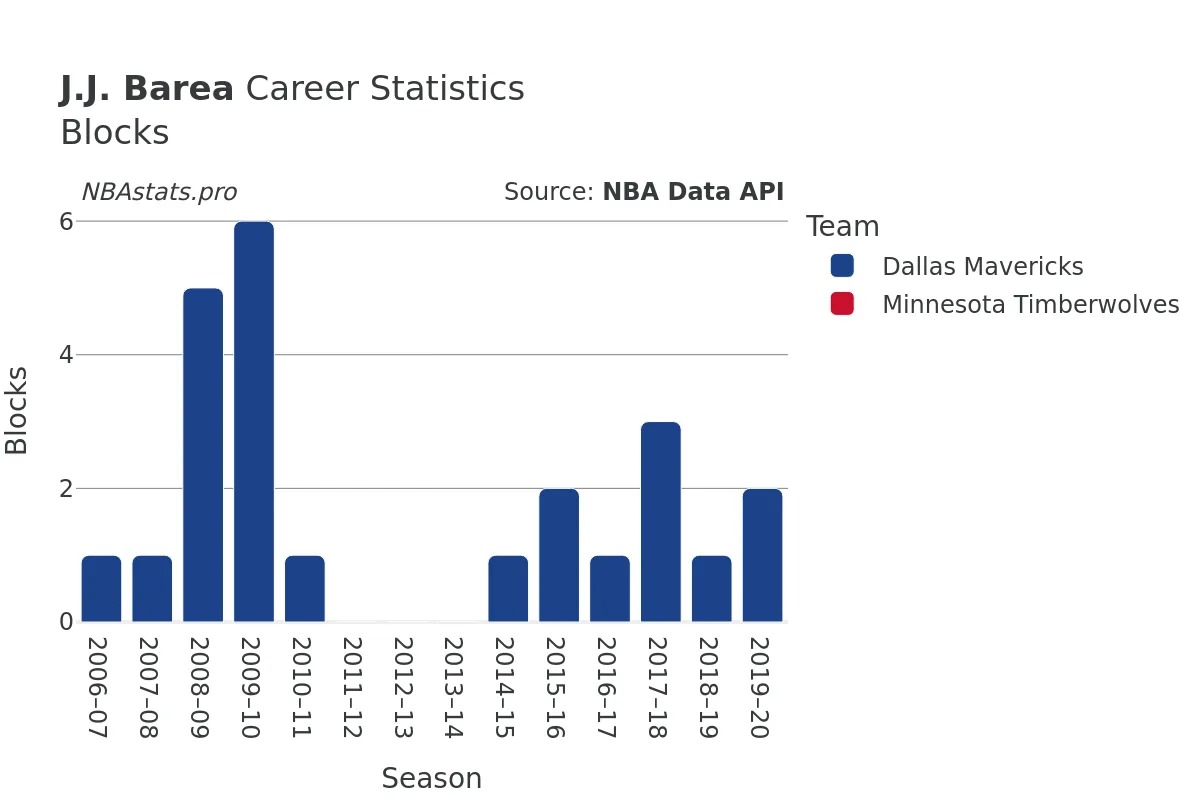
Defensively, Barea held his own, tallying 331 steals and 24 blocks. Despite his smaller stature, he proved to be a tenacious defender who could disrupt plays and create turnovers when needed. His 1,748 total rebounds showcased his willingness to battle in the paint and contribute on both ends of the floor.
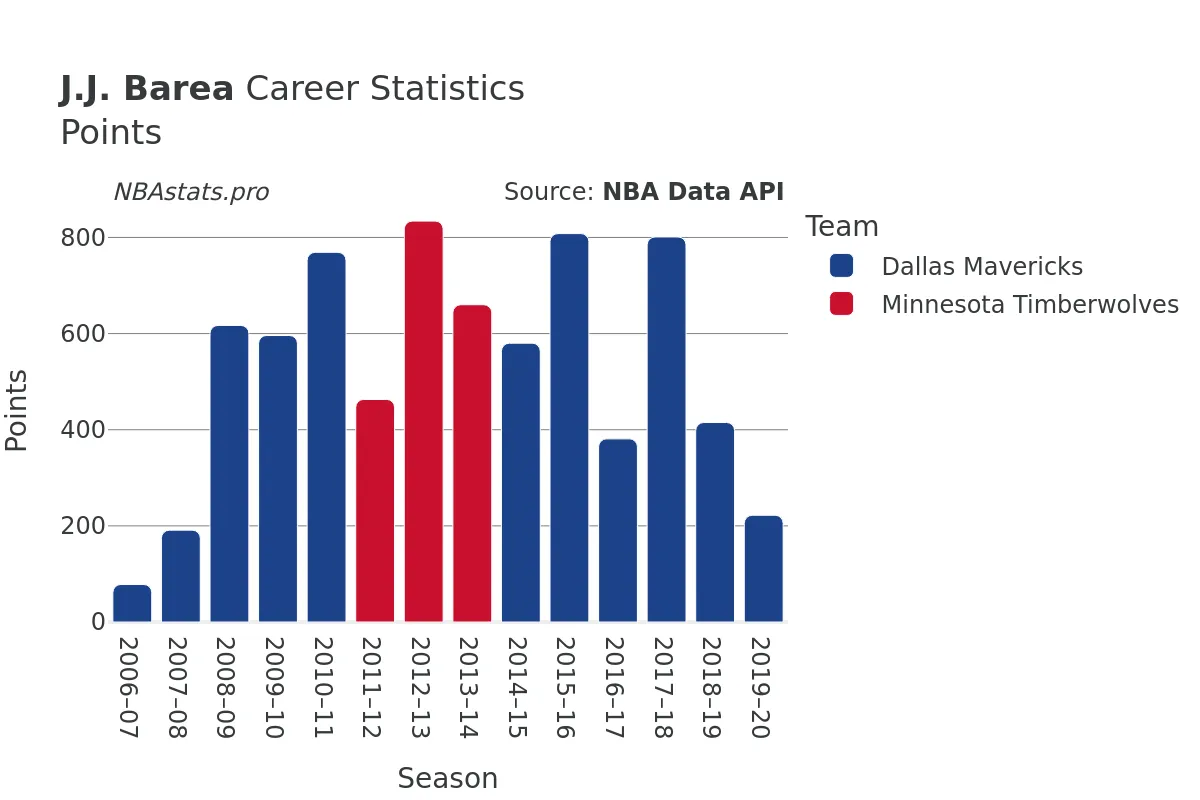
In total, Barea amassed 7,415 points throughout his NBA career, solidifying his status as a reliable scoring threat. Whether driving to the basket or knocking down shots from beyond the arc, he consistently found ways to put up points and make an impact on the game.
Now retired, J.J. Barea's legacy as a skilled and versatile player lives on. His years of dedication, hard work, and passion for the game have left an indelible mark on the teams he played for and the fans who had the privilege of watching him play. As you delve into the charts and statistics that encapsulate Barea's career, you'll gain a deeper appreciation for the talent and tenacity he brought to the basketball court each and every game.
So take a closer look at the numbers, explore the highs and lows of Barea's time in the NBA, and discover what made him such a unique and beloved player in the world of professional basketball. You may just find yourself marveling at the career of this dynamic point guard who defied the odds and left a lasting legacy in the league.
Read more
Games Played
Points
Assists
Rebounds
Steals
Minutes Played
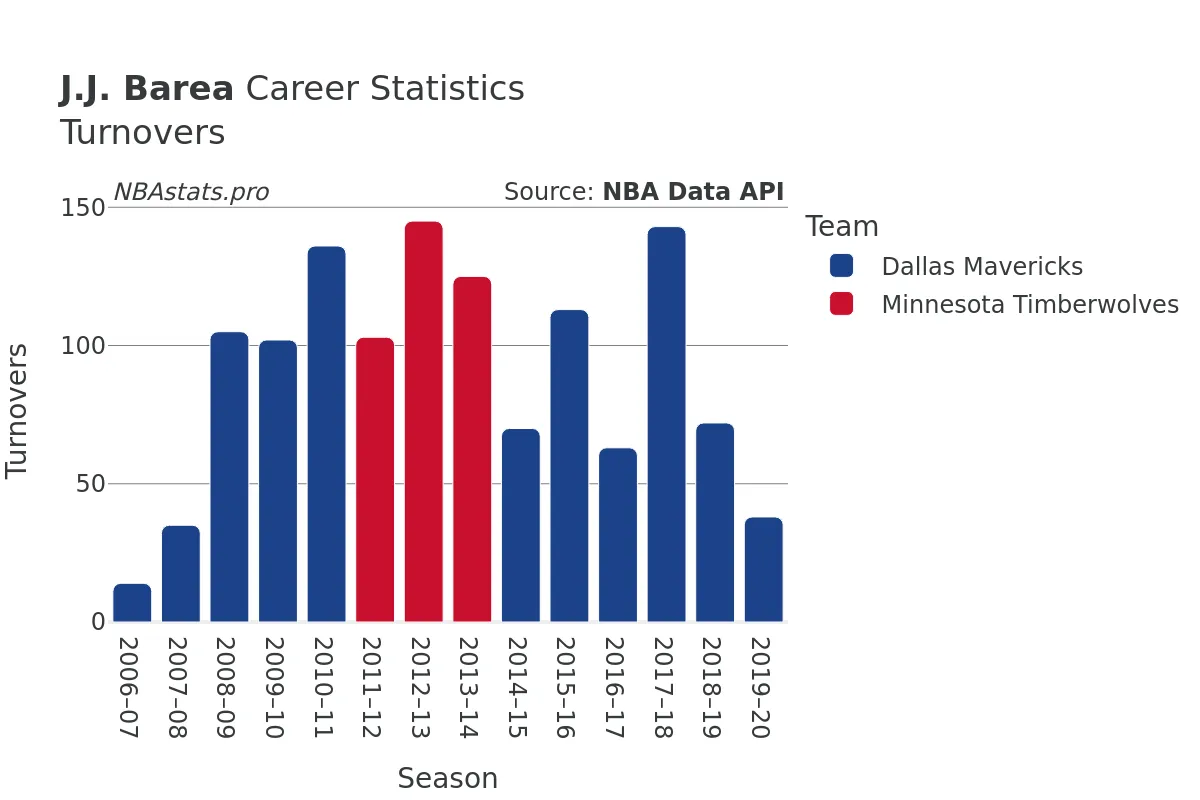
Turnovers
Blocks
J.J. Barea Career Stats Table
| SEASON | TEAM | AGE | GP | GS | MIN | FGM | FGA | FG % | FG3M | FG3A | FG3 % | FTM | FTA | FT % | OREB | DREB | REB | AST | STL | BLK | TOV | PF | PTS | |
|---|---|---|---|---|---|---|---|---|---|---|---|---|---|---|---|---|---|---|---|---|---|---|---|---|
| 1 | 2006-07 | DAL | 23 | 33 | 1 | 191 | 28 | 78 | 35.9% | 6 | 21 | 28.6% | 16 | 24 | 66.7% | 7 | 18 | 25 | 24 | 1 | 1 | 14 | 19 | 78 |
| 2 | 2007-08 | DAL | 24 | 44 | 9 | 460 | 71 | 170 | 41.8% | 21 | 54 | 38.9% | 28 | 35 | 80.0% | 4 | 43 | 47 | 58 | 14 | 1 | 35 | 48 | 191 |
| 3 | 2008-09 | DAL | 25 | 79 | 15 | 1,600 | 246 | 557 | 44.2% | 55 | 154 | 35.7% | 70 | 93 | 75.3% | 36 | 141 | 177 | 269 | 37 | 5 | 105 | 121 | 617 |
| 4 | 2009-10 | DAL | 26 | 78 | 18 | 1,546 | 232 | 527 | 44.0% | 56 | 157 | 35.7% | 76 | 90 | 84.4% | 17 | 129 | 146 | 258 | 35 | 6 | 102 | 119 | 596 |
| 5 | 2010-11 | DAL | 27 | 81 | 2 | 1,669 | 285 | 649 | 43.9% | 66 | 189 | 34.9% | 133 | 157 | 84.7% | 29 | 130 | 159 | 317 | 30 | 1 | 136 | 136 | 769 |
| 6 | 2011-12 | MIN | 28 | 41 | 11 | 1,032 | 167 | 418 | 40.0% | 53 | 143 | 37.1% | 76 | 98 | 77.6% | 14 | 100 | 114 | 232 | 21 | 0 | 103 | 61 | 463 |
| 7 | 2012-13 | MIN | 29 | 74 | 2 | 1,713 | 316 | 758 | 41.7% | 97 | 280 | 34.6% | 105 | 134 | 78.4% | 34 | 173 | 207 | 294 | 32 | 0 | 145 | 131 | 834 |
| 8 | 2013-14 | MIN | 30 | 79 | 1 | 1,471 | 254 | 656 | 38.7% | 73 | 231 | 31.6% | 79 | 100 | 79.0% | 16 | 138 | 154 | 303 | 26 | 0 | 125 | 129 | 660 |
| 9 | 2014-15 | DAL | 31 | 77 | 10 | 1,362 | 225 | 536 | 42.0% | 54 | 167 | 32.3% | 76 | 94 | 80.9% | 23 | 111 | 134 | 263 | 33 | 1 | 70 | 104 | 580 |
| 10 | 2015-16 | DAL | 32 | 74 | 16 | 1,667 | 317 | 711 | 44.6% | 100 | 260 | 38.5% | 74 | 96 | 77.1% | 26 | 126 | 152 | 302 | 26 | 2 | 113 | 110 | 808 |
| 11 | 2016-17 | DAL | 33 | 35 | 6 | 771 | 142 | 343 | 41.4% | 53 | 148 | 35.8% | 44 | 51 | 86.3% | 9 | 75 | 84 | 193 | 14 | 1 | 63 | 30 | 381 |
| 12 | 2017-18 | DAL | 34 | 69 | 11 | 1,603 | 303 | 690 | 43.9% | 115 | 313 | 36.7% | 80 | 102 | 78.4% | 15 | 186 | 201 | 434 | 35 | 3 | 143 | 83 | 801 |
| 13 | 2018-19 | DAL | 35 | 38 | 0 | 752 | 161 | 385 | 41.8% | 38 | 128 | 29.7% | 55 | 78 | 70.5% | 13 | 82 | 95 | 211 | 22 | 1 | 72 | 50 | 415 |
| 14 | 2019-20 | DAL | 36 | 29 | 6 | 450 | 85 | 207 | 41.1% | 32 | 85 | 37.6% | 20 | 22 | 90.9% | 10 | 43 | 53 | 112 | 5 | 2 | 38 | 27 | 222 |
Max Min
NBA Alltime Leaders
Games Played
Robert Parish: 1,611Kareem Abdul-Jabbar: 1,560
Vince Carter: 1,541
Dirk Nowitzki: 1,522
John Stockton: 1,504
Points
LeBron James: 40,474Kareem Abdul-Jabbar: 38,387
Karl Malone: 36,928
Kobe Bryant: 33,643
Michael Jordan: 32,292
Steals
John Stockton: 3,265Jason Kidd: 2,684
Chris Paul: 2,614
Michael Jordan: 2,514
Gary Payton: 2,445
Free Throws Made
Karl Malone: 9,787Moses Malone: 8,531
LeBron James: 8,390
Kobe Bryant: 8,378
Oscar Robertson: 7,694