Gordon Hayward Stats: NBA Career

Introducing Gordon Hayward: A Basketball Journey Through Skill and Tenacity
Gordon Hayward is a name that has echoed through the halls of NBA history, marking an impressive career that spans over a decade. From his humble beginnings with the Utah Jazz to his current tenure with the Oklahoma City Thunder, Hayward has carved a path of excellence on the basketball court that is worth exploring.
Hayward's journey started in the 2010-2011 season when he first stepped onto the NBA court at the young... age of 21. Over the years, he has donned the jerseys of the Utah Jazz, Boston Celtics, Charlotte Hornets, and now the Oklahoma City Thunder, leaving his mark in each city and state he has called home.
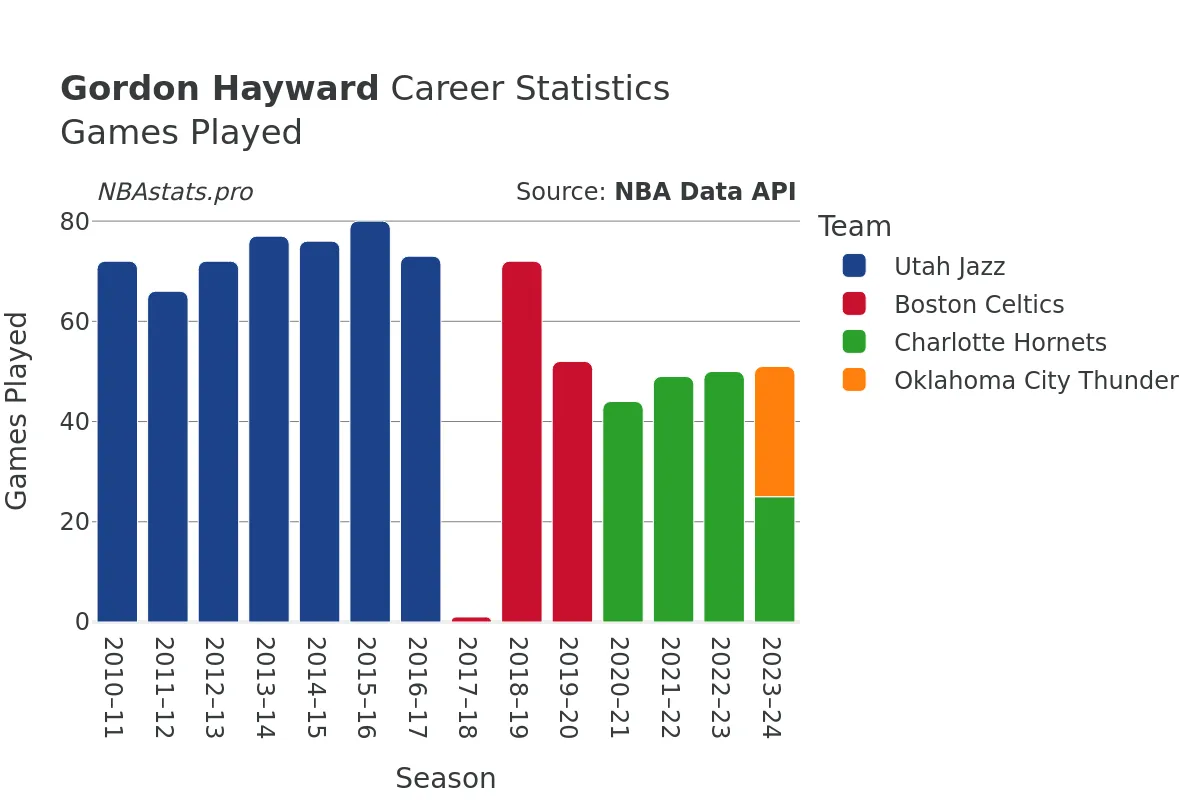
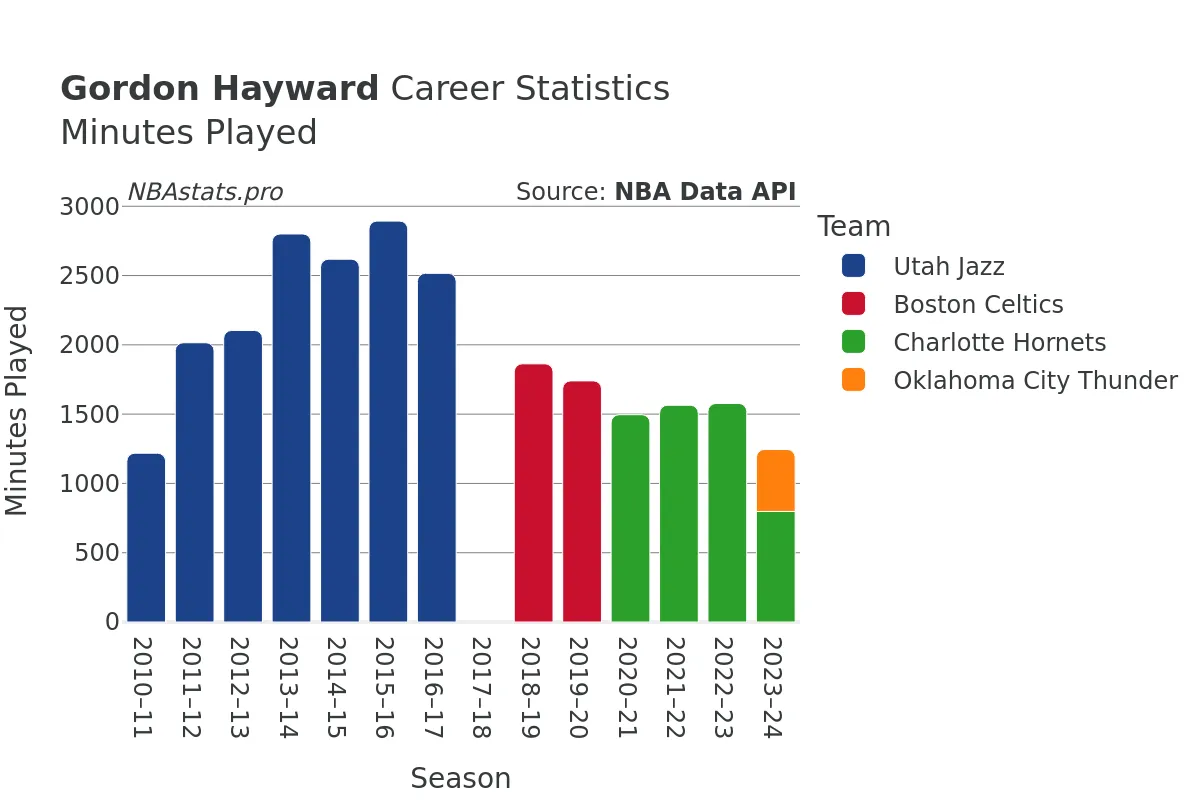
With a total of 886 games played and 26,899 minutes spent on the court, Hayward's dedication to the game is evident in every statistic. His 10,128 field goals attempted and 4,612 field goals made showcase his sharpshooting skills, with an impressive field goal percentage of 45.54%. When it comes to free throws, Hayward has proven to be a reliable asset with 2,815 successful shots out of 3,437 attempts, highlighting his precision under pressure.
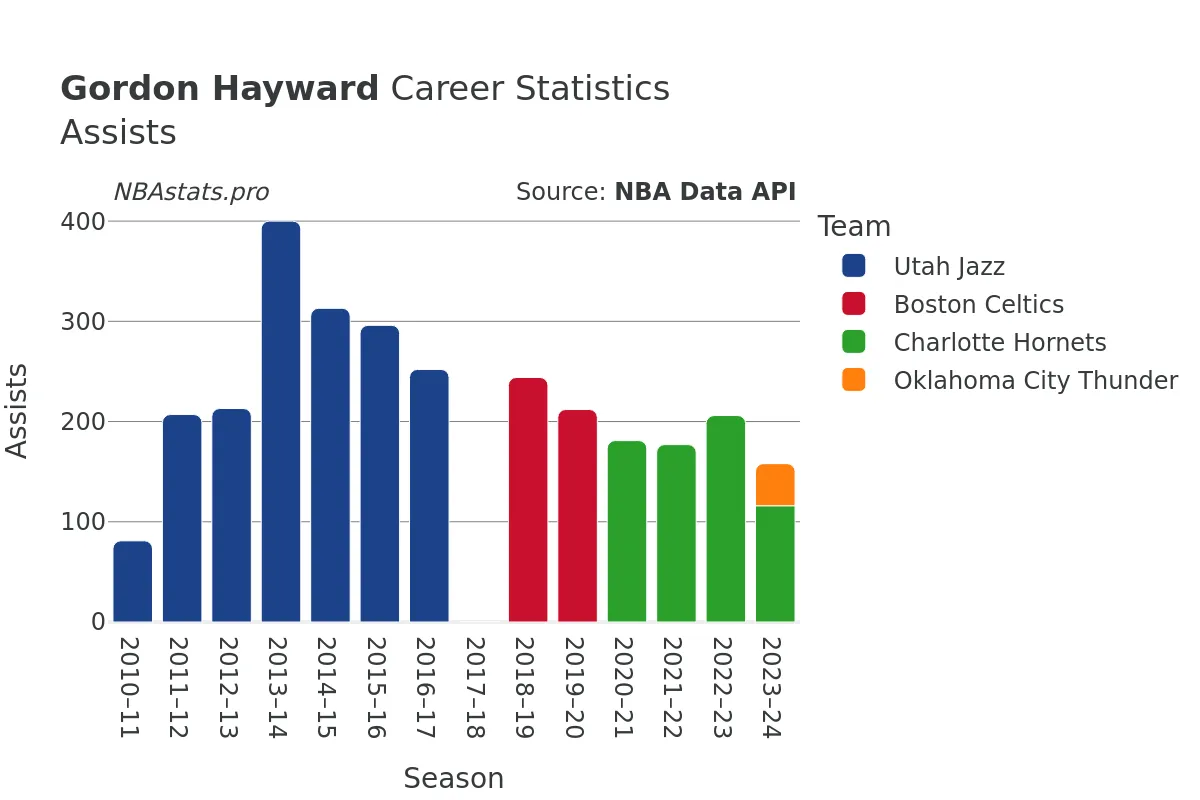
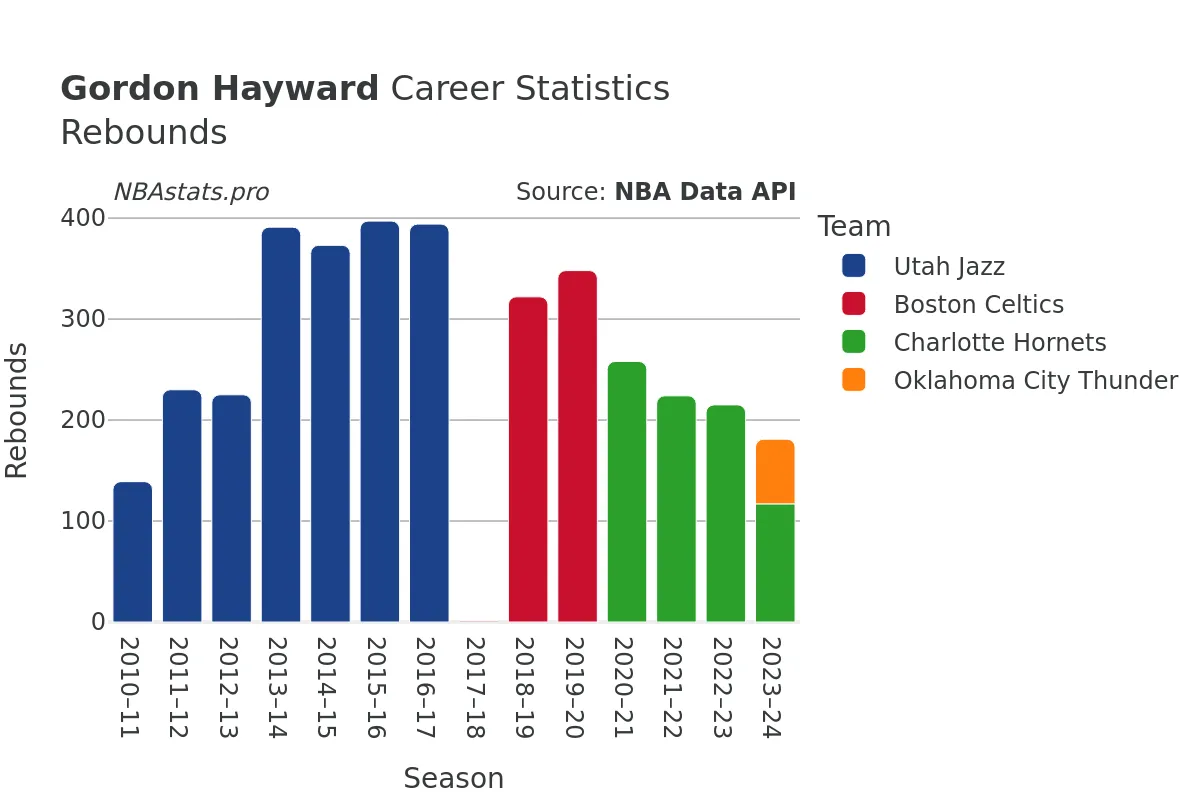
Rebounds have also been a strong suit for Hayward, totaling 3,879 rebounds throughout his career. Whether it's on the defensive end with 3,212 rebounds or on the offensive side with 667 rebounds, Hayward's ability to secure possession for his team is a valuable asset. Additionally, his 3,098 assists demonstrate his playmaking prowess, setting up his teammates for success on numerous occasions.
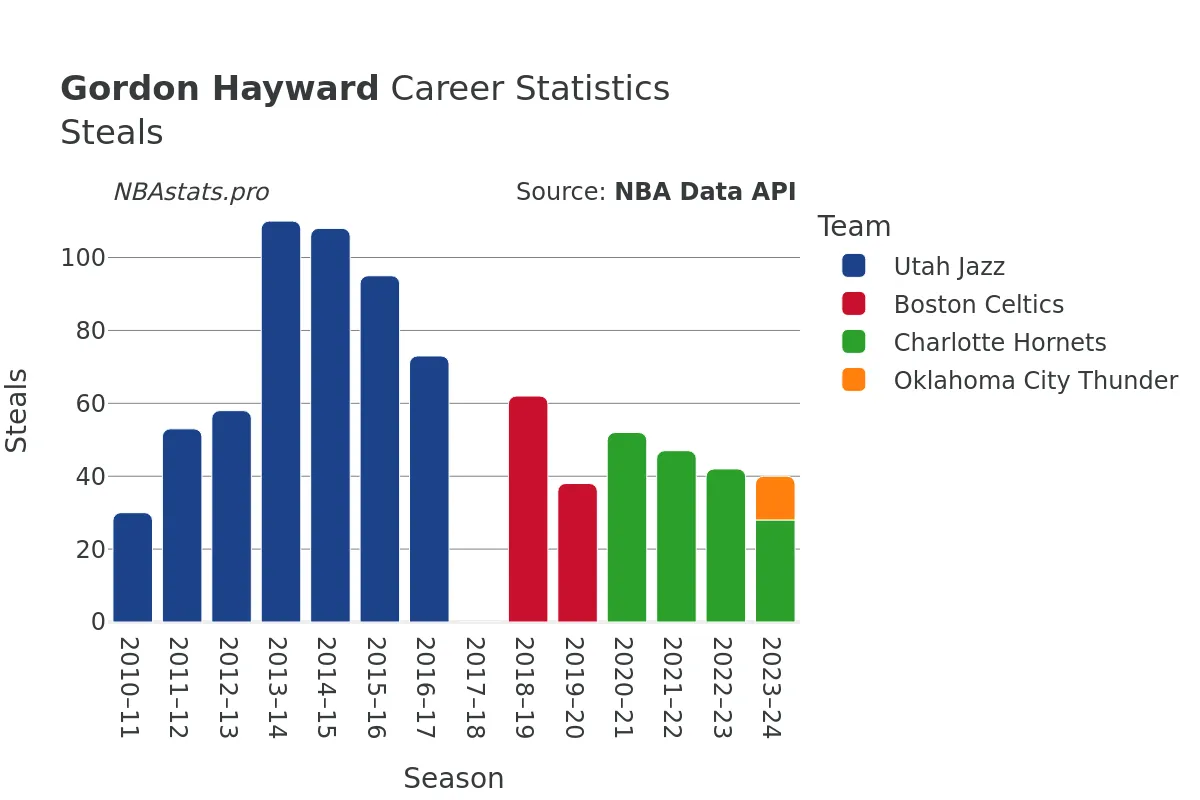
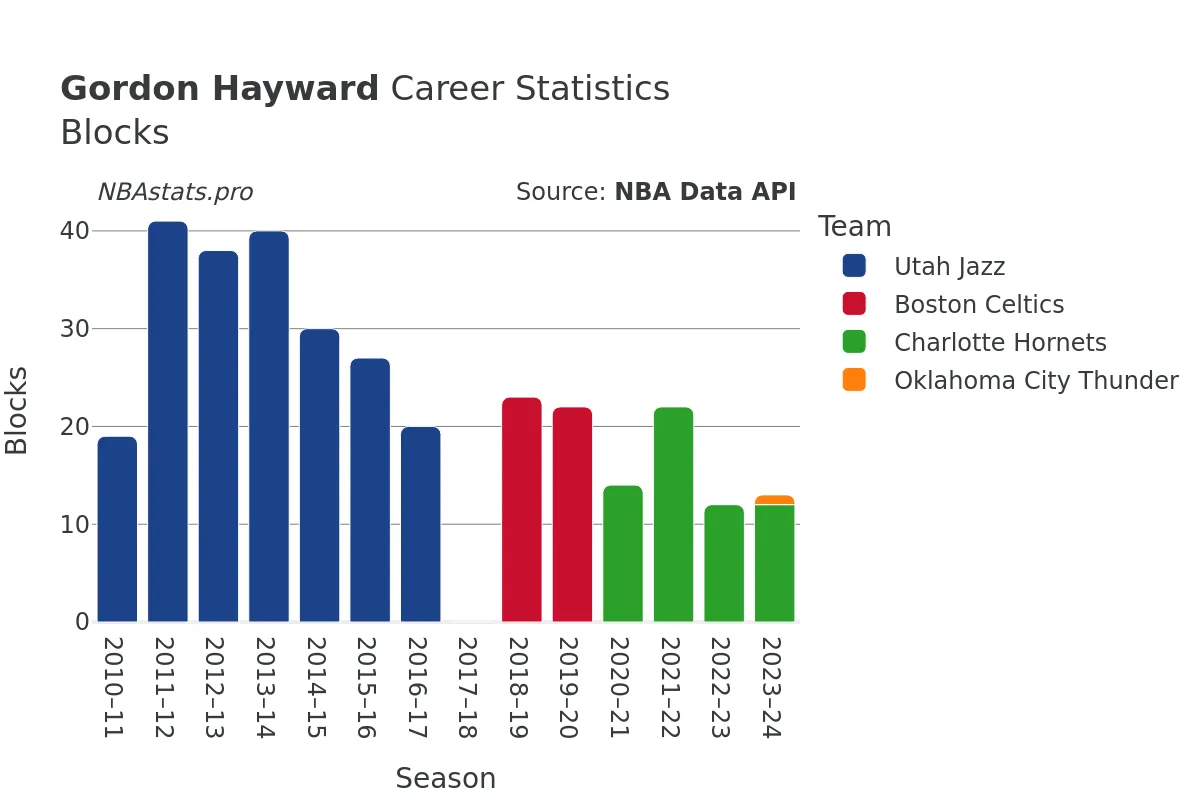
Hayward's defensive skills are equally impressive, with 848 steals and 334 blocks to his name. His tenacity on the court is evident in his ability to disrupt plays, showcasing his versatility as a two-way player who can impact the game on both ends of the floor.
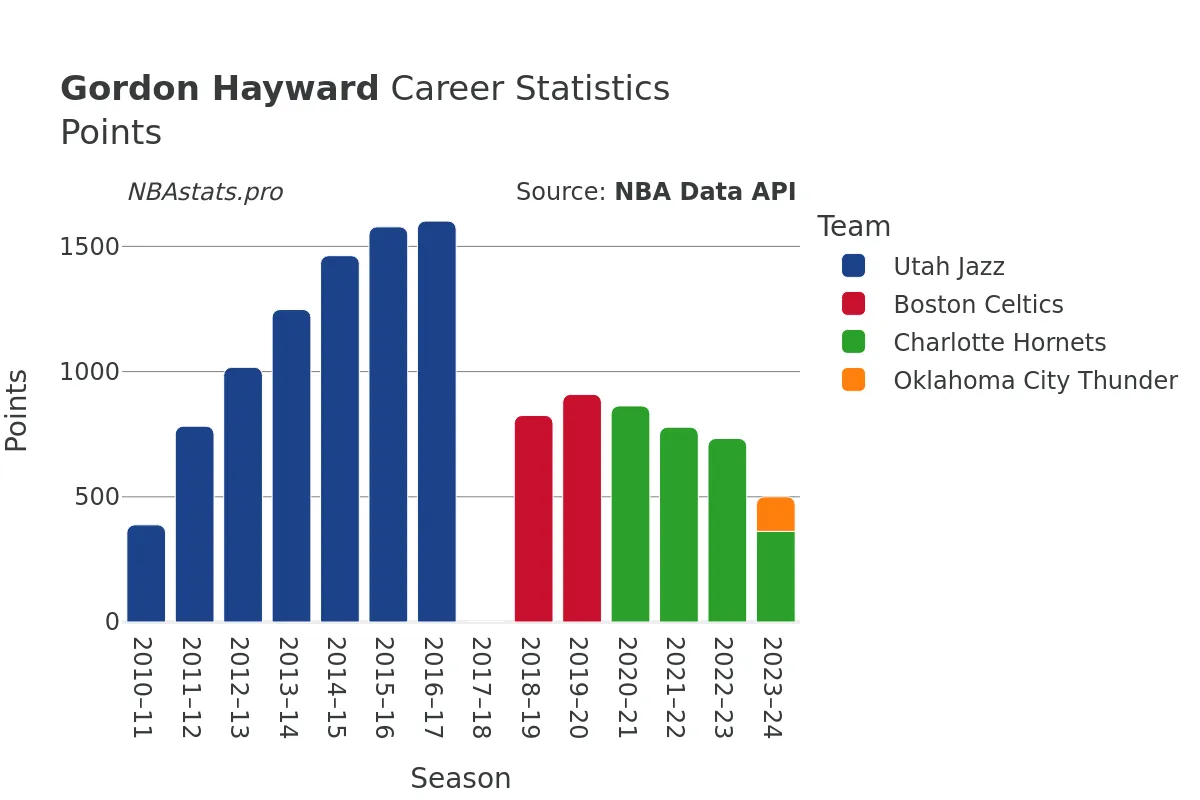
When it comes to scoring, Hayward has been a consistent threat, amassing a total of 13,187 points throughout his career. Whether driving to the basket with finesse or knocking down shots from beyond the arc, Hayward's offensive repertoire is one to be reckoned with, making him a formidable opponent for any defense.
As a player who has been actively contributing to the NBA for over a decade, Hayward's journey is a testament to hard work, perseverance, and a relentless passion for the game. His impact on the teams he has played for and the fans who have cheered him on is undeniable, solidifying his legacy as a respected and admired player in the league.
For a deeper dive into Gordon Hayward's career statistics and to explore the intricacies of his performance on the court, take a closer look at the charts and graphs on this page. Uncover the numbers behind the player and gain a greater appreciation for the skill and dedication that have defined Hayward's journey through the world of professional basketball.
Read more
Games Played
Points
Assists
Rebounds
Steals
Minutes Played
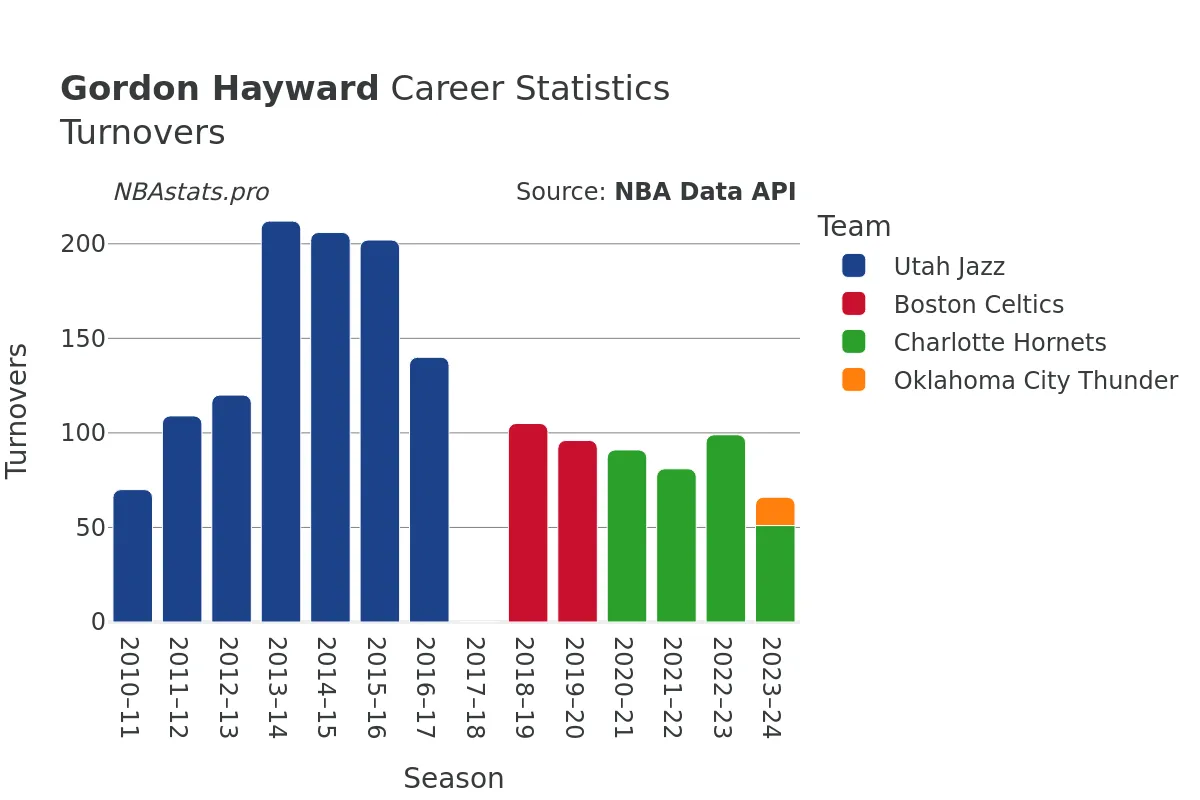
Turnovers
Blocks
Gordon Hayward Career Stats Table
| SEASON | TEAM | AGE | GP | GS | MIN | FGM | FGA | FG % | FG3M | FG3A | FG3 % | FTM | FTA | FT % | OREB | DREB | REB | AST | STL | BLK | TOV | PF | PTS | |
|---|---|---|---|---|---|---|---|---|---|---|---|---|---|---|---|---|---|---|---|---|---|---|---|---|
| 1 | 2010-11 | UTA | 21 | 72 | 17 | 1,218 | 142 | 293 | 48.5% | 35 | 74 | 47.3% | 69 | 97 | 71.1% | 41 | 98 | 139 | 81 | 30 | 19 | 70 | 106 | 388 |
| 2 | 2011-12 | UTA | 22 | 66 | 58 | 2,015 | 267 | 586 | 45.6% | 55 | 159 | 34.6% | 193 | 232 | 83.2% | 59 | 171 | 230 | 207 | 53 | 41 | 109 | 106 | 782 |
| 3 | 2012-13 | UTA | 23 | 72 | 27 | 2,104 | 336 | 773 | 43.5% | 102 | 246 | 41.5% | 243 | 294 | 82.7% | 51 | 174 | 225 | 213 | 58 | 38 | 120 | 125 | 1,017 |
| 4 | 2013-14 | UTA | 24 | 77 | 77 | 2,800 | 426 | 1,032 | 41.3% | 85 | 280 | 30.4% | 311 | 381 | 81.6% | 62 | 329 | 391 | 400 | 110 | 40 | 212 | 155 | 1,248 |
| 5 | 2014-15 | UTA | 25 | 76 | 76 | 2,618 | 484 | 1,087 | 44.5% | 120 | 330 | 36.4% | 375 | 462 | 81.2% | 54 | 319 | 373 | 313 | 108 | 30 | 206 | 131 | 1,463 |
| 6 | 2015-16 | UTA | 26 | 80 | 80 | 2,893 | 521 | 1,202 | 43.3% | 143 | 410 | 34.9% | 393 | 477 | 82.4% | 61 | 336 | 397 | 296 | 95 | 27 | 202 | 183 | 1,578 |
| 7 | 2016-17 | UTA | 27 | 73 | 73 | 2,516 | 545 | 1,156 | 47.1% | 149 | 374 | 39.8% | 362 | 429 | 84.4% | 49 | 345 | 394 | 252 | 73 | 20 | 140 | 117 | 1,601 |
| 8 | 2017-18 | BOS | 28 | 1 | 1 | 5 | 1 | 2 | 50.0% | 0 | 1 | 0.0% | 0 | 0 | 0.0% | 0 | 1 | 1 | 0 | 0 | 0 | 0 | 1 | 2 |
| 9 | 2018-19 | BOS | 29 | 72 | 18 | 1,863 | 296 | 635 | 46.6% | 77 | 231 | 33.3% | 156 | 187 | 83.4% | 51 | 271 | 322 | 244 | 62 | 23 | 105 | 104 | 825 |
| 10 | 2019-20 | BOS | 30 | 52 | 52 | 1,740 | 350 | 700 | 50.0% | 85 | 222 | 38.3% | 124 | 145 | 85.5% | 55 | 293 | 348 | 212 | 38 | 22 | 96 | 96 | 909 |
| 11 | 2020-21 | CHA | 31 | 44 | 44 | 1,496 | 311 | 658 | 47.3% | 85 | 205 | 41.5% | 156 | 185 | 84.3% | 37 | 221 | 258 | 181 | 52 | 14 | 91 | 74 | 863 |
| 12 | 2021-22 | CHA | 32 | 49 | 48 | 1,564 | 283 | 617 | 45.9% | 86 | 220 | 39.1% | 126 | 149 | 84.6% | 38 | 186 | 224 | 177 | 47 | 22 | 81 | 85 | 778 |
| 13 | 2022-23 | CHA | 33 | 50 | 50 | 1,577 | 276 | 581 | 47.5% | 52 | 160 | 32.5% | 129 | 159 | 81.1% | 33 | 182 | 215 | 206 | 42 | 12 | 99 | 70 | 733 |
| 14 | 2023-24 | CHA | 34 | 25 | 25 | 798 | 139 | 297 | 46.8% | 22 | 61 | 36.1% | 62 | 81 | 76.5% | 25 | 92 | 117 | 116 | 28 | 12 | 51 | 46 | 362 |
| 15 | 2023-24 | OKC | 34 | 26 | 3 | 447 | 48 | 106 | 45.3% | 15 | 29 | 51.7% | 27 | 39 | 69.2% | 13 | 51 | 64 | 42 | 12 | 1 | 15 | 21 | 138 |
| 16 | 2023-24 | TOT | 34 | 51 | 28 | 1,245 | 187 | 403 | 46.4% | 37 | 90 | 41.1% | 89 | 120 | 74.2% | 38 | 143 | 181 | 158 | 40 | 13 | 66 | 67 | 500 |
Max Min
NBA Alltime Leaders
Games Played
Robert Parish: 1,611Kareem Abdul-Jabbar: 1,560
Vince Carter: 1,541
Dirk Nowitzki: 1,522
John Stockton: 1,504
Points
LeBron James: 40,474Kareem Abdul-Jabbar: 38,387
Karl Malone: 36,928
Kobe Bryant: 33,643
Michael Jordan: 32,292
Steals
John Stockton: 3,265Jason Kidd: 2,684
Chris Paul: 2,614
Michael Jordan: 2,514
Gary Payton: 2,445
Free Throws Made
Karl Malone: 9,787Moses Malone: 8,531
LeBron James: 8,390
Kobe Bryant: 8,378
Oscar Robertson: 7,694