George Lynch Stats: NBA Career

George Lynch, a versatile forward who played for five different NBA teams during his career, is a player whose impact on the court was felt through his gritty defense, rebounding prowess, and efficiency on offense. With a career spanning from the 1993-94 season to the 2004-05 season, Lynch showcased his skills for the Los Angeles Lakers, Memphis Grizzlies, Philadelphia 76ers, Charlotte Hornets, and New Orleans Pelicans.
Lynch, who hails from various cities across the United States including Los... Angeles, Memphis, Philadelphia, Charlotte, and New Orleans, made a name for himself as a reliable and hardworking player on both ends of the floor. Standing at 6 feet 8 inches, Lynch was known for his tenacity, basketball IQ, and willingness to do the dirty work for his team.
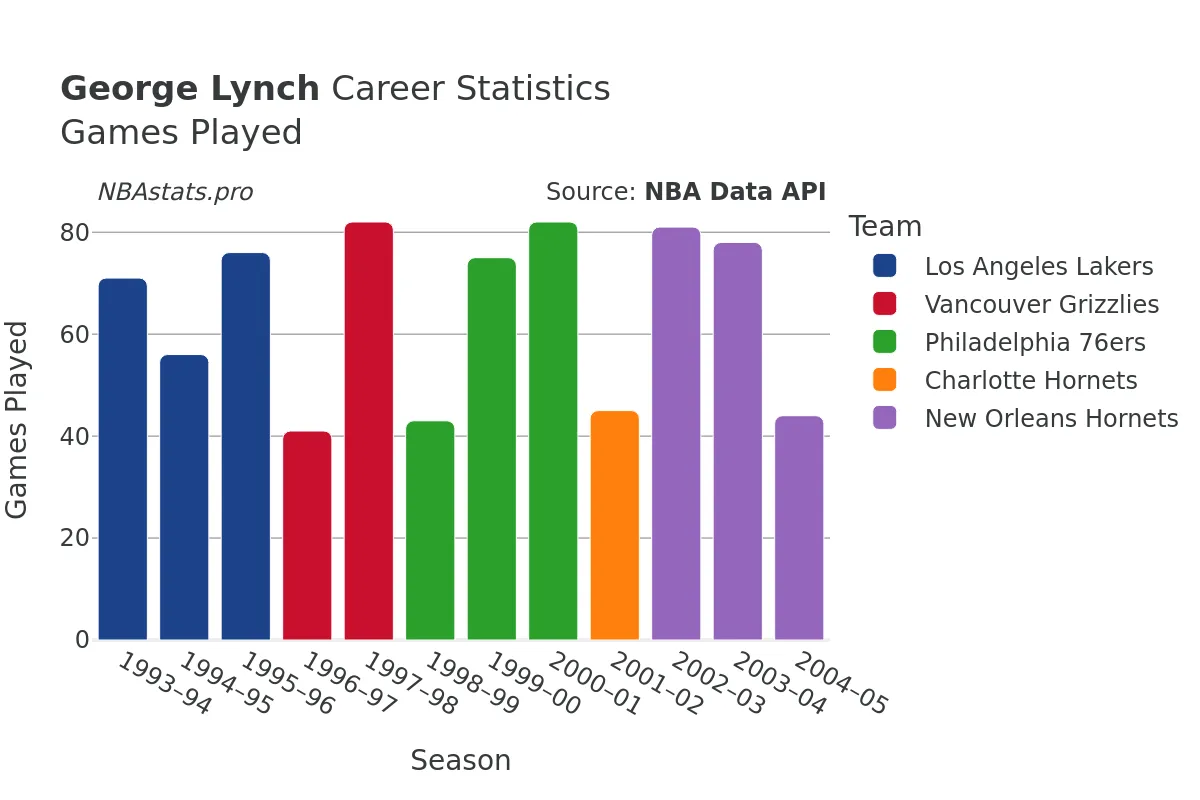
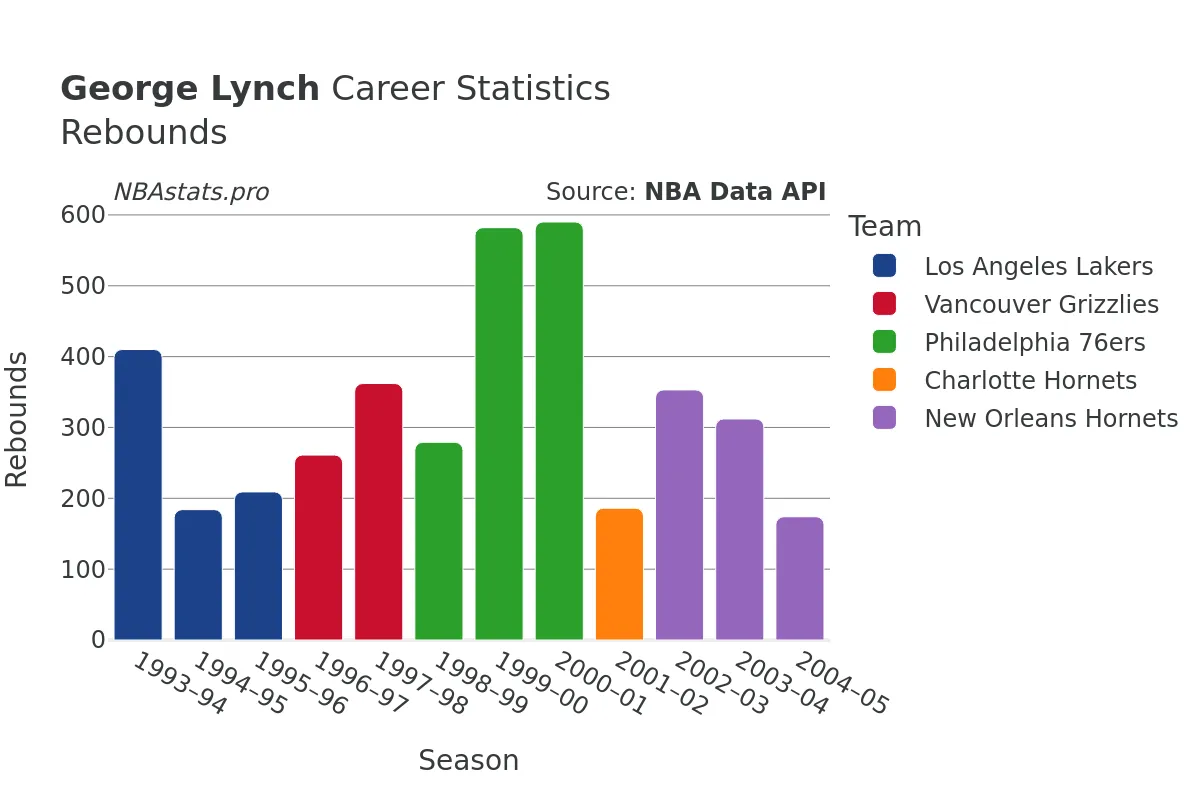
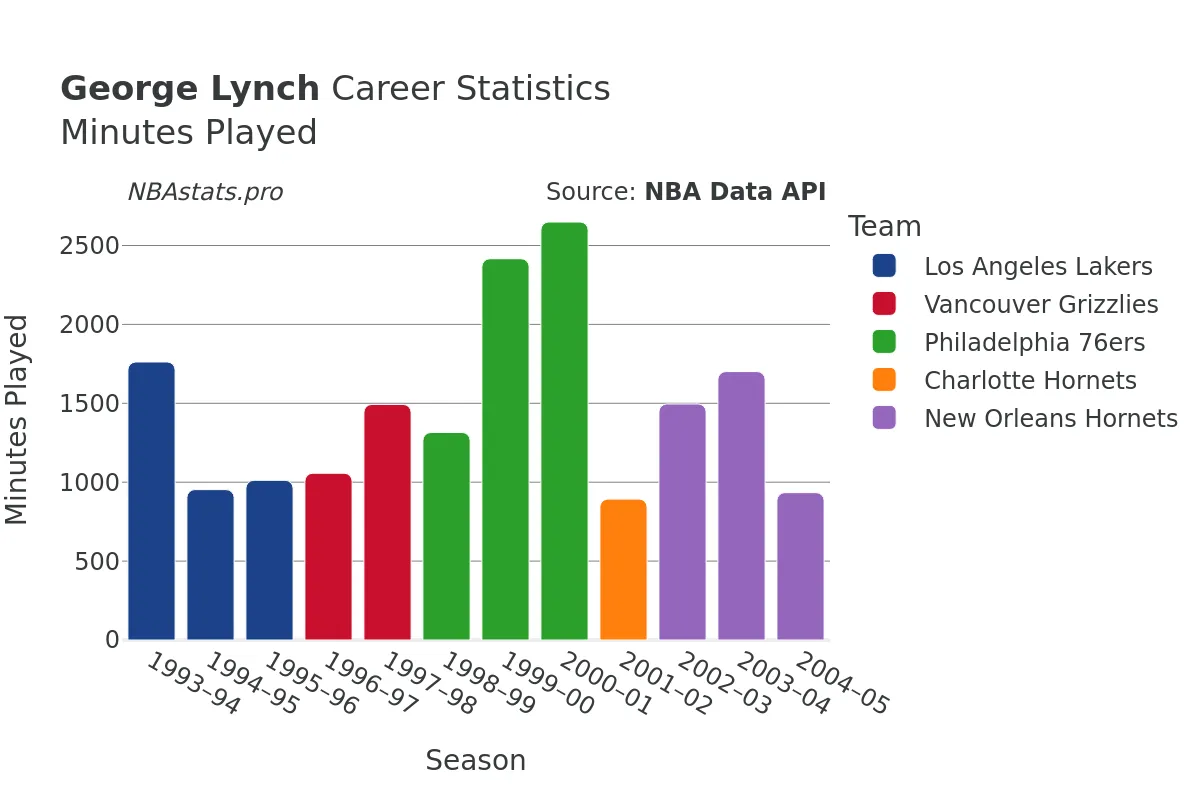
Over the course of his 774 games played in the NBA, Lynch accumulated impressive statistics that highlighted his contributions to his teams. With 17,681 minutes played, 2,086 field goals made out of 4,677 attempts, Lynch boasted a shooting percentage of 44.6%. His ability to score efficiently, coupled with his knack for crashing the boards, resulted in Lynch amassing a total of 3,902 rebounds during his career.
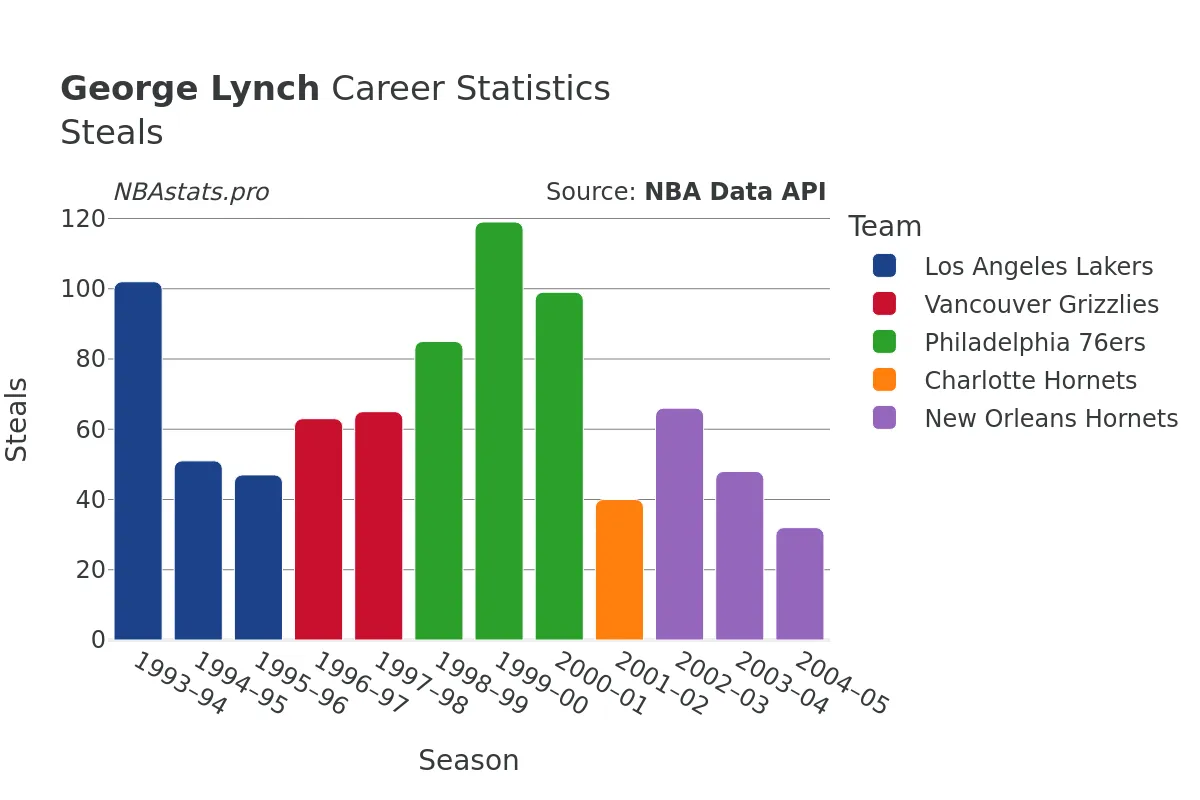
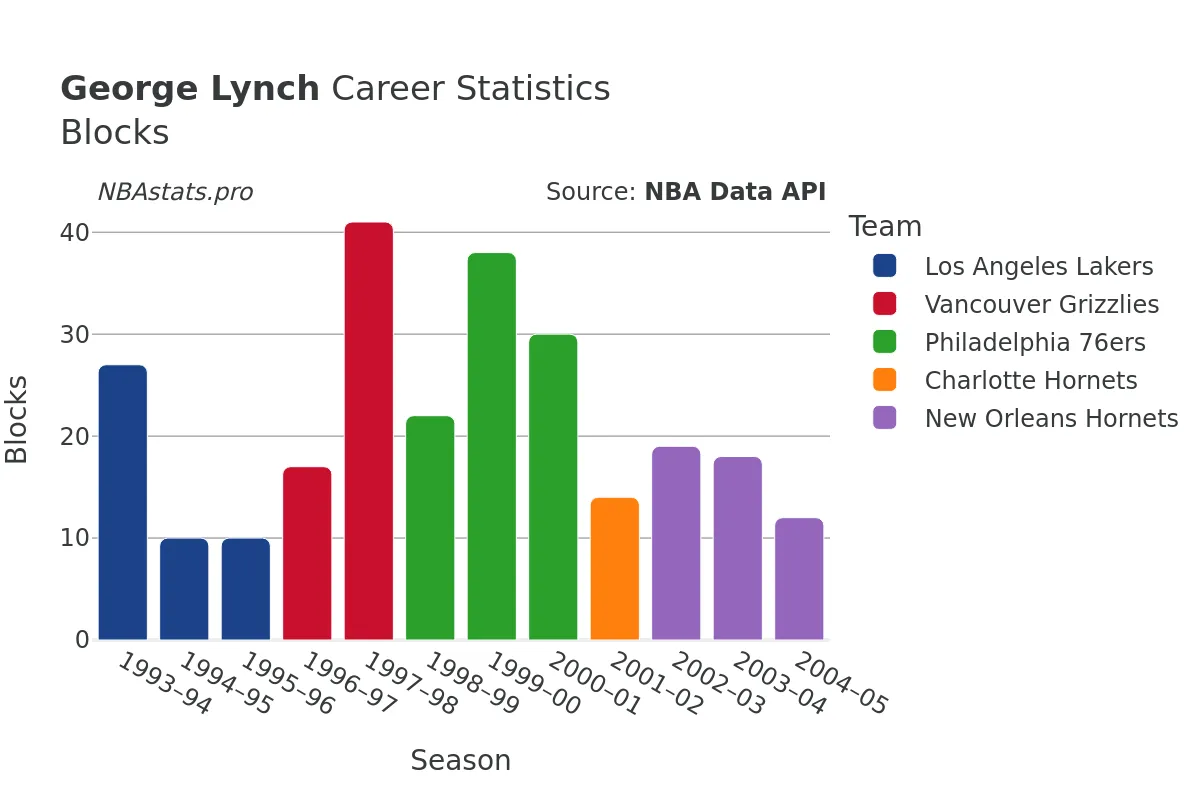
On the defensive end, Lynch's prowess was evident in his 817 steals and 258 blocks, showcasing his ability to disrupt opponents and protect the rim when needed. His basketball instincts and relentless effort made him a valuable asset to any team looking to shore up their defense and add a spark to their lineup.
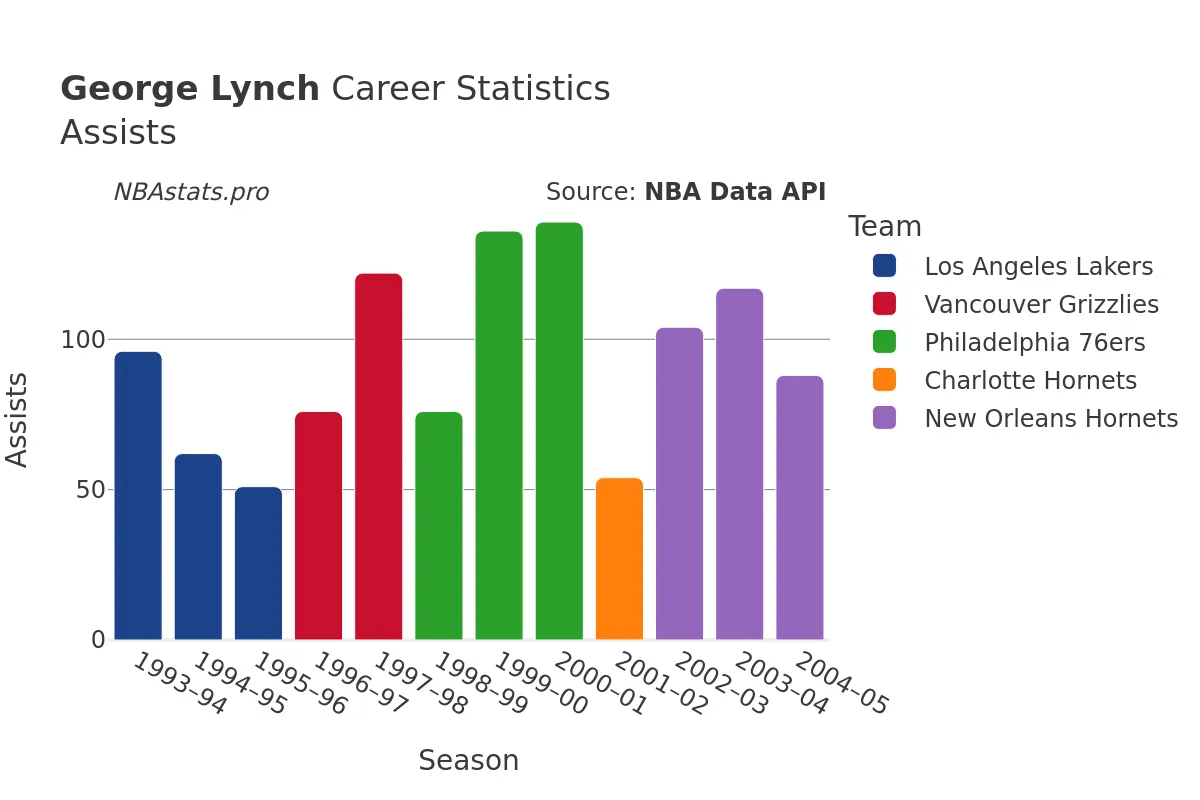
In addition to his defensive acumen, Lynch was also a capable facilitator on offense, dishing out 1,121 assists over the course of his career. His unselfish play and willingness to make the right pass at the right time endeared him to teammates and coaches alike, further solidifying his reputation as a team player.
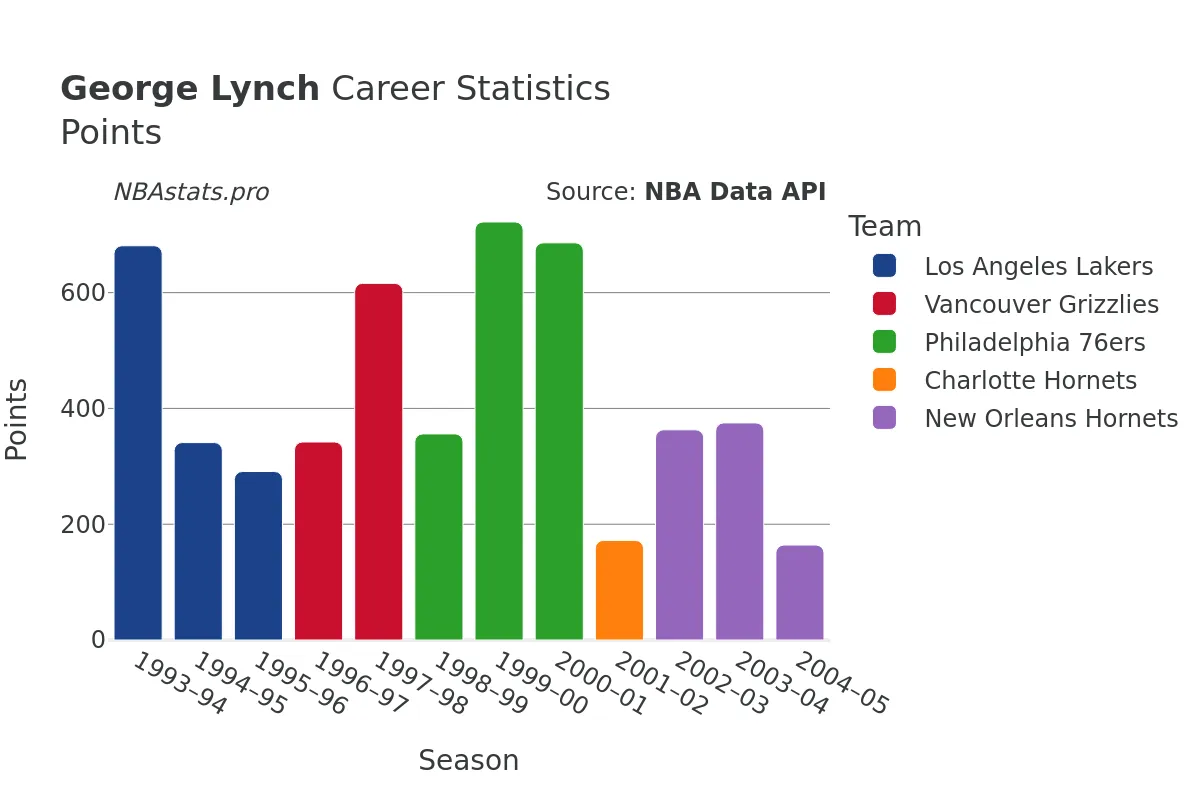
Scoring-wise, Lynch accumulated a total of 5,109 points throughout his career, demonstrating his ability to contribute on the offensive end when called upon. Whether it was knocking down mid-range jumpers, finishing around the rim, or converting from the free-throw line, Lynch was a player who could be counted on to deliver when his team needed him the most.
As a player who prided himself on doing the little things that don't always show up in the box score, Lynch's impact went beyond just numbers. His leadership, work ethic, and dedication to his craft set an example for his teammates and made him a respected figure both on and off the court.
For fans and analysts looking to delve deeper into George Lynch's career and statistics, the numbers tell a compelling story of a player who may not have always grabbed the headlines but consistently made his presence felt whenever he stepped onto the hardwood. By exploring the data and charts associated with Lynch's playing days, one can gain a deeper appreciation for the skillset and contributions of this underrated NBA player.
Read more
Games Played
Points
Assists
Rebounds
Steals
Minutes Played
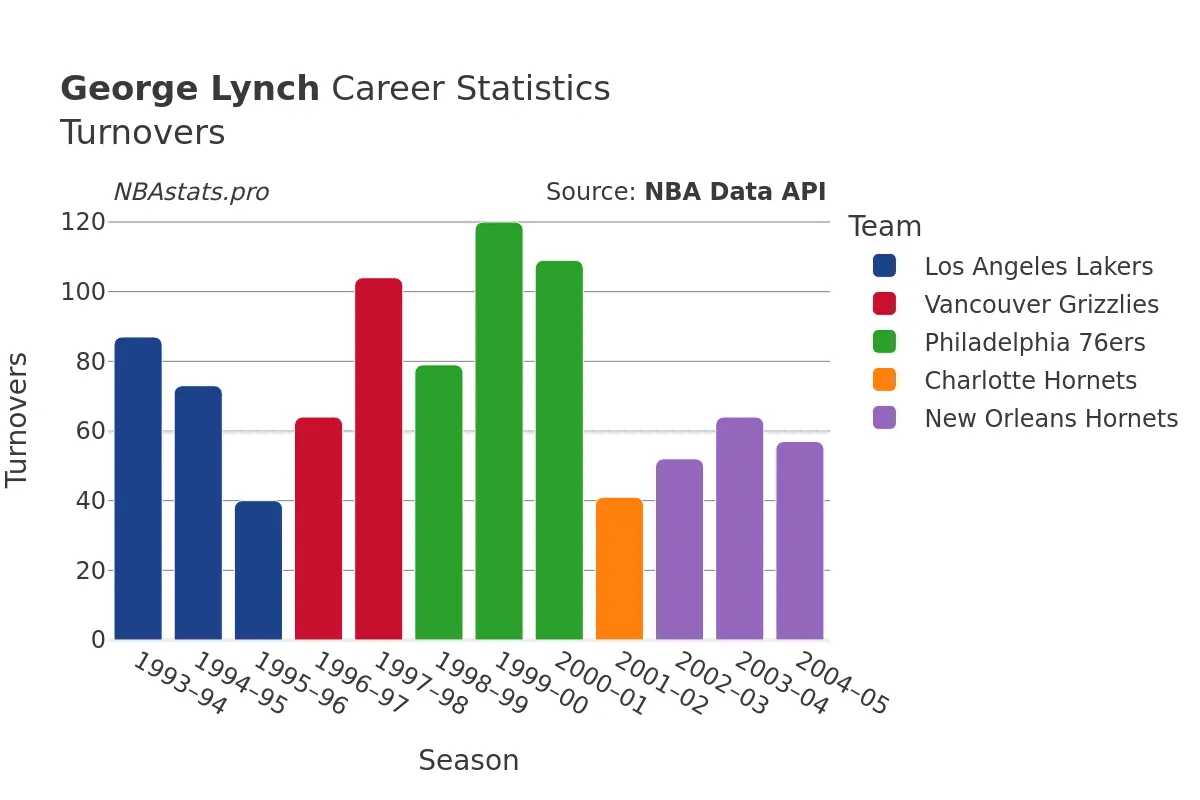
Turnovers
Blocks
George Lynch Career Stats Table
| SEASON | TEAM | AGE | GP | GS | MIN | FGM | FGA | FG % | FG3M | FG3A | FG3 % | FTM | FTA | FT % | OREB | DREB | REB | AST | STL | BLK | TOV | PF | PTS | |
|---|---|---|---|---|---|---|---|---|---|---|---|---|---|---|---|---|---|---|---|---|---|---|---|---|
| 1 | 1993-94 | LAL | 23 | 71 | 46 | 1,762 | 291 | 573 | 50.8% | 0 | 5 | 0.0% | 99 | 166 | 59.6% | 220 | 190 | 410 | 96 | 102 | 27 | 87 | 177 | 681 |
| 2 | 1994-95 | LAL | 24 | 56 | 15 | 953 | 138 | 295 | 46.8% | 3 | 21 | 14.3% | 62 | 86 | 72.1% | 75 | 109 | 184 | 62 | 51 | 10 | 73 | 86 | 341 |
| 3 | 1995-96 | LAL | 25 | 76 | 6 | 1,012 | 117 | 272 | 43.0% | 4 | 13 | 30.8% | 53 | 80 | 66.3% | 82 | 127 | 209 | 51 | 47 | 10 | 40 | 106 | 291 |
| 4 | 1996-97 | VAN | 26 | 41 | 27 | 1,057 | 137 | 291 | 47.1% | 8 | 31 | 25.8% | 60 | 97 | 61.9% | 98 | 163 | 261 | 76 | 63 | 17 | 64 | 97 | 342 |
| 5 | 1997-98 | VAN | 27 | 82 | 0 | 1,493 | 248 | 516 | 48.1% | 9 | 30 | 30.0% | 111 | 158 | 70.3% | 147 | 215 | 362 | 122 | 65 | 41 | 104 | 161 | 616 |
| 6 | 1998-99 | PHI | 28 | 43 | 43 | 1,315 | 147 | 349 | 42.1% | 9 | 23 | 39.1% | 53 | 84 | 63.1% | 110 | 169 | 279 | 76 | 85 | 22 | 79 | 142 | 356 |
| 7 | 1999-00 | PHI | 29 | 75 | 75 | 2,416 | 297 | 644 | 46.1% | 15 | 36 | 41.7% | 113 | 183 | 61.7% | 216 | 366 | 582 | 136 | 119 | 38 | 120 | 231 | 722 |
| 8 | 2000-01 | PHI | 30 | 82 | 80 | 2,649 | 274 | 616 | 44.5% | 15 | 57 | 26.3% | 123 | 171 | 71.9% | 200 | 390 | 590 | 139 | 99 | 30 | 109 | 222 | 686 |
| 9 | 2001-02 | CHH | 31 | 45 | 18 | 893 | 73 | 198 | 36.9% | 1 | 6 | 16.7% | 25 | 40 | 62.5% | 70 | 116 | 186 | 54 | 40 | 14 | 41 | 75 | 172 |
| 10 | 2002-03 | NOH | 32 | 81 | 32 | 1,496 | 147 | 359 | 40.9% | 28 | 79 | 35.4% | 41 | 74 | 55.4% | 139 | 214 | 353 | 104 | 66 | 19 | 52 | 136 | 363 |
| 11 | 2003-04 | NOH | 33 | 78 | 51 | 1,701 | 149 | 375 | 39.7% | 43 | 139 | 30.9% | 34 | 51 | 66.7% | 96 | 216 | 312 | 117 | 48 | 18 | 64 | 159 | 375 |
| 12 | 2004-05 | NOH | 34 | 44 | 27 | 934 | 68 | 189 | 36.0% | 11 | 37 | 29.7% | 17 | 23 | 73.9% | 55 | 119 | 174 | 88 | 32 | 12 | 57 | 83 | 164 |
Max Min
NBA Alltime Leaders
Games Played
Robert Parish: 1,611Kareem Abdul-Jabbar: 1,560
Vince Carter: 1,541
Dirk Nowitzki: 1,522
John Stockton: 1,504
Points
LeBron James: 40,474Kareem Abdul-Jabbar: 38,387
Karl Malone: 36,928
Kobe Bryant: 33,643
Michael Jordan: 32,292
Steals
John Stockton: 3,265Jason Kidd: 2,684
Chris Paul: 2,614
Michael Jordan: 2,514
Gary Payton: 2,445
Free Throws Made
Karl Malone: 9,787Moses Malone: 8,531
LeBron James: 8,390
Kobe Bryant: 8,378
Oscar Robertson: 7,694