Dion Waiters Stats: NBA Career

Welcome to the in-depth analysis of one of the most intriguing and dynamic NBA players in recent years - Dion Waiters. From his early days in the league to his latest stints with various teams, Waiters has carved out a unique path filled with ups and downs, but always showcasing his undeniable talent and skill on the court.
Dion Waiters began his NBA journey in the 2012-13 season with the Cleveland Cavaliers, where he quickly made a name for himself as a scoring threat with his smooth shooting ...stroke and ability to create his own shot. Over the course of his career, Waiters went on to play for the Oklahoma City Thunder, Miami Heat, and Los Angeles Lakers, leaving a mark on each team with his scoring prowess and clutch performances.
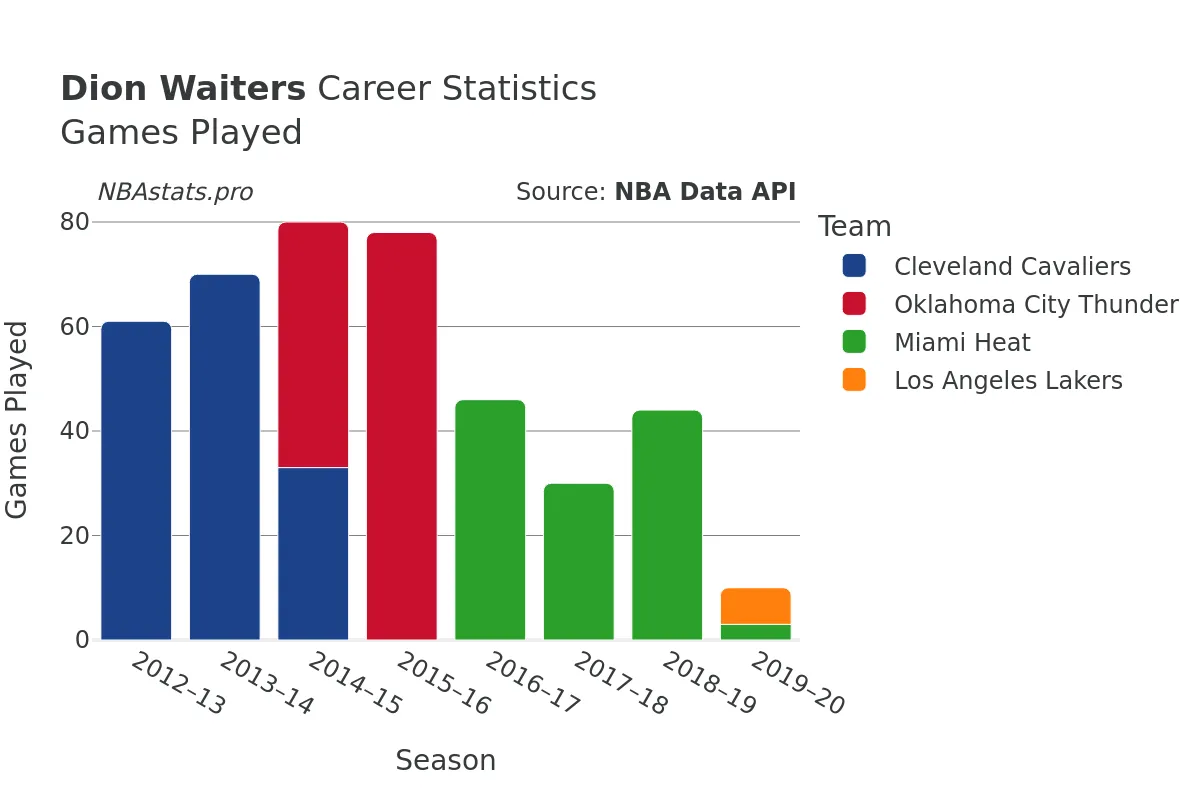
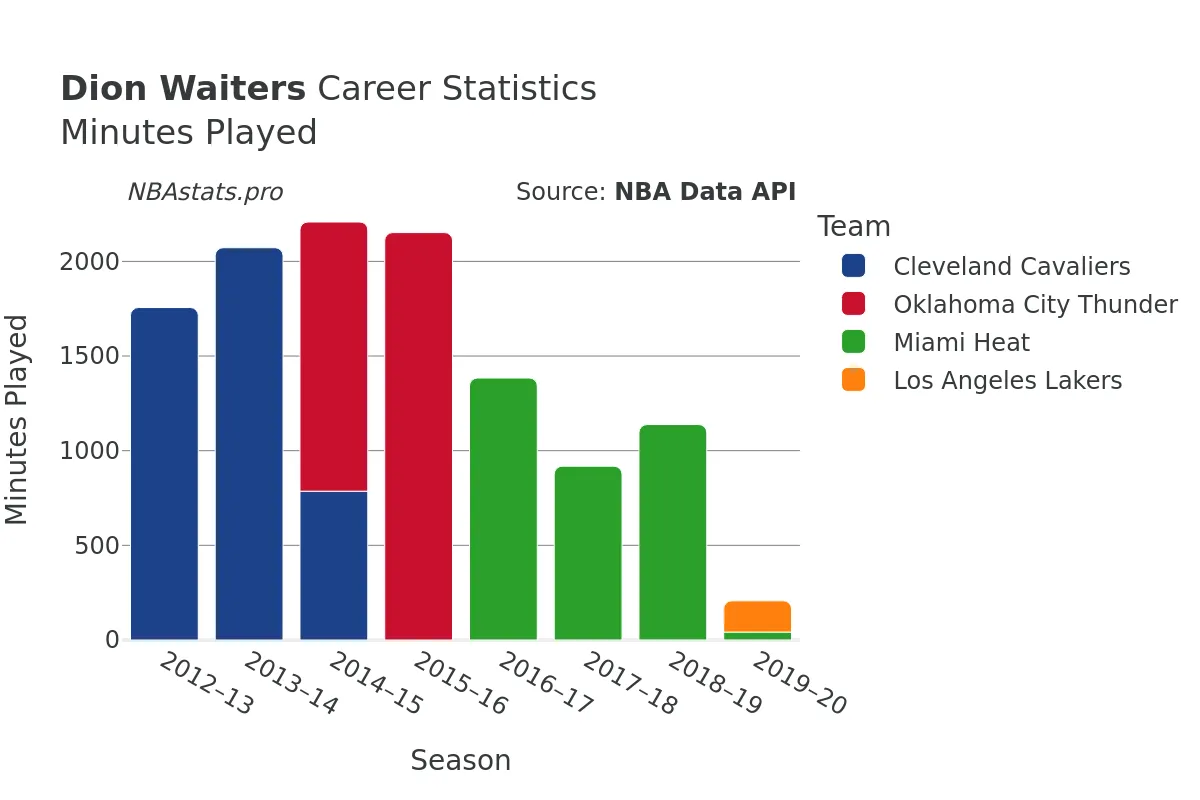
Throughout his eight seasons in the league, Waiters appeared in a total of 509 games, logging an impressive 14,250 minutes on the court. His offensive game was highlighted by his scoring ability, as he attempted 6,155 field goals and made 2,522 of them, boasting a field goal percentage of 40.97%. This efficiency, combined with his knack for scoring in crucial moments, made Waiters a valuable asset to any team he played for.
When it came to free throws, Waiters showed consistency and reliability at the line. He attempted 1,223 free throws and made 849 of them, translating to a solid free throw percentage. This ability to convert from the charity stripe under pressure further solidified Waiters' reputation as a reliable scorer and a player who could be counted on when the game was on the line.
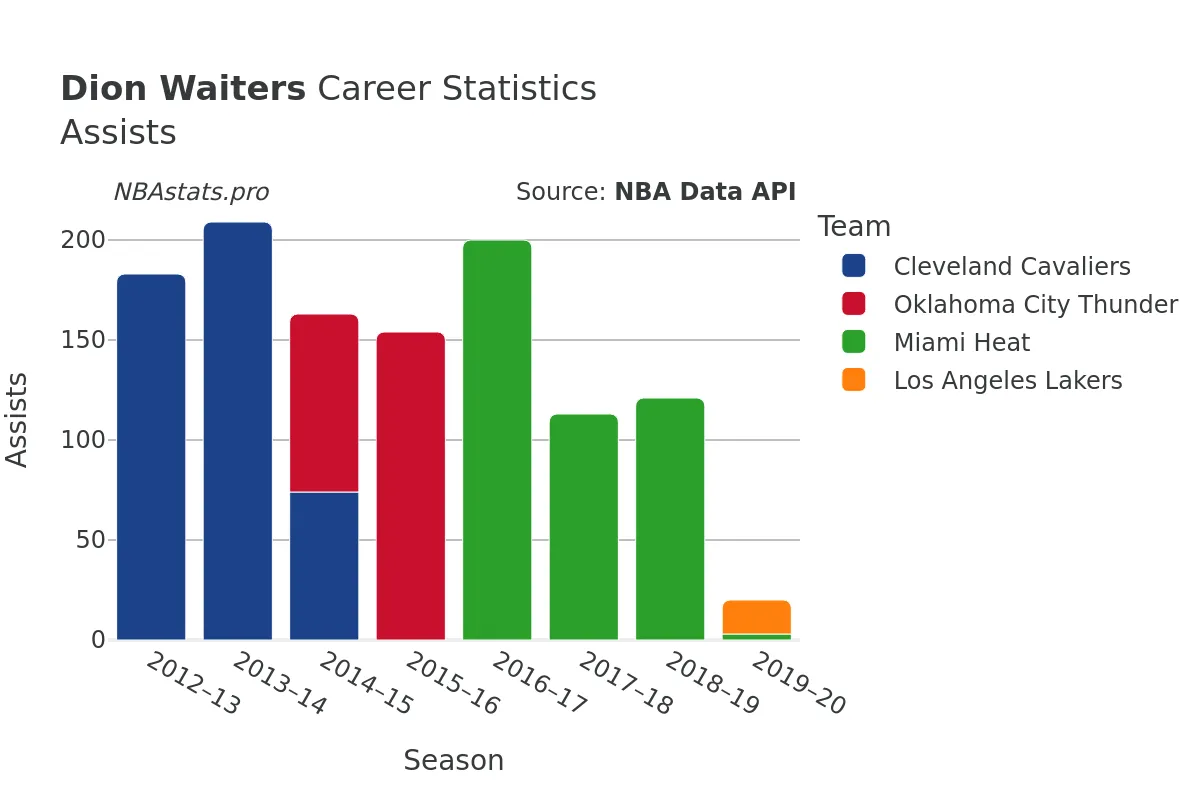
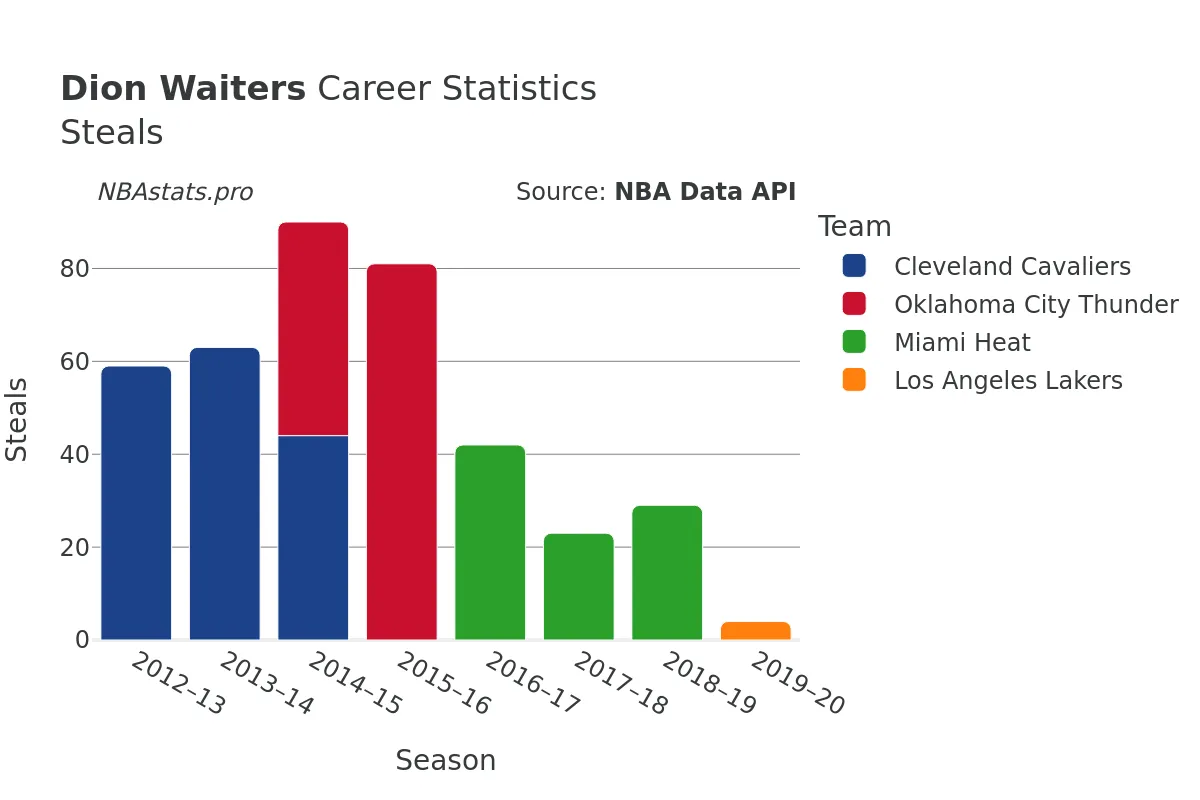
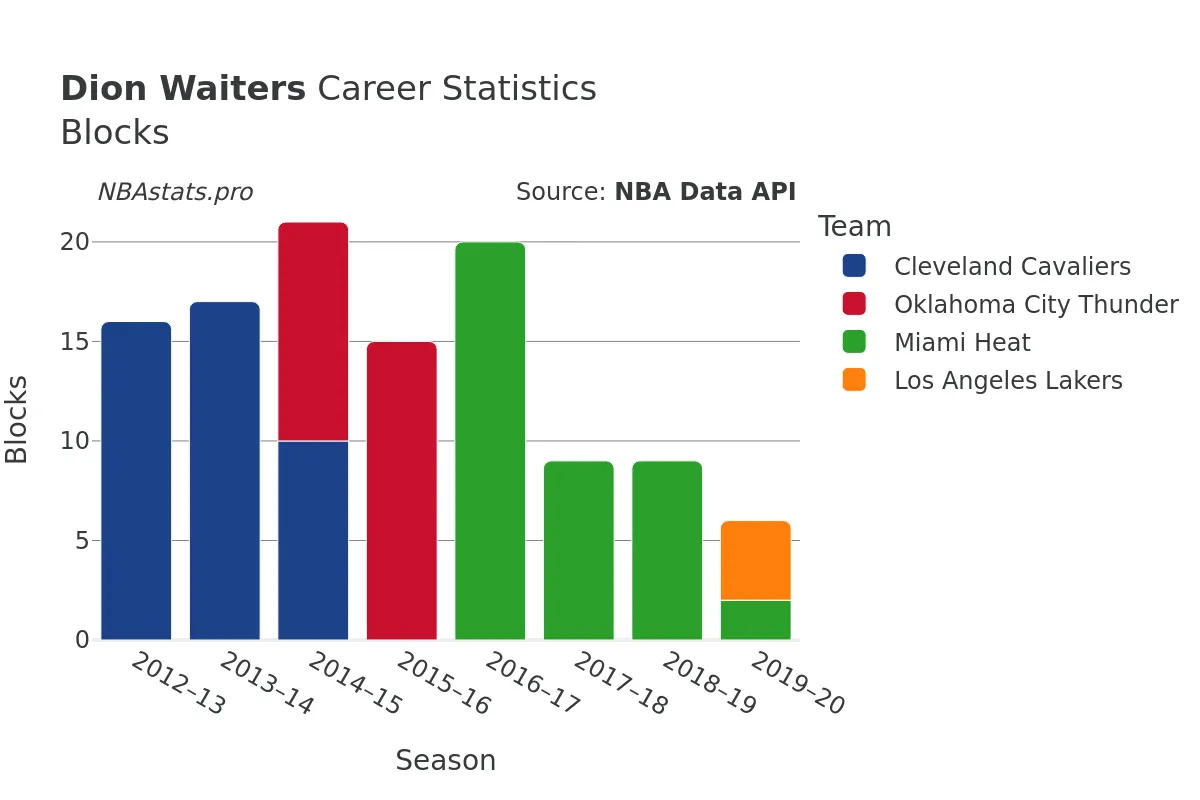
Waiters was not just a scorer, but also a versatile contributor on the court. He showcased his skills as a playmaker, racking up 1,346 assists over his career, demonstrating his ability to create scoring opportunities for his teammates. Additionally, Waiters proved to be a tenacious defender, recording 485 steals and 140 blocks, showcasing his all-around game and willingness to contribute on both ends of the floor.
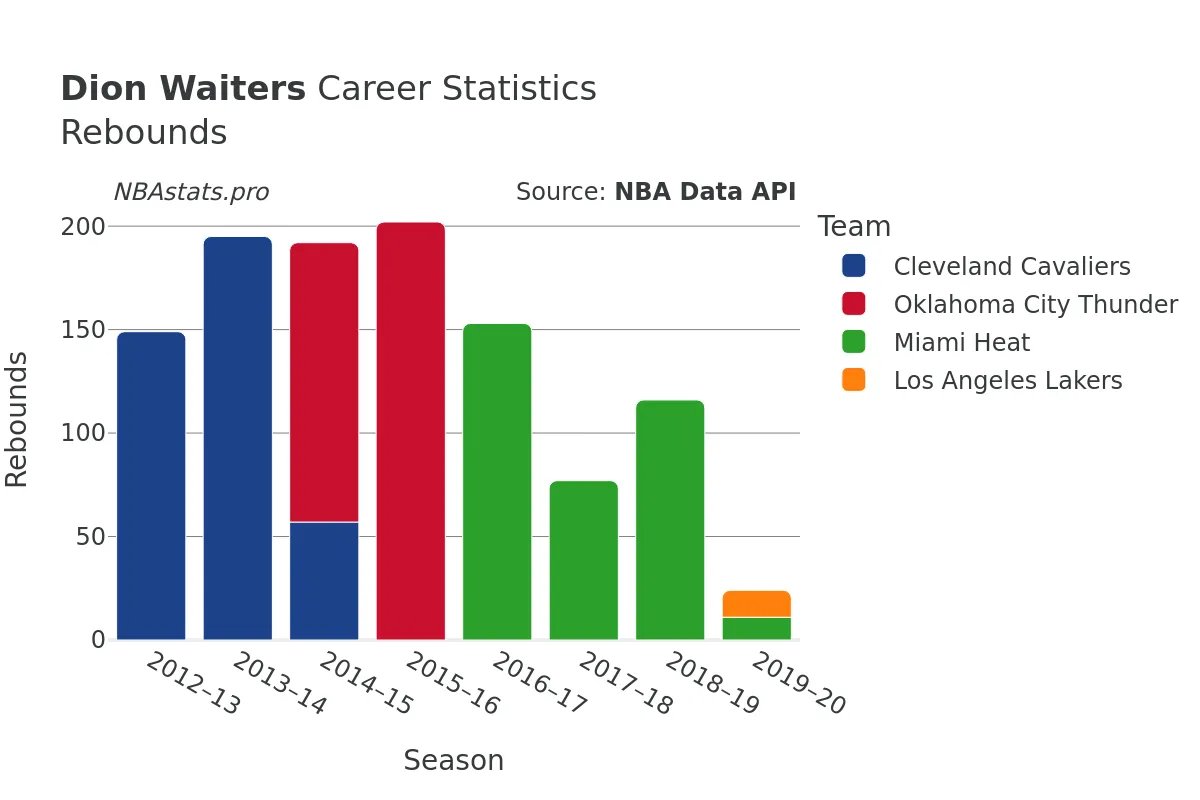
In terms of rebounding, Waiters displayed a solid presence on the boards, collecting a total of 1,324 rebounds throughout his career. His ability to crash the glass, both on the defensive end (1,115 rebounds) and offensive end (209 rebounds), added another dimension to his game and highlighted his willingness to do the dirty work to help his team succeed.
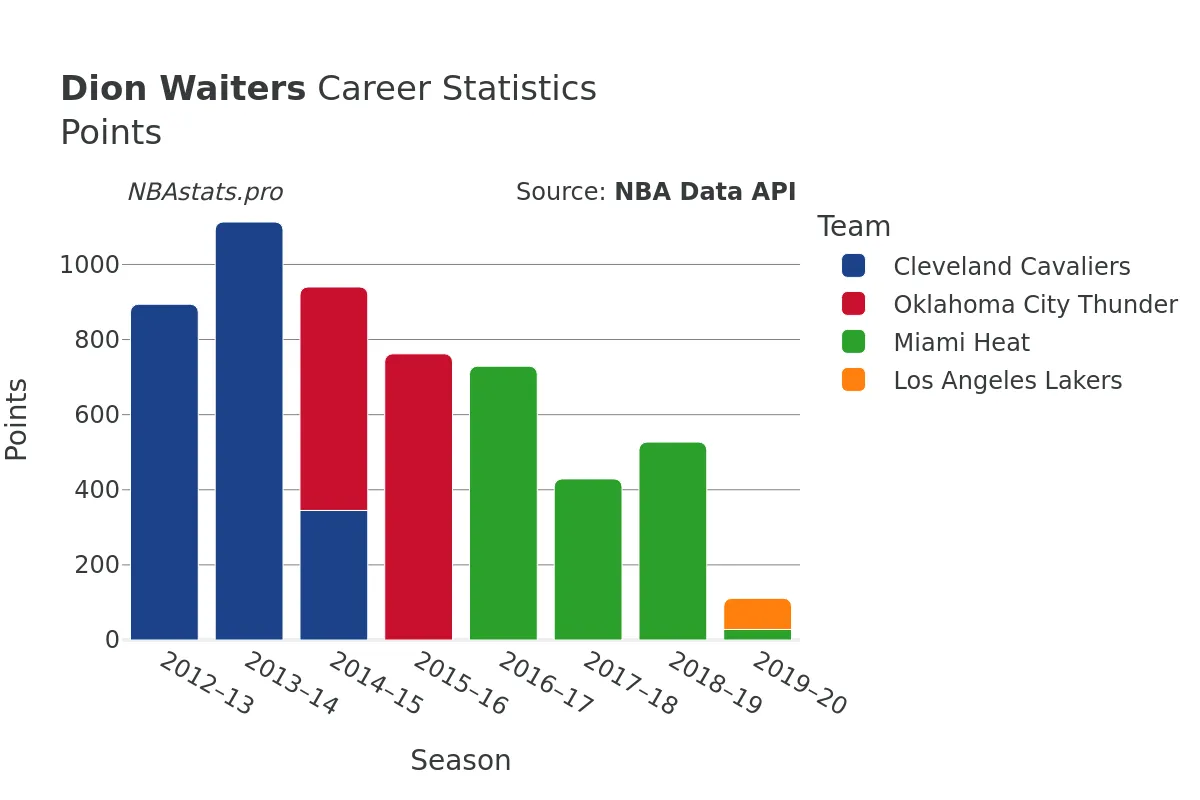
When it came to putting points on the board, Waiters made his mark with a total of 6,556 career points. His scoring ability, coupled with his efficiency and versatility on the court, solidified his reputation as a dynamic scorer who could impact the game in multiple ways.
Though Waiters is currently not active in the NBA, his impact and contributions to the league have left a lasting impression. His journey through multiple teams and cities showcased his adaptability and resilience, while his on-court performances solidified his status as a talented and exciting player to watch.
To dive deeper into Dion Waiters' career and explore his statistical journey in the NBA, take a closer look at the detailed charts and graphs provided on this page. Get to know the numbers behind the player and uncover the story of a player who, despite facing challenges and setbacks, always found a way to shine on the basketball court.
Read more
Games Played
Points
Assists
Rebounds
Steals
Minutes Played
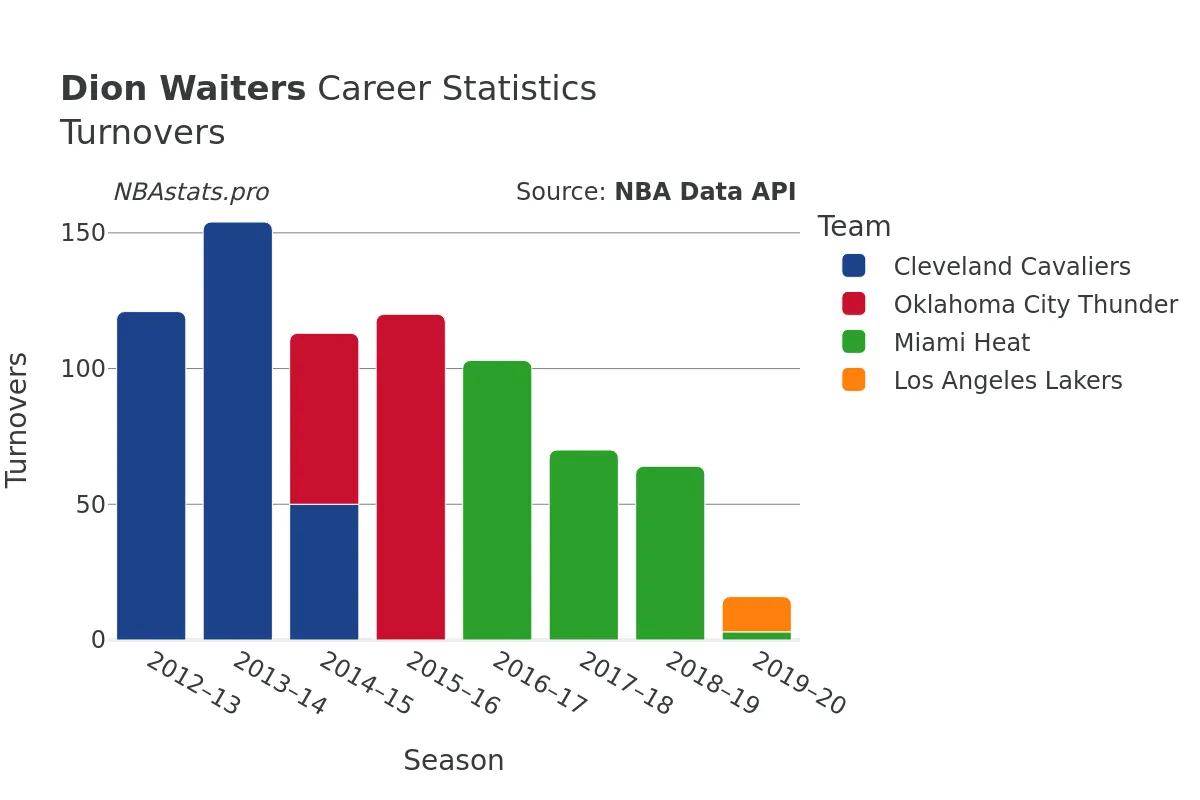
Turnovers
Blocks
Dion Waiters Career Stats Table
| SEASON | TEAM | AGE | GP | GS | MIN | FGM | FGA | FG % | FG3M | FG3A | FG3 % | FTM | FTA | FT % | OREB | DREB | REB | AST | STL | BLK | TOV | PF | PTS | |
|---|---|---|---|---|---|---|---|---|---|---|---|---|---|---|---|---|---|---|---|---|---|---|---|---|
| 1 | 2012-13 | CLE | 21 | 61 | 48 | 1,756 | 336 | 815 | 41.2% | 63 | 203 | 31.0% | 159 | 213 | 74.6% | 22 | 127 | 149 | 183 | 59 | 16 | 121 | 113 | 894 |
| 2 | 2013-14 | CLE | 22 | 70 | 24 | 2,072 | 430 | 993 | 43.3% | 92 | 250 | 36.8% | 161 | 235 | 68.5% | 32 | 163 | 195 | 209 | 63 | 17 | 154 | 153 | 1,113 |
| 3 | 2014-15 | CLE | 23 | 33 | 3 | 786 | 138 | 342 | 40.4% | 22 | 86 | 25.6% | 47 | 60 | 78.3% | 12 | 45 | 57 | 74 | 44 | 10 | 50 | 59 | 345 |
| 4 | 2014-15 | OKC | 23 | 47 | 20 | 1,422 | 237 | 604 | 39.2% | 51 | 160 | 31.9% | 70 | 112 | 62.5% | 29 | 106 | 135 | 89 | 46 | 11 | 63 | 96 | 595 |
| 5 | 2014-15 | TOT | 23 | 80 | 23 | 2,208 | 375 | 946 | 39.6% | 73 | 246 | 29.7% | 117 | 172 | 68.0% | 41 | 151 | 192 | 163 | 90 | 21 | 113 | 155 | 940 |
| 6 | 2015-16 | OKC | 24 | 78 | 15 | 2,152 | 282 | 706 | 39.9% | 86 | 240 | 35.8% | 112 | 157 | 71.3% | 36 | 166 | 202 | 154 | 81 | 15 | 120 | 143 | 762 |
| 7 | 2016-17 | MIA | 25 | 46 | 43 | 1,384 | 281 | 663 | 42.4% | 85 | 215 | 39.5% | 82 | 127 | 64.6% | 18 | 135 | 153 | 200 | 42 | 20 | 103 | 95 | 729 |
| 8 | 2017-18 | MIA | 26 | 30 | 30 | 918 | 163 | 410 | 39.8% | 52 | 170 | 30.6% | 51 | 69 | 73.9% | 8 | 69 | 77 | 113 | 23 | 9 | 70 | 61 | 429 |
| 9 | 2018-19 | MIA | 27 | 44 | 28 | 1,138 | 198 | 478 | 41.4% | 109 | 289 | 37.7% | 22 | 44 | 50.0% | 7 | 109 | 116 | 121 | 29 | 9 | 64 | 72 | 527 |
| 10 | 2019-20 | MIA | 28 | 3 | 0 | 42 | 10 | 26 | 38.5% | 8 | 17 | 47.1% | 0 | 1 | 0.0% | 0 | 11 | 11 | 3 | 0 | 2 | 3 | 5 | 28 |
| 11 | 2019-20 | LAL | 28 | 7 | 0 | 165 | 31 | 73 | 42.5% | 7 | 30 | 23.3% | 14 | 16 | 87.5% | 2 | 11 | 13 | 17 | 4 | 4 | 13 | 16 | 83 |
| 12 | 2019-20 | TOT | 28 | 10 | 0 | 207 | 41 | 99 | 41.4% | 15 | 47 | 31.9% | 14 | 17 | 82.4% | 2 | 22 | 24 | 20 | 4 | 6 | 16 | 21 | 111 |
Max Min
NBA Alltime Leaders
Games Played
Robert Parish: 1,611Kareem Abdul-Jabbar: 1,560
Vince Carter: 1,541
Dirk Nowitzki: 1,522
John Stockton: 1,504
Points
LeBron James: 40,474Kareem Abdul-Jabbar: 38,387
Karl Malone: 36,928
Kobe Bryant: 33,643
Michael Jordan: 32,292
Steals
John Stockton: 3,265Jason Kidd: 2,684
Chris Paul: 2,614
Michael Jordan: 2,514
Gary Payton: 2,445
Free Throws Made
Karl Malone: 9,787Moses Malone: 8,531
LeBron James: 8,390
Kobe Bryant: 8,378
Oscar Robertson: 7,694