DeMarre Carroll Stats: NBA Career

Welcome to the profile of the versatile NBA player, DeMarre Carroll. Over the course of a decade, Carroll has made his mark on the basketball court while representing a total of eight NBA teams. Let's delve into his journey and accomplishments, as reflected in the statistics from his impressive career.
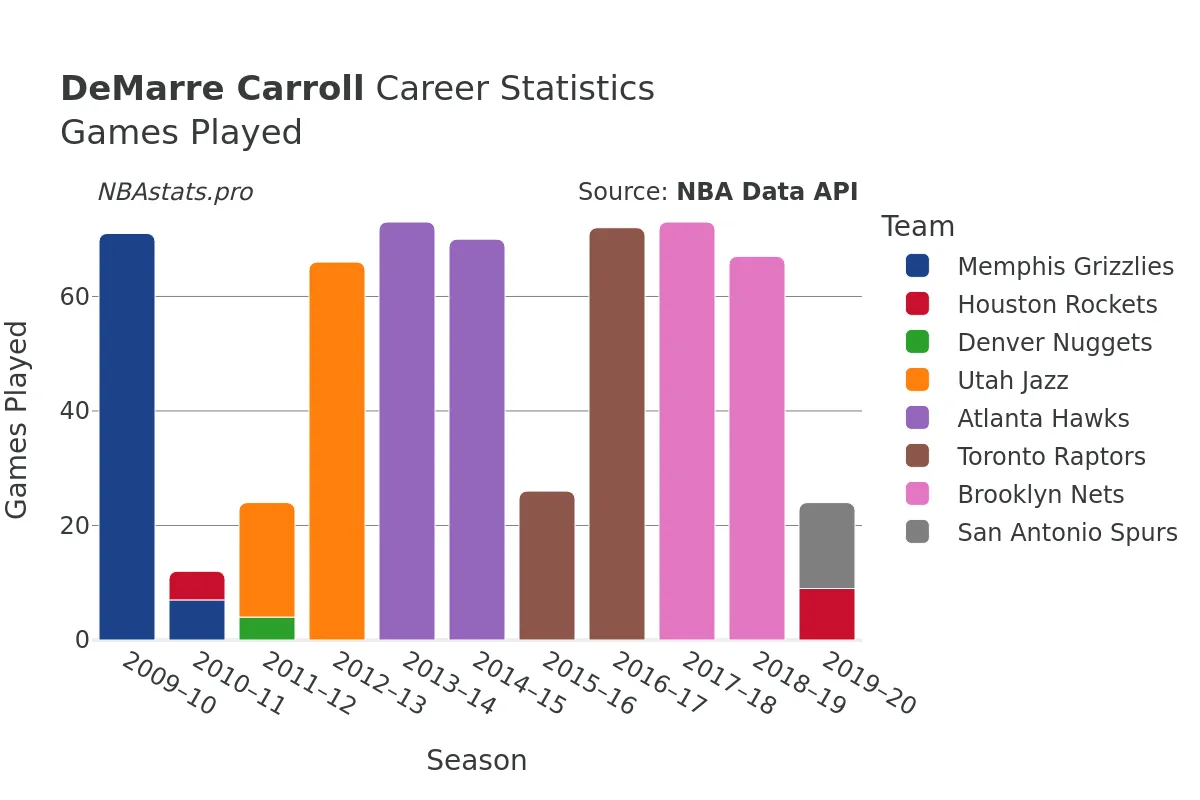
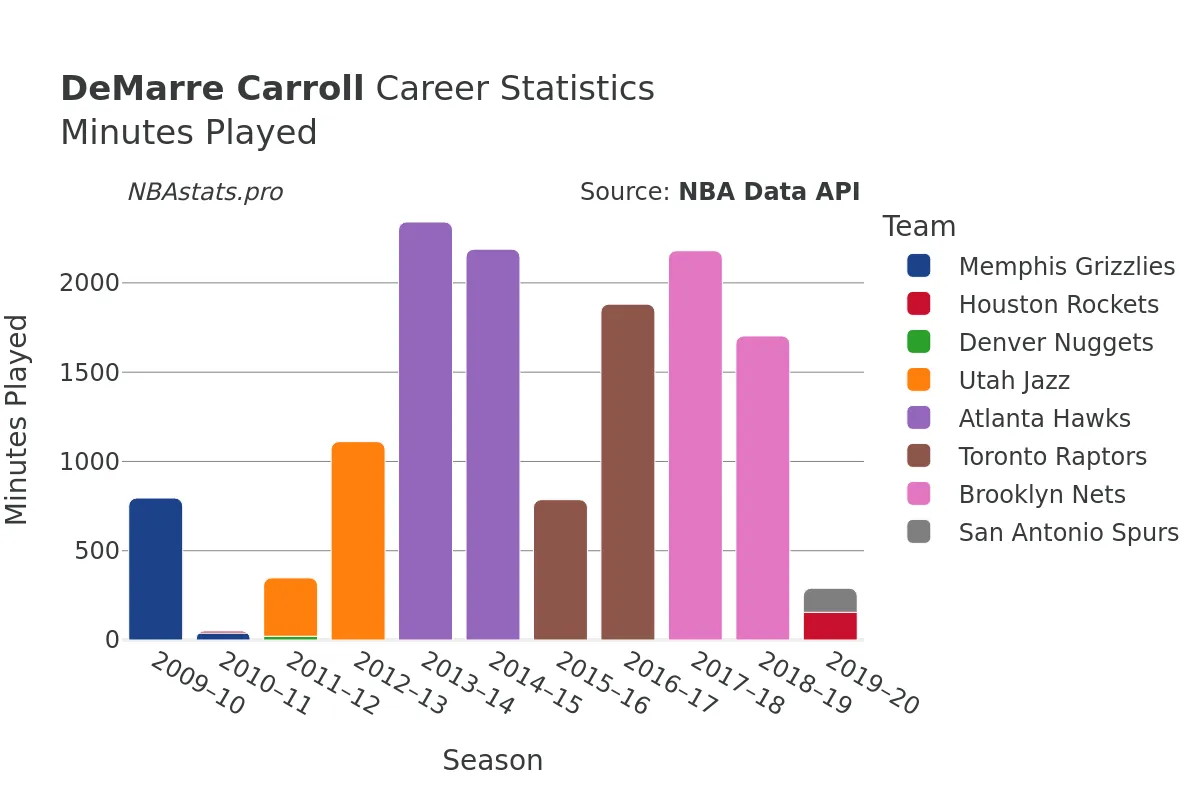
DeMarre Carroll began his professional basketball journey in the 2009-2010 season, starting at the age of 23 years old. His career spanned until the 2019-2020 season, during which time he showcas...ed his skills and resilience on the court. Throughout his career, Carroll played a total of 638 games, accumulating an impressive 14,362 minutes of playing time.
A forward known for his scoring ability, Carroll attempted 4,387 goals and successfully made 1,878 of them, boasting a field goal percentage of approximately 42.8%. His determination and accuracy are further highlighted by his free throw stats, with 925 successful free throws out of 1,248 attempted, showcasing his efficiency at the line.
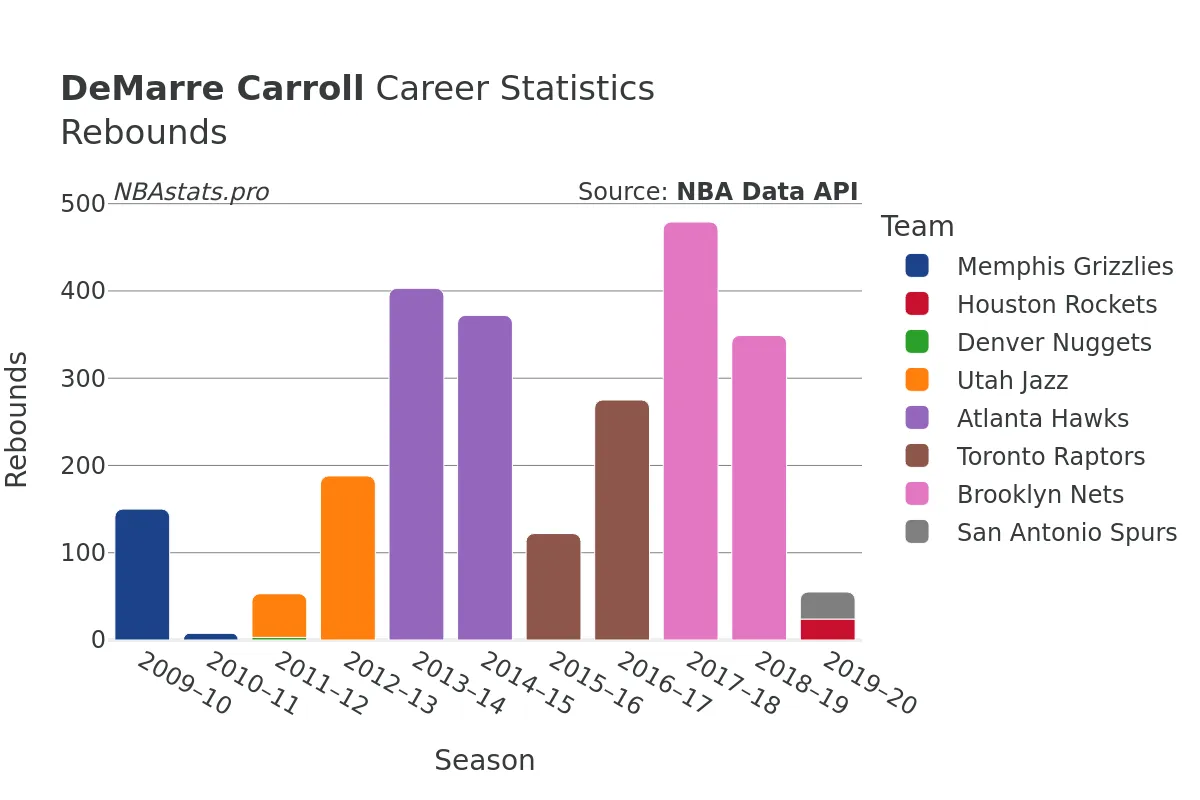
Carroll's impact extended beyond scoring, as evidenced by his prowess in rebounding. He secured a total of 2,570 rebounds throughout his career, with 1,873 defensive rebounds and 697 offensive rebounds. His tenacity on the boards contributed significantly to his team's success and exemplified his commitment to both ends of the court.
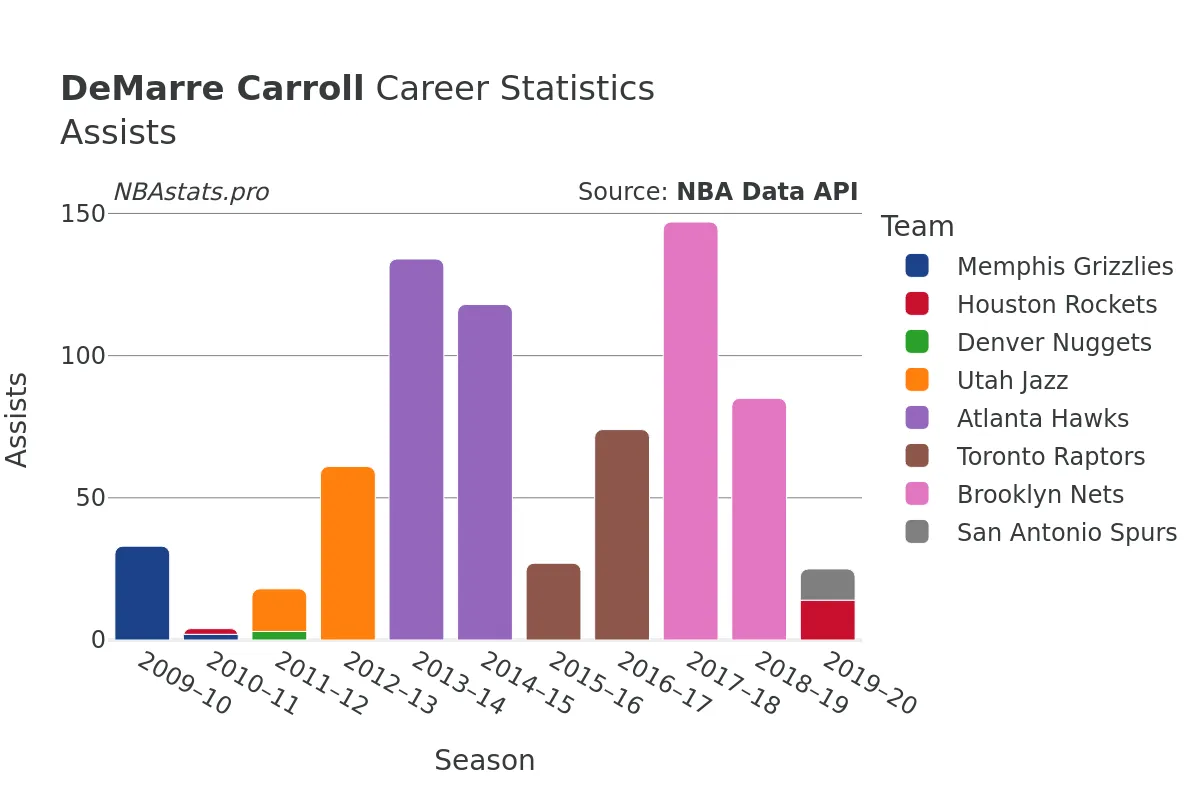
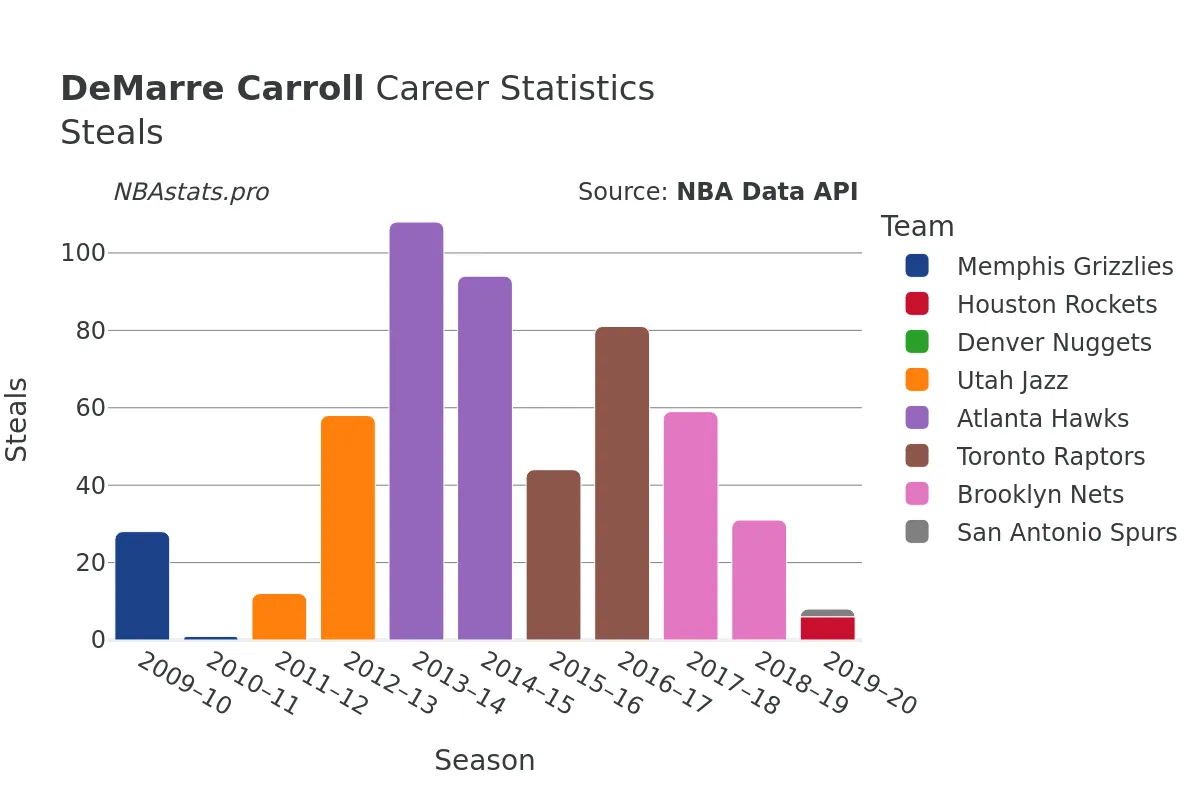
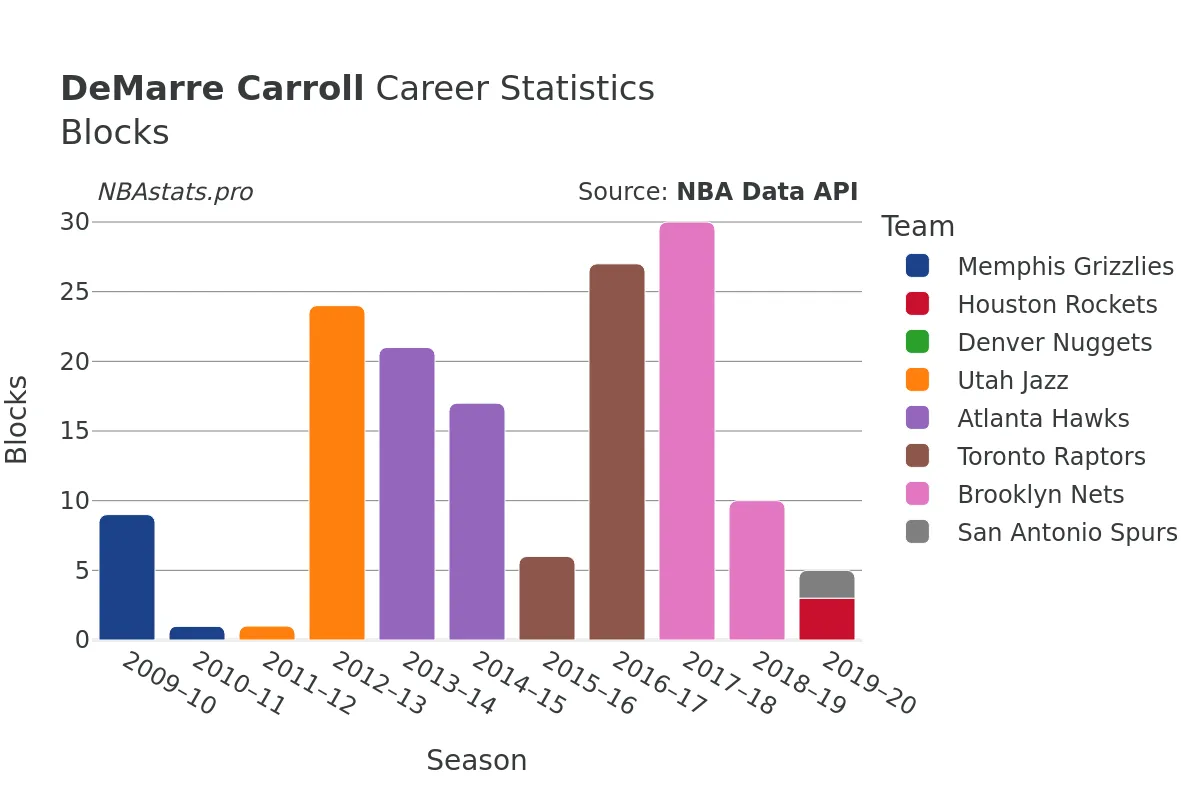
In addition to his scoring and rebounding abilities, Carroll also displayed skill in playmaking and defense. He recorded 773 assists, demonstrating his court vision and willingness to facilitate scoring opportunities for his teammates. Furthermore, Carroll's defensive presence was felt through his impressive tally of 545 steals and 158 blocks, showcasing his versatility and ability to disrupt opponents' offensive plays.
Over the years, DeMarre Carroll showcased consistency and resilience, adapting to various team dynamics and contributing to each franchise he represented. From the Memphis Grizzlies to the San Antonio Spurs, Carroll left a lasting impact on the teams and cities he played for, spanning across Tennessee, Texas, Colorado, Utah, Georgia, Ontario, and New York.
While DeMarre Carroll is no longer active in the NBA, his legacy as a dedicated and skilled player endures. His career statistics reflect his commitment to excellence and his ability to make a meaningful impact on the game of basketball. As you explore the detailed stats and charts on this page, you'll gain a deeper understanding of DeMarre Carroll's contributions to the sport and the teams he represented.
Whether you're a fan of basketball or simply appreciate the dedication and talent of athletes like DeMarre Carroll, this profile offers a glimpse into the career of a player who left his mark on the NBA through his hard work, skill, and unwavering passion for the game. Dive into the numbers, analyze the trends, and discover the story behind the stats of this remarkable NBA player.
Read more
Games Played
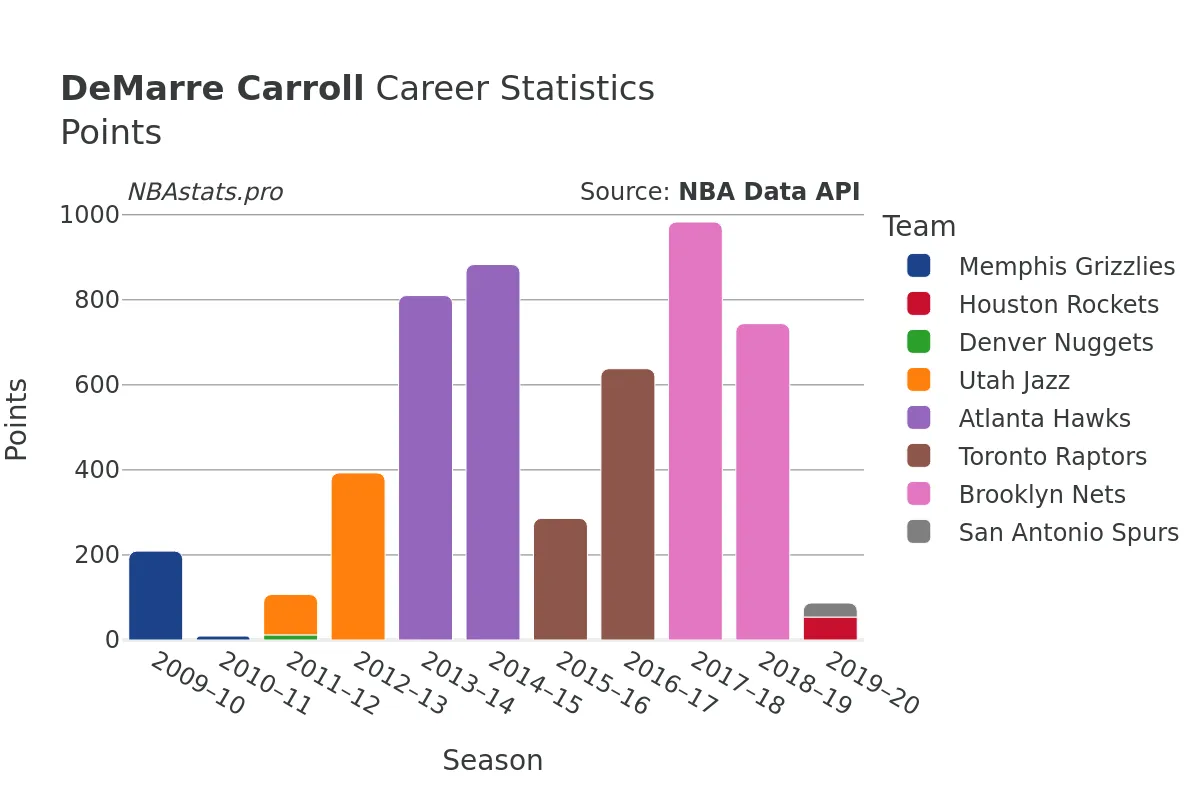
Points
Assists
Rebounds
Steals
Minutes Played
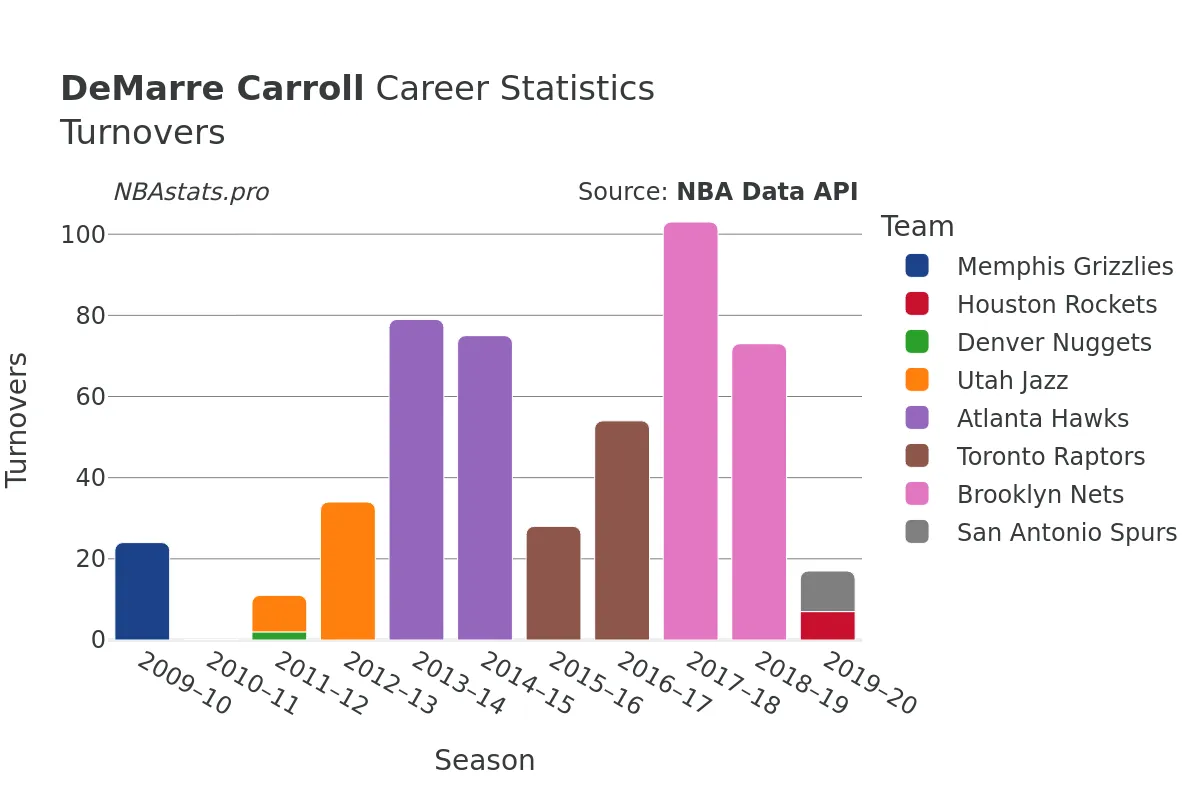
Turnovers
Blocks
DeMarre Carroll Career Stats Table
| SEASON | TEAM | AGE | GP | GS | MIN | FGM | FGA | FG % | FG3M | FG3A | FG3 % | FTM | FTA | FT % | OREB | DREB | REB | AST | STL | BLK | TOV | PF | PTS | |
|---|---|---|---|---|---|---|---|---|---|---|---|---|---|---|---|---|---|---|---|---|---|---|---|---|
| 1 | 2009-10 | MEM | 23 | 71 | 1 | 795 | 88 | 222 | 39.6% | 0 | 6 | 0.0% | 33 | 53 | 62.3% | 53 | 97 | 150 | 33 | 28 | 9 | 24 | 107 | 209 |
| 2 | 2010-11 | MEM | 24 | 7 | 0 | 39 | 4 | 9 | 44.4% | 0 | 0 | 0.0% | 2 | 2 | 100.0% | 2 | 6 | 8 | 2 | 1 | 1 | 0 | 5 | 10 |
| 3 | 2010-11 | HOU | 24 | 5 | 0 | 11 | 0 | 3 | 0.0% | 0 | 0 | 0.0% | 0 | 0 | 0.0% | 0 | 0 | 0 | 2 | 0 | 0 | 0 | 0 | 0 |
| 4 | 2010-11 | TOT | 24 | 12 | 0 | 50 | 4 | 12 | 33.3% | 0 | 0 | 0.0% | 2 | 2 | 100.0% | 2 | 6 | 8 | 4 | 1 | 1 | 0 | 5 | 10 |
| 5 | 2011-12 | DEN | 25 | 4 | 0 | 21 | 6 | 6 | 100.0% | 0 | 0 | 0.0% | 0 | 0 | 0.0% | 0 | 3 | 3 | 3 | 0 | 0 | 2 | 1 | 12 |
| 6 | 2011-12 | UTA | 25 | 20 | 9 | 327 | 37 | 99 | 37.4% | 7 | 19 | 36.8% | 14 | 16 | 87.5% | 28 | 22 | 50 | 15 | 12 | 1 | 9 | 36 | 95 |
| 7 | 2011-12 | TOT | 25 | 24 | 9 | 348 | 43 | 105 | 41.0% | 7 | 19 | 36.8% | 14 | 16 | 87.5% | 28 | 25 | 53 | 18 | 12 | 1 | 11 | 37 | 107 |
| 8 | 2012-13 | UTA | 26 | 66 | 12 | 1,111 | 149 | 324 | 46.0% | 20 | 70 | 28.6% | 75 | 98 | 76.5% | 87 | 101 | 188 | 61 | 58 | 24 | 34 | 119 | 393 |
| 9 | 2013-14 | ATL | 27 | 73 | 73 | 2,341 | 302 | 642 | 47.0% | 97 | 268 | 36.2% | 109 | 141 | 77.3% | 107 | 296 | 403 | 134 | 108 | 21 | 79 | 188 | 810 |
| 10 | 2014-15 | ATL | 28 | 70 | 69 | 2,189 | 318 | 653 | 48.7% | 120 | 304 | 39.5% | 127 | 181 | 70.2% | 99 | 273 | 372 | 118 | 94 | 17 | 75 | 154 | 883 |
| 11 | 2015-16 | TOR | 29 | 26 | 22 | 786 | 105 | 270 | 38.9% | 46 | 118 | 39.0% | 30 | 50 | 60.0% | 31 | 91 | 122 | 27 | 44 | 6 | 28 | 63 | 286 |
| 12 | 2016-17 | TOR | 30 | 72 | 72 | 1,881 | 220 | 550 | 40.0% | 109 | 320 | 34.1% | 89 | 117 | 76.1% | 63 | 212 | 275 | 74 | 81 | 27 | 54 | 143 | 638 |
| 13 | 2017-18 | BKN | 31 | 73 | 73 | 2,180 | 325 | 785 | 41.4% | 145 | 391 | 37.1% | 188 | 246 | 76.4% | 105 | 374 | 479 | 147 | 59 | 30 | 103 | 165 | 983 |
| 14 | 2018-19 | BKN | 32 | 67 | 8 | 1,703 | 227 | 575 | 39.5% | 106 | 310 | 34.2% | 184 | 242 | 76.0% | 68 | 281 | 349 | 85 | 31 | 10 | 73 | 114 | 744 |
| 15 | 2019-20 | SAS | 33 | 15 | 0 | 135 | 9 | 29 | 31.0% | 3 | 13 | 23.1% | 12 | 20 | 60.0% | 7 | 24 | 31 | 11 | 2 | 2 | 10 | 20 | 33 |
| 16 | 2019-20 | HOU | 33 | 9 | 0 | 155 | 16 | 37 | 43.2% | 5 | 20 | 25.0% | 17 | 22 | 77.3% | 5 | 19 | 24 | 14 | 6 | 3 | 7 | 12 | 54 |
| 17 | 2019-20 | TOT | 33 | 24 | 0 | 290 | 25 | 66 | 37.9% | 8 | 33 | 24.2% | 29 | 42 | 69.0% | 12 | 43 | 55 | 25 | 8 | 5 | 17 | 32 | 87 |
Max Min
NBA Alltime Leaders
Games Played
Robert Parish: 1,611Kareem Abdul-Jabbar: 1,560
Vince Carter: 1,541
Dirk Nowitzki: 1,522
John Stockton: 1,504
Points
LeBron James: 40,474Kareem Abdul-Jabbar: 38,387
Karl Malone: 36,928
Kobe Bryant: 33,643
Michael Jordan: 32,292
Steals
John Stockton: 3,265Jason Kidd: 2,684
Chris Paul: 2,614
Michael Jordan: 2,514
Gary Payton: 2,445
Free Throws Made
Karl Malone: 9,787Moses Malone: 8,531
LeBron James: 8,390
Kobe Bryant: 8,378
Oscar Robertson: 7,694