David Wingate Stats: NBA Career

Welcome to the profile page of David Wingate - a talented NBA player whose career spanned from 1986 to 2001. Wingate showcased his skills on various teams, including the Philadelphia 76ers, San Antonio Spurs, Washington Wizards, Charlotte Hornets, Oklahoma City Thunder, and New York Knicks. Let's dive into the numbers and stats that define this player's impressive career.
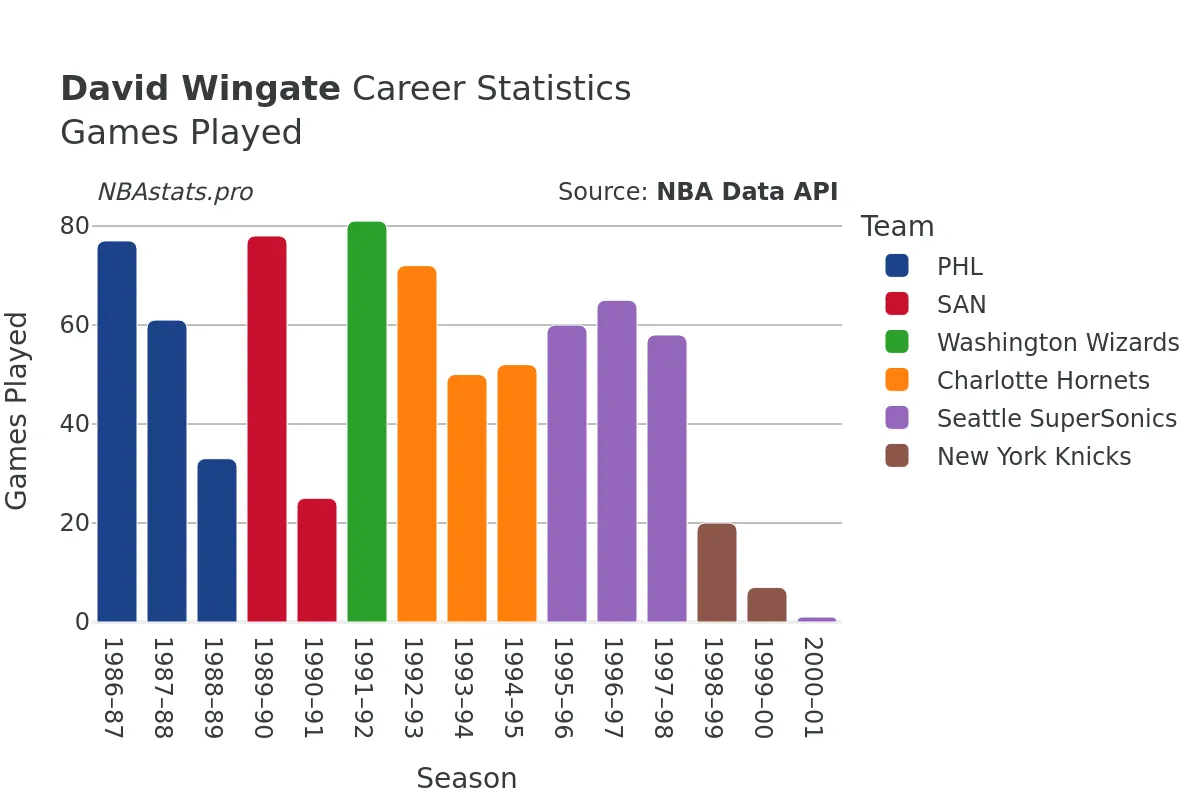
During his active years in the league, Wingate played a total of 740 games, accumulating 13,244 minutes on the court. He was... not only a versatile player but also a reliable scorer, attempting 3,798 goals and making an impressive 1,690 of them, with a shooting percentage of approximately 44.5%. His precision and accuracy on the court were further highlighted by his free throw percentage, which stood at an exceptional level throughout his career.
Wingate's ability to perform under pressure was evident in his free throw stats, where he attempted 958 shots from the line and successfully made 707 of them. This showcased his composure and skill when given the opportunity to score crucial points for his team. His consistency and reliability as a scorer made him a valuable asset on any team he played for.
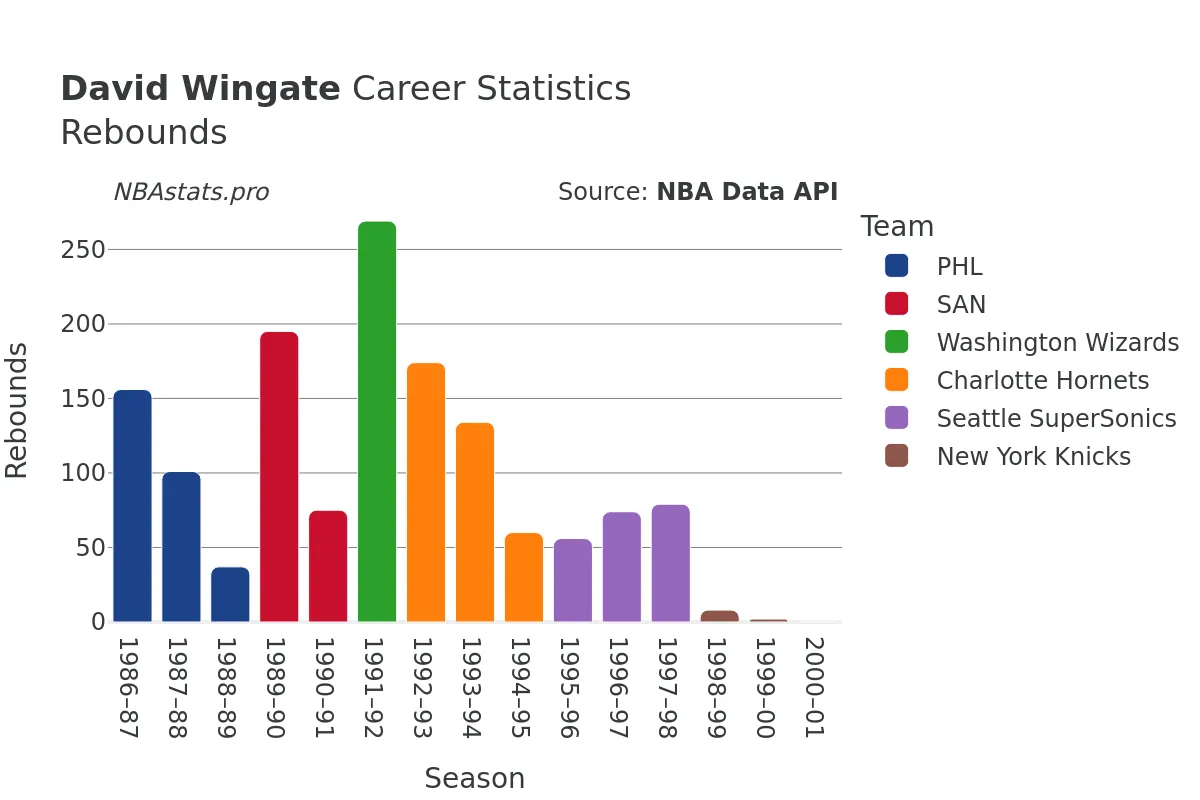
Beyond scoring, Wingate was also a force to be reckoned with on the defensive end of the court. He demonstrated his prowess in rebounding, totaling an impressive 1,420 rebounds throughout his career. Of those rebounds, 975 were defensive, while 445 were offensive, showcasing his ability to contribute on both ends of the court.
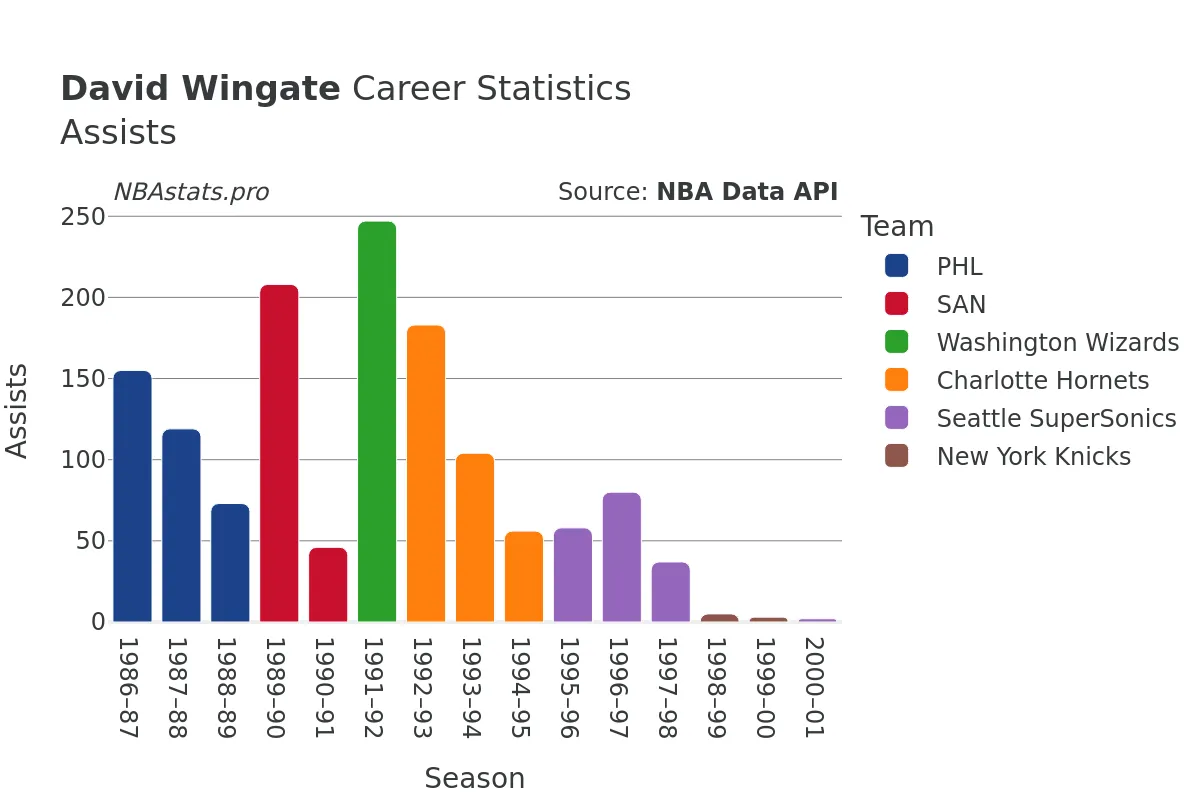
In addition to his rebounding skills, Wingate was also a proficient playmaker, tallying 1,376 assists over the course of his career. His court vision and passing ability allowed him to create scoring opportunities for his teammates, making him a well-rounded player with a comprehensive skill set.
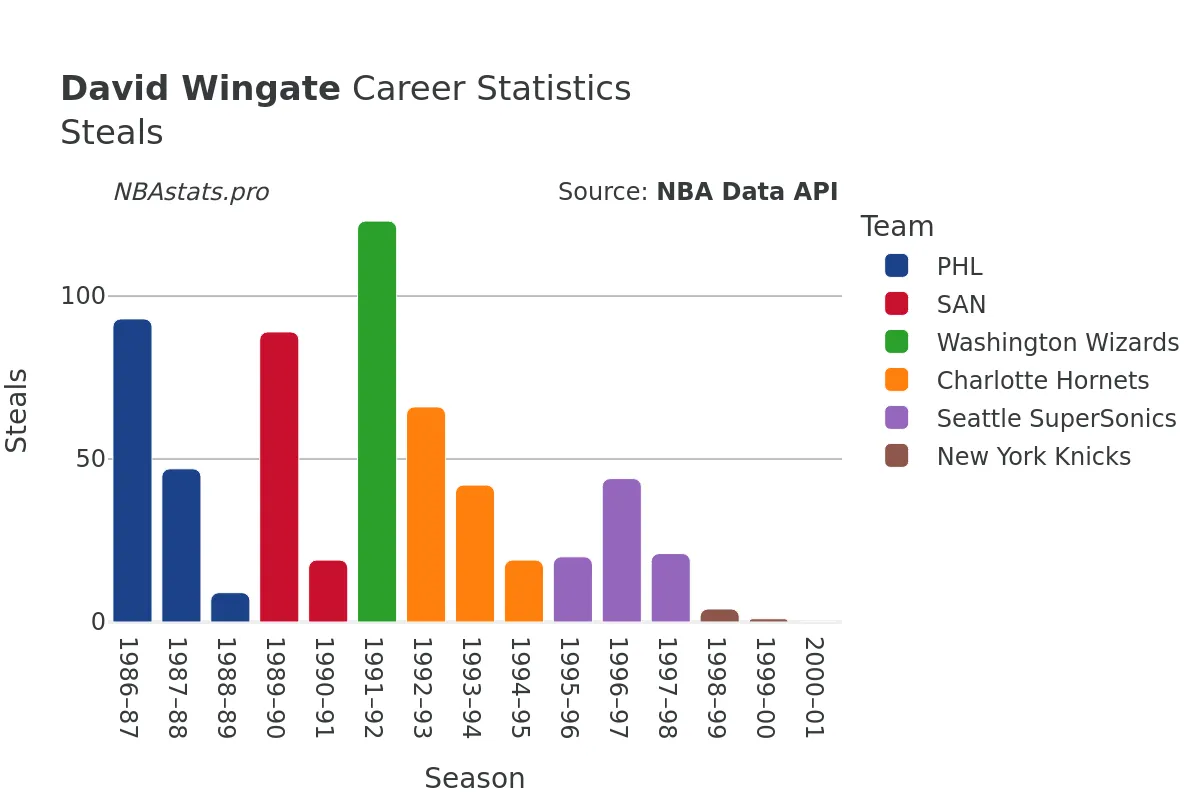
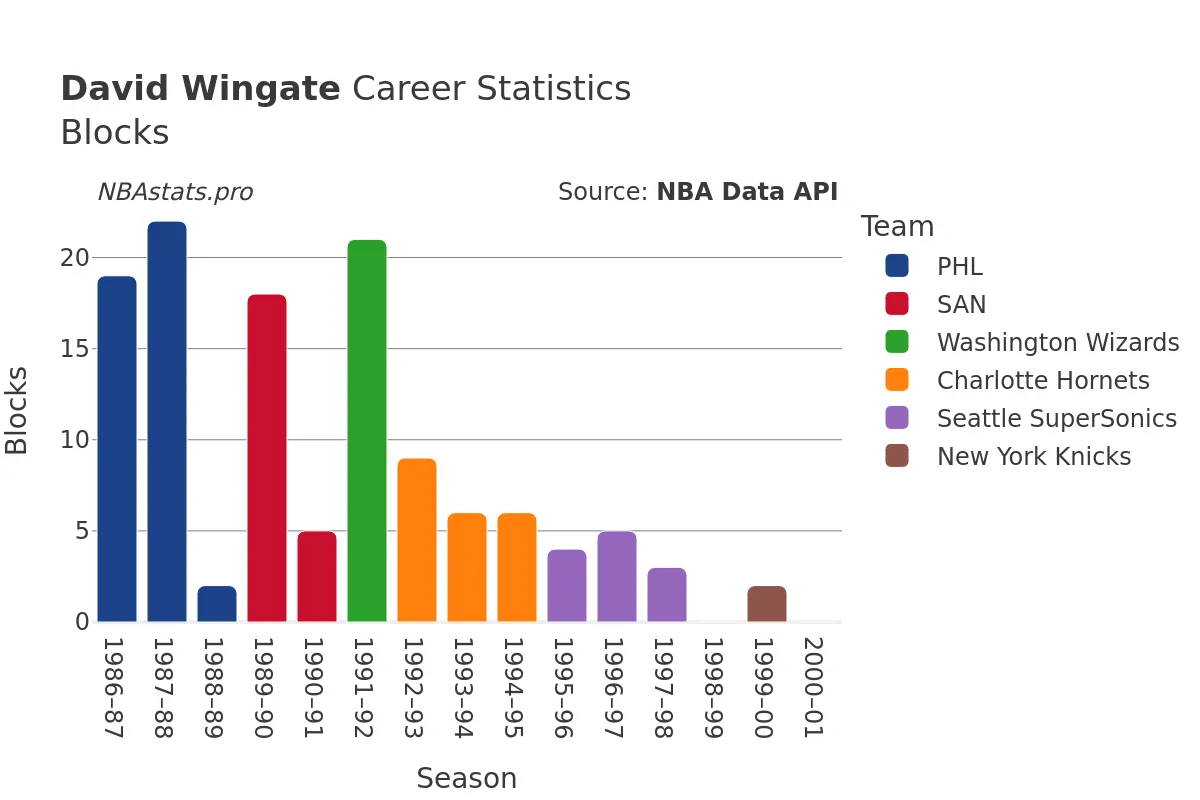
Defensively, Wingate was a standout player, amassing an impressive 597 steals and 122 blocks. His defensive prowess and ability to disrupt the opposing team's offense made him a valuable asset on the court. His quick hands and defensive instincts allowed him to anticipate plays and generate turnovers, turning defense into offense for his team.
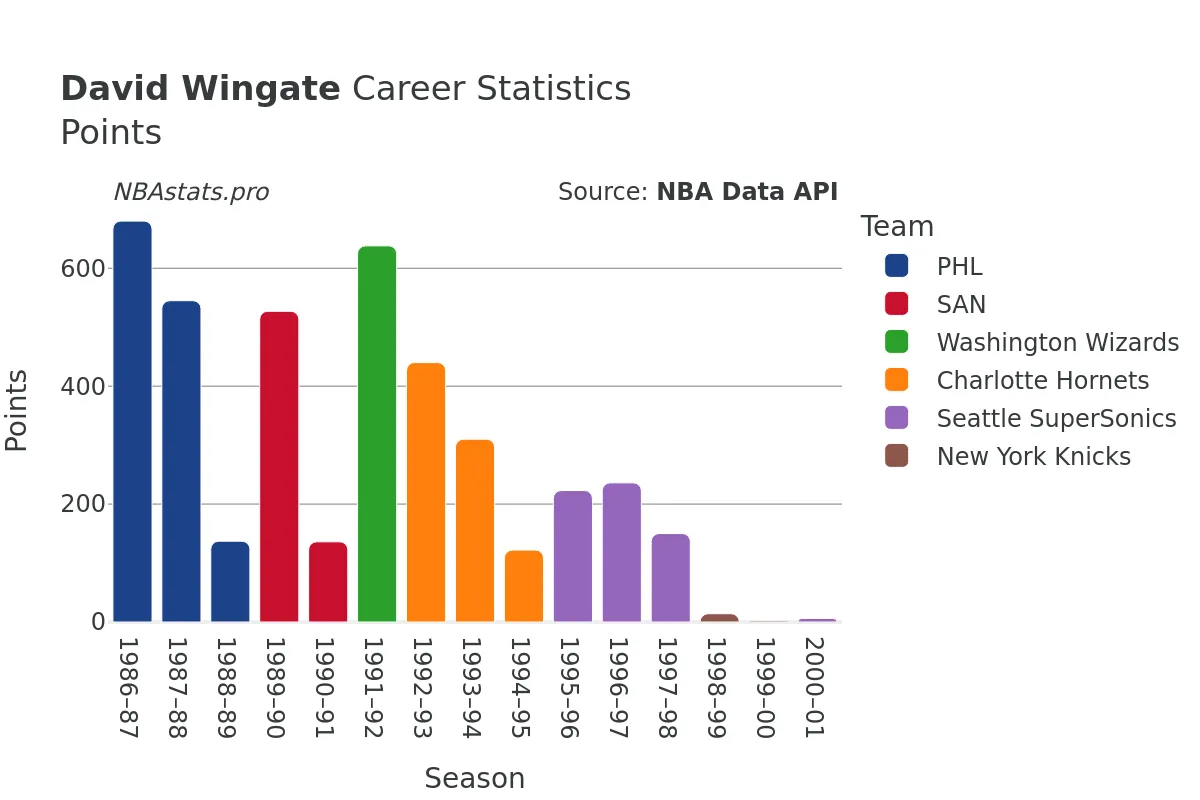
In terms of scoring, Wingate compiled a total of 4,166 points throughout his career. His scoring ability, coupled with his contributions on the boards, as well as his defensive presence, made him a well-rounded and impactful player in the league.
As we delve into the statistics that define David Wingate's career, it becomes evident that he was not only a talented scorer but also a versatile player who made significant contributions on both ends of the court. His longevity in the league, spanning over a decade, is a testament to his skill, work ethic, and dedication to the game of basketball.
For more in-depth analysis and a closer look at David Wingate's career stats, feel free to explore the charts and graphs provided on this page. Let's celebrate the career of this remarkable NBA player and appreciate the impact he made during his time in the league.
Read more
Games Played
Points
Assists
Rebounds
Steals
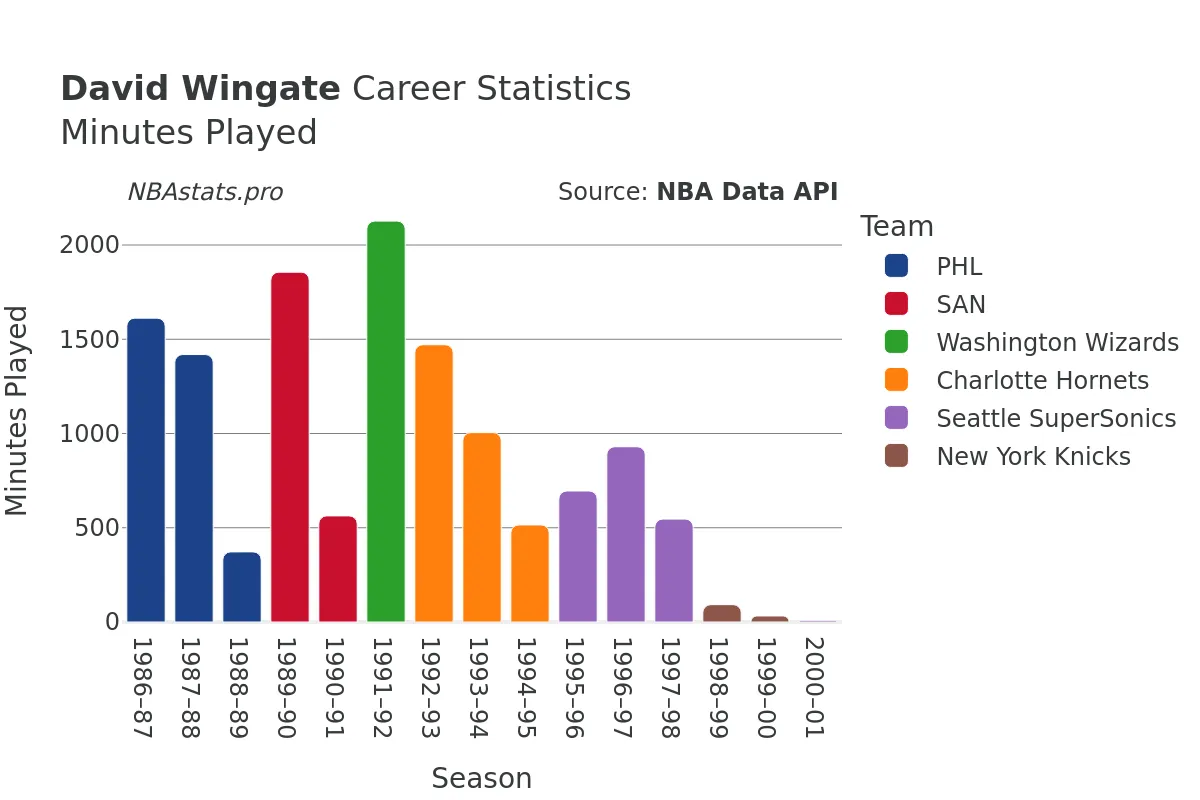
Minutes Played
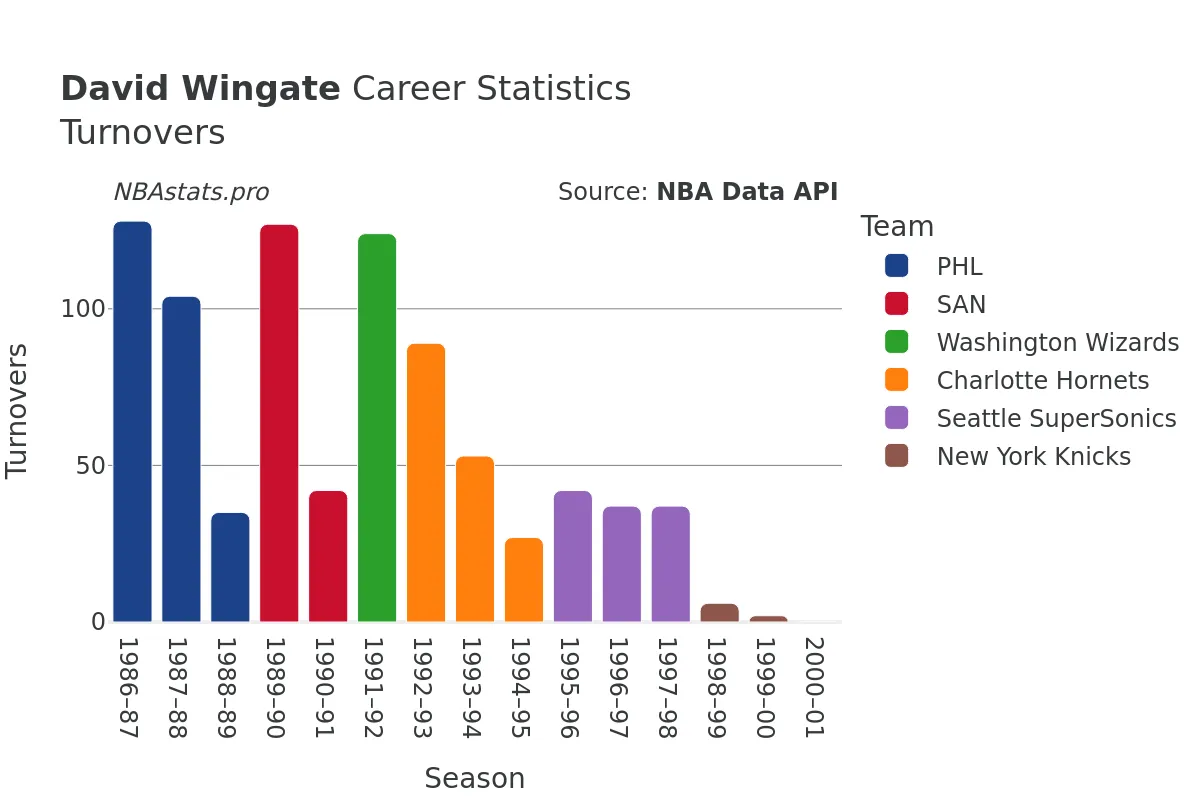
Turnovers
Blocks
David Wingate Career Stats Table
| SEASON | TEAM | AGE | GP | GS | MIN | FGM | FGA | FG % | FG3M | FG3A | FG3 % | FTM | FTA | FT % | OREB | DREB | REB | AST | STL | BLK | TOV | PF | PTS | |
|---|---|---|---|---|---|---|---|---|---|---|---|---|---|---|---|---|---|---|---|---|---|---|---|---|
| 1 | 1986-87 | PHL | 23 | 77 | 9 | 1,612 | 259 | 602 | 43.0% | 13 | 52 | 25.0% | 149 | 201 | 74.1% | 70 | 86 | 156 | 155 | 93 | 19 | 128 | 169 | 680 |
| 2 | 1987-88 | PHL | 24 | 61 | 22 | 1,419 | 218 | 545 | 40.0% | 10 | 40 | 25.0% | 99 | 132 | 75.0% | 44 | 57 | 101 | 119 | 47 | 22 | 104 | 125 | 545 |
| 3 | 1988-89 | PHL | 25 | 33 | 6 | 372 | 54 | 115 | 47.0% | 2 | 6 | 33.3% | 27 | 34 | 79.4% | 12 | 25 | 37 | 73 | 9 | 2 | 35 | 43 | 137 |
| 4 | 1989-90 | SAN | 26 | 78 | 2 | 1,856 | 220 | 491 | 44.8% | 0 | 13 | 0.0% | 87 | 112 | 77.7% | 62 | 133 | 195 | 208 | 89 | 18 | 127 | 154 | 527 |
| 5 | 1990-91 | SAN | 27 | 25 | 0 | 563 | 53 | 138 | 38.4% | 1 | 9 | 11.1% | 29 | 41 | 70.7% | 24 | 51 | 75 | 46 | 19 | 5 | 42 | 66 | 136 |
| 6 | 1991-92 | WAS | 28 | 81 | 72 | 2,127 | 266 | 572 | 46.5% | 1 | 18 | 5.6% | 105 | 146 | 71.9% | 80 | 189 | 269 | 247 | 123 | 21 | 124 | 162 | 638 |
| 7 | 1992-93 | CHH | 29 | 72 | 55 | 1,471 | 180 | 336 | 53.6% | 1 | 6 | 16.7% | 79 | 107 | 73.8% | 49 | 125 | 174 | 183 | 66 | 9 | 89 | 135 | 440 |
| 8 | 1993-94 | CHH | 30 | 50 | 36 | 1,005 | 136 | 283 | 48.1% | 4 | 12 | 33.3% | 34 | 51 | 66.7% | 30 | 104 | 134 | 104 | 42 | 6 | 53 | 85 | 310 |
| 9 | 1994-95 | CHH | 31 | 52 | 9 | 515 | 50 | 122 | 41.0% | 4 | 22 | 18.2% | 18 | 24 | 75.0% | 11 | 49 | 60 | 56 | 19 | 6 | 27 | 60 | 122 |
| 10 | 1995-96 | SEA | 32 | 60 | 3 | 695 | 88 | 212 | 41.5% | 15 | 34 | 44.1% | 32 | 41 | 78.0% | 17 | 39 | 56 | 58 | 20 | 4 | 42 | 66 | 223 |
| 11 | 1996-97 | SEA | 33 | 65 | 2 | 930 | 89 | 214 | 41.6% | 25 | 71 | 35.2% | 33 | 40 | 82.5% | 23 | 51 | 74 | 80 | 44 | 5 | 37 | 108 | 236 |
| 12 | 1997-98 | SEA | 34 | 58 | 2 | 546 | 66 | 140 | 47.1% | 3 | 7 | 42.9% | 15 | 29 | 51.7% | 19 | 60 | 79 | 37 | 21 | 3 | 37 | 58 | 150 |
| 13 | 1998-99 | NYK | 35 | 20 | 0 | 92 | 7 | 16 | 43.8% | 0 | 0 | 0.0% | 0 | 0 | 0.0% | 3 | 5 | 8 | 5 | 4 | 0 | 6 | 10 | 14 |
| 14 | 1999-00 | NYK | 36 | 7 | 0 | 32 | 1 | 9 | 11.1% | 0 | 0 | 0.0% | 0 | 0 | 0.0% | 1 | 1 | 2 | 3 | 1 | 2 | 2 | 7 | 2 |
| 15 | 2000-01 | SEA | 37 | 1 | 0 | 9 | 3 | 3 | 100.0% | 0 | 0 | 0.0% | 0 | 0 | 0.0% | 0 | 0 | 0 | 2 | 0 | 0 | 0 | 1 | 6 |
Max Min
NBA Alltime Leaders
Games Played
Robert Parish: 1,611Kareem Abdul-Jabbar: 1,560
Vince Carter: 1,541
Dirk Nowitzki: 1,522
John Stockton: 1,504
Points
LeBron James: 40,474Kareem Abdul-Jabbar: 38,387
Karl Malone: 36,928
Kobe Bryant: 33,643
Michael Jordan: 32,292
Steals
John Stockton: 3,265Jason Kidd: 2,684
Chris Paul: 2,614
Michael Jordan: 2,514
Gary Payton: 2,445
Free Throws Made
Karl Malone: 9,787Moses Malone: 8,531
LeBron James: 8,390
Kobe Bryant: 8,378
Oscar Robertson: 7,694