David Lee Stats: NBA Career

David Lee: The Versatile Power Forward
David Lee is a name that resonates with NBA fans who have witnessed his sheer talent and versatility on the court. During his illustrious career with five different teams - the New York Knicks, Golden State Warriors, Boston Celtics, Dallas Mavericks, and San Antonio Spurs - Lee left an indelible mark with his exceptional skill set and work ethic.
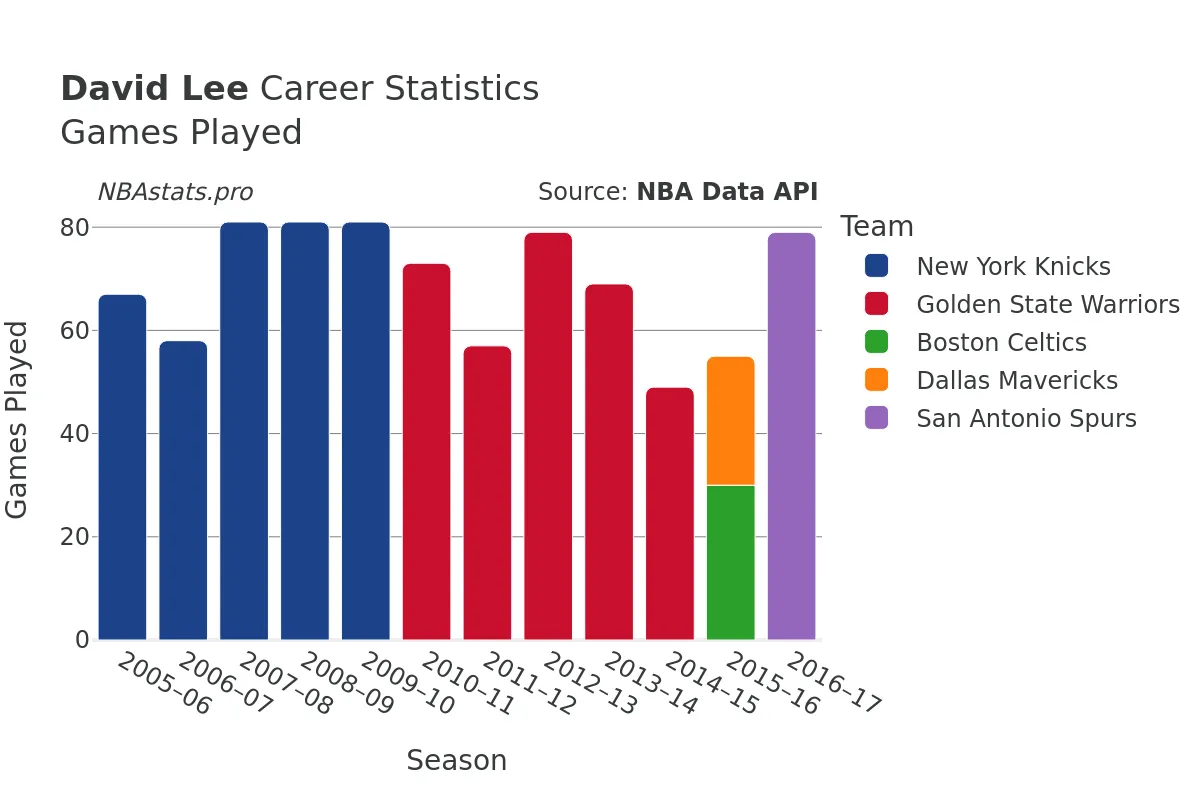
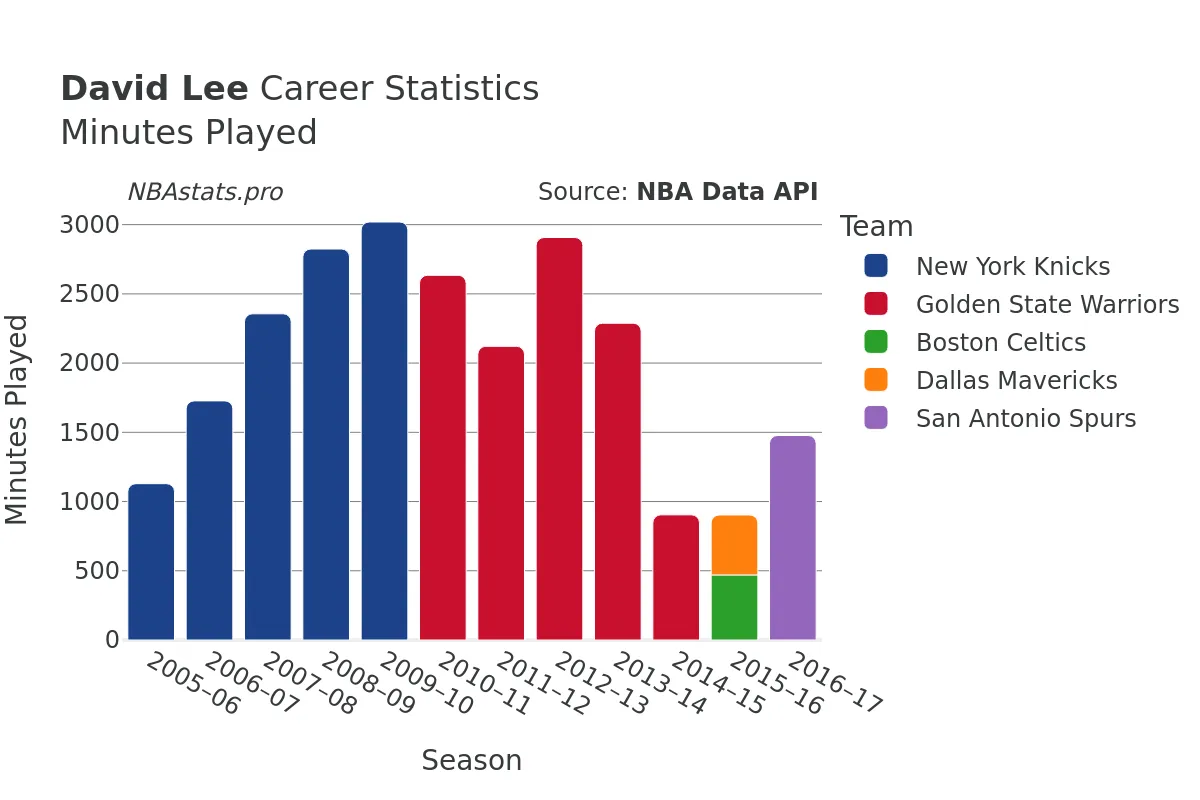
Lee's journey in the NBA commenced in the 2005-06 season with the New York Knicks where he quickly establishe...d himself as a force to be reckoned with. Standing at 6 feet 9 inches, Lee's presence on the court was impactful, to say the least. Throughout his 12-year career, the power forward played a total of 884 games, amassing an impressive 25,192 minutes of playtime.
A true marksman, Lee attempted 8,901 field goals during his time in the NBA, successfully making 4,765 of them at an impressive shooting percentage of 53.53%. His ability to convert scoring opportunities made him a valuable asset to every team he played for. Furthermore, Lee's prowess extended to the free-throw line, where he displayed consistency and accuracy. With 2,759 free throws attempted and 2,128 made, Lee boasted a free-throw percentage that solidified his reputation as a reliable scorer.
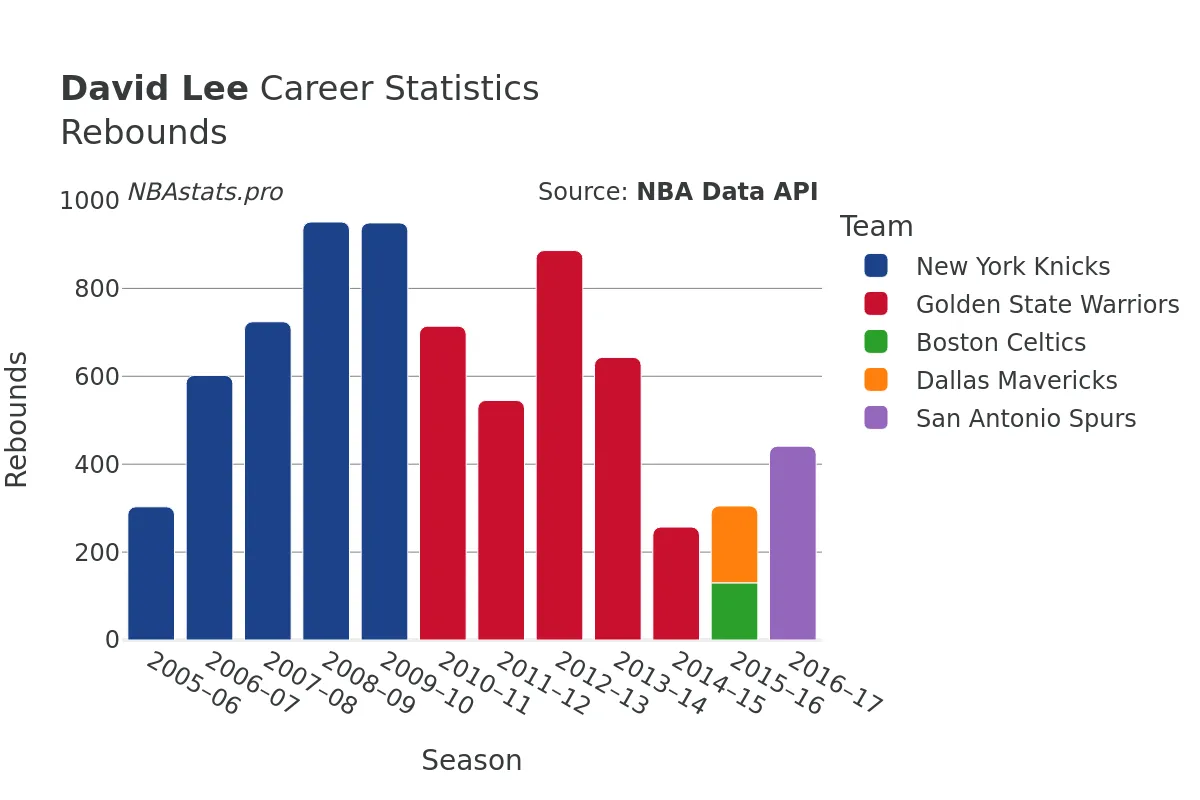
However, Lee's impact was not limited to scoring alone. His dominance on the boards was a sight to behold, as evidenced by his remarkable rebounding statistics. Over the course of his career, Lee tallied an impressive 7,625 rebounds, with 5,374 on the defensive end and 2,251 on the offensive end. His tenacity under the basket and ability to secure crucial rebounds were instrumental in giving his teams a competitive edge.
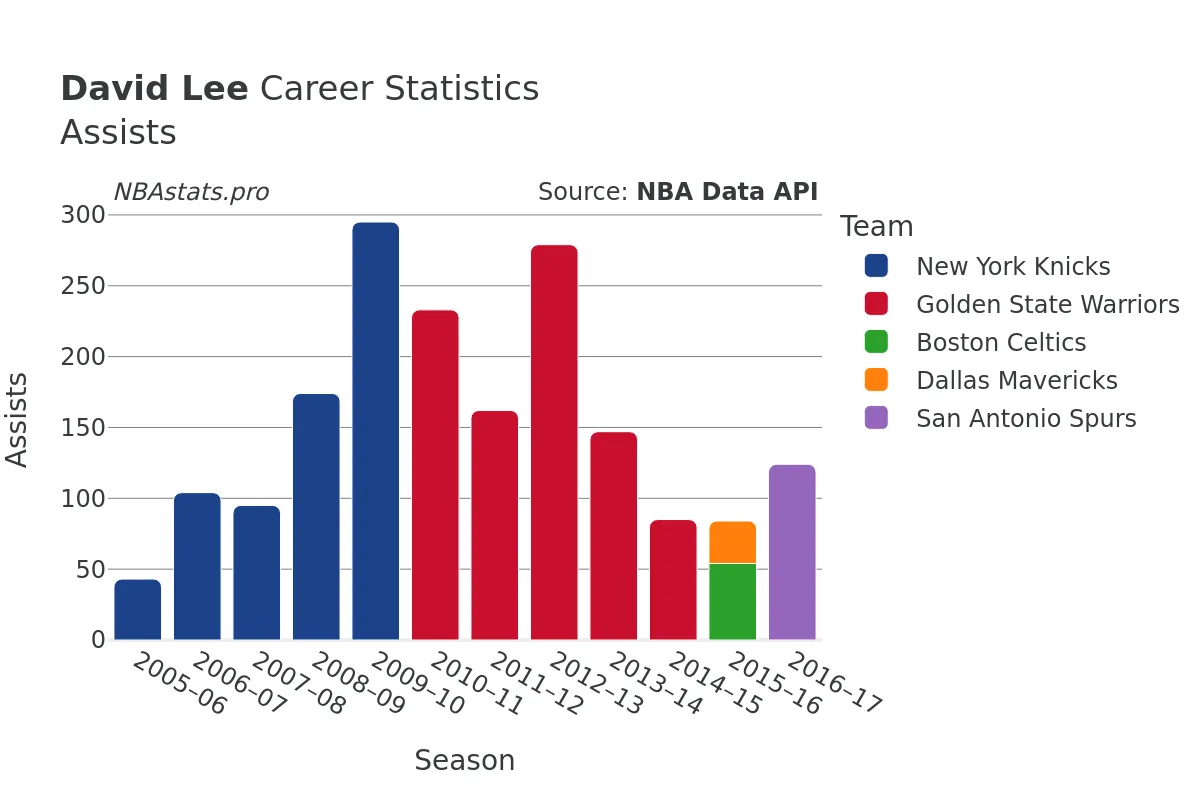
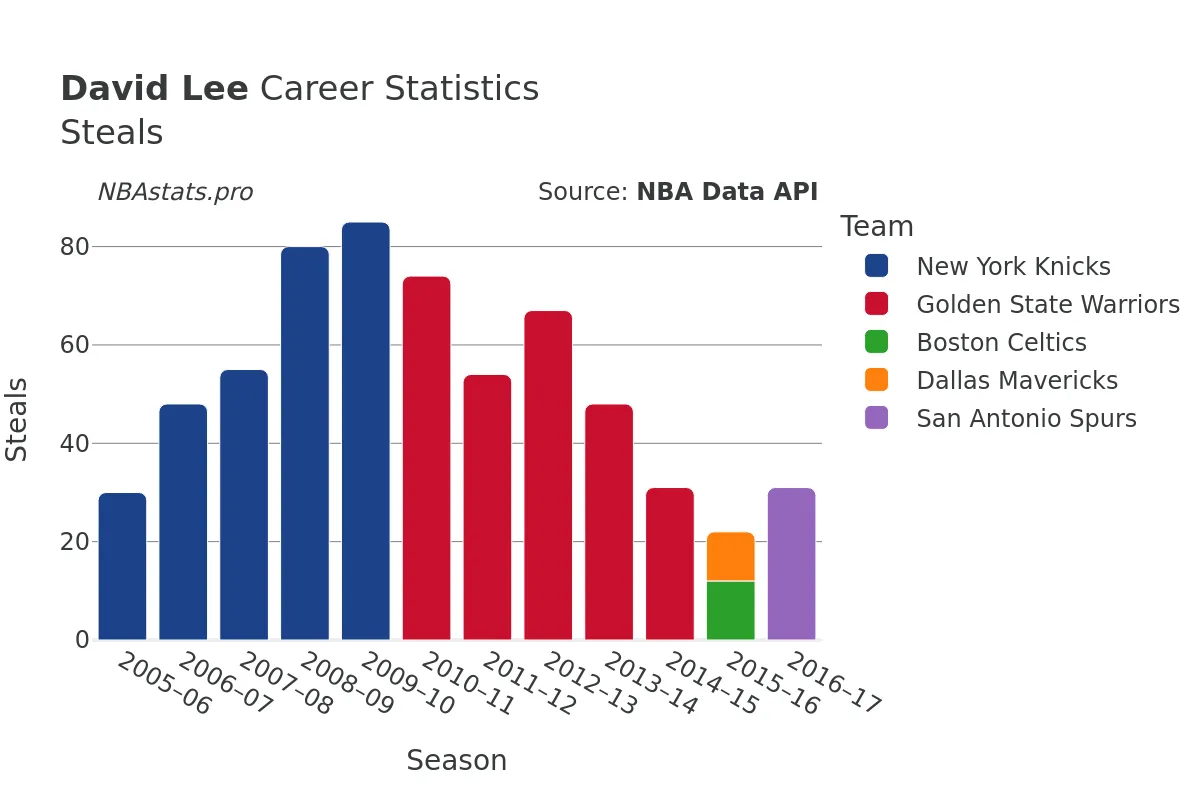
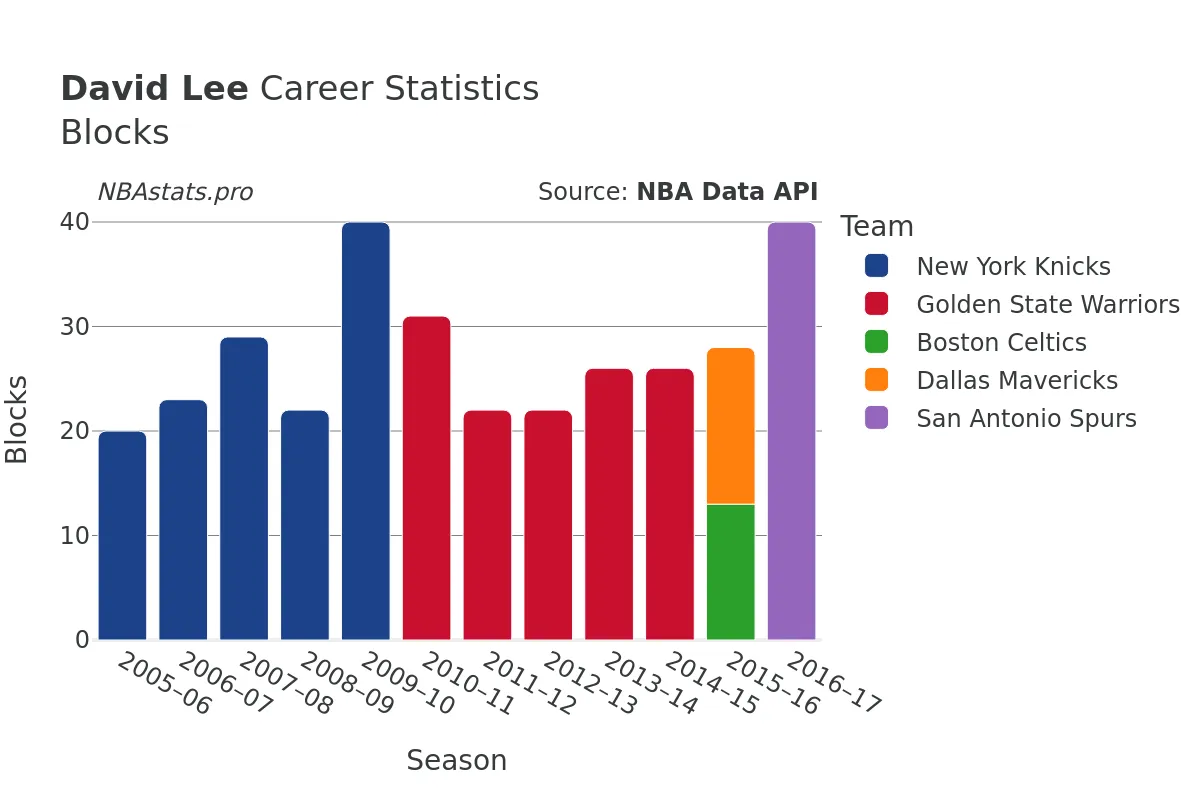
In addition to his scoring and rebounding abilities, Lee showcased his playmaking skills through his 1,909 career assists. His court vision and passing acumen set him apart as a well-rounded player capable of contributing in multiple facets of the game. Moreover, Lee's defensive prowess was evident in his 647 steals and 357 blocks, underscoring his commitment to making an impact on both ends of the floor.
Lee's contributions extended beyond the stat sheet, as his leadership and professionalism were widely recognized by teammates, coaches, and fans alike. His work ethic and dedication to his craft served as an inspiration to those around him, embodying the values of hard work and perseverance that define the spirit of the game.
Although Lee's playing days in the NBA have come to a close, his legacy lives on through his impressive body of work and the memories he created on the hardwood. As fans and analysts reflect on his career, one thing remains clear - David Lee will always be remembered as a versatile power forward who left an indelible impact on the game of basketball.
For a deeper dive into David Lee's career statistics and performance metrics, explore the charts and data provided on this page. Gain insights into the player's impact on various teams and uncover the nuances of his playing style that made him a standout performer in the NBA.
Read more
Games Played
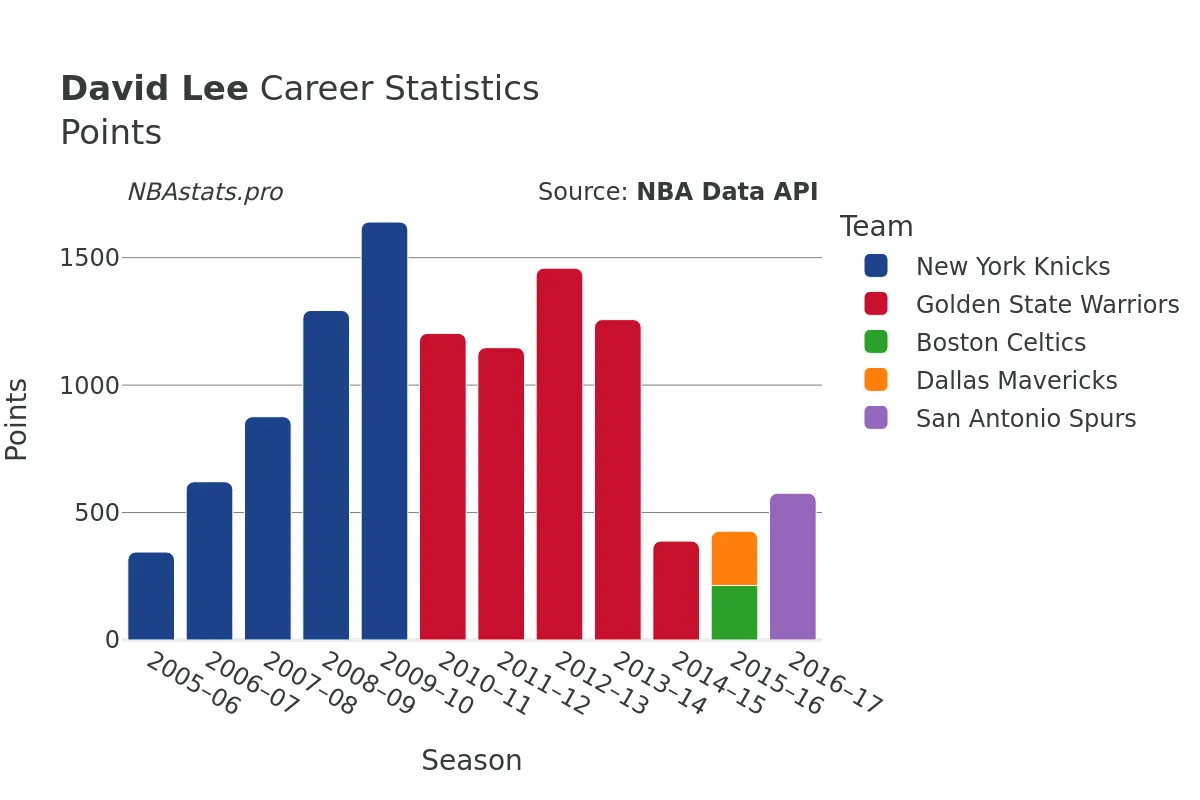
Points
Assists
Rebounds
Steals
Minutes Played
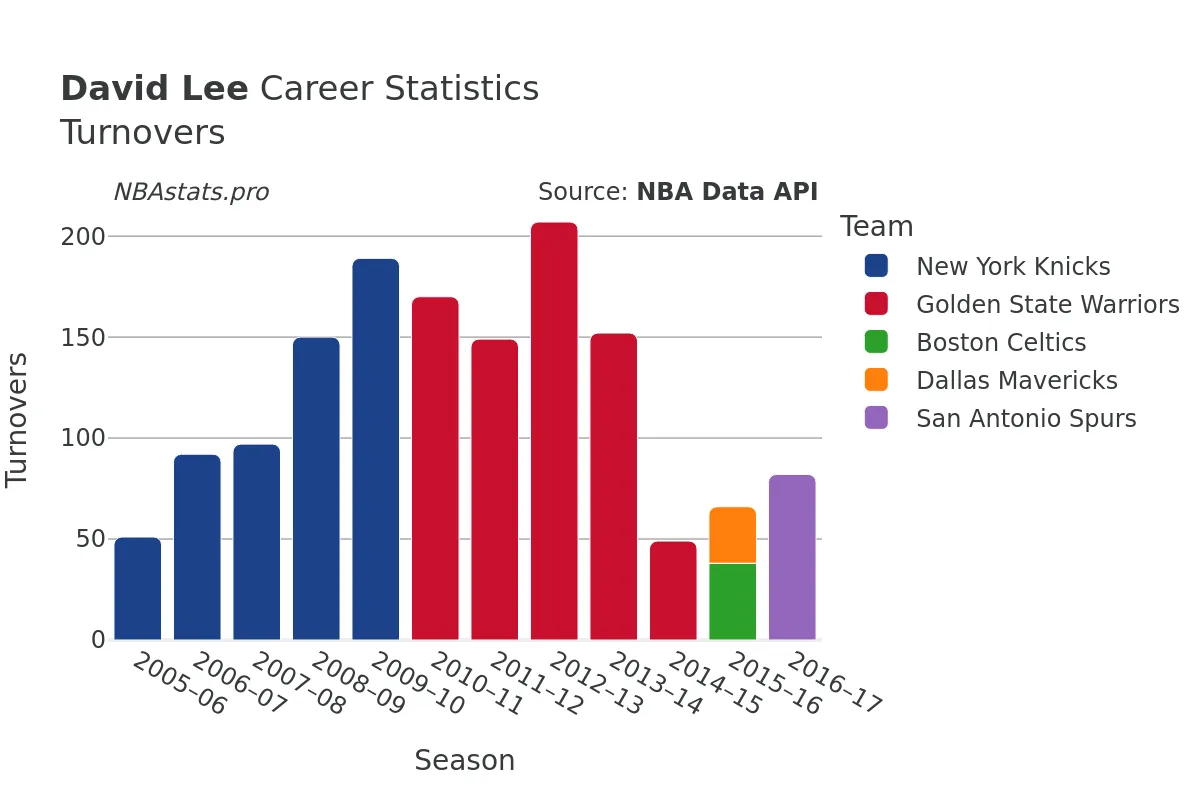
Turnovers
Blocks
David Lee Career Stats Table
| SEASON | TEAM | AGE | GP | GS | MIN | FGM | FGA | FG % | FG3M | FG3A | FG3 % | FTM | FTA | FT % | OREB | DREB | REB | AST | STL | BLK | TOV | PF | PTS | |
|---|---|---|---|---|---|---|---|---|---|---|---|---|---|---|---|---|---|---|---|---|---|---|---|---|
| 1 | 2005-06 | NYK | 23 | 67 | 14 | 1,129 | 137 | 230 | 59.6% | 0 | 0 | 0.0% | 71 | 123 | 57.7% | 109 | 194 | 303 | 43 | 30 | 20 | 51 | 124 | 345 |
| 2 | 2006-07 | NYK | 24 | 58 | 12 | 1,727 | 240 | 400 | 60.0% | 0 | 0 | 0.0% | 141 | 173 | 81.5% | 196 | 406 | 602 | 104 | 48 | 23 | 92 | 155 | 621 |
| 3 | 2007-08 | NYK | 25 | 81 | 29 | 2,356 | 341 | 618 | 55.2% | 0 | 2 | 0.0% | 194 | 237 | 81.9% | 242 | 482 | 724 | 95 | 55 | 29 | 97 | 210 | 876 |
| 4 | 2008-09 | NYK | 26 | 81 | 74 | 2,824 | 522 | 951 | 54.9% | 0 | 3 | 0.0% | 249 | 330 | 75.5% | 256 | 695 | 951 | 174 | 80 | 22 | 150 | 260 | 1,293 |
| 5 | 2009-10 | NYK | 27 | 81 | 81 | 3,019 | 686 | 1,258 | 54.5% | 0 | 8 | 0.0% | 268 | 330 | 81.2% | 228 | 721 | 949 | 295 | 85 | 40 | 189 | 257 | 1,640 |
| 6 | 2010-11 | GSW | 28 | 73 | 73 | 2,634 | 496 | 978 | 50.7% | 1 | 3 | 33.3% | 210 | 267 | 78.7% | 217 | 497 | 714 | 233 | 74 | 31 | 170 | 211 | 1,203 |
| 7 | 2011-12 | GSW | 29 | 57 | 57 | 2,121 | 464 | 922 | 50.3% | 0 | 5 | 0.0% | 219 | 280 | 78.2% | 171 | 374 | 545 | 162 | 54 | 22 | 149 | 179 | 1,147 |
| 8 | 2012-13 | GSW | 30 | 79 | 79 | 2,907 | 602 | 1,160 | 51.9% | 0 | 4 | 0.0% | 255 | 320 | 79.7% | 218 | 668 | 886 | 279 | 67 | 22 | 207 | 246 | 1,459 |
| 9 | 2013-14 | GSW | 31 | 69 | 67 | 2,288 | 513 | 981 | 52.3% | 0 | 1 | 0.0% | 231 | 296 | 78.0% | 182 | 461 | 643 | 147 | 48 | 26 | 152 | 206 | 1,257 |
| 10 | 2014-15 | GSW | 32 | 49 | 4 | 904 | 160 | 313 | 51.1% | 0 | 2 | 0.0% | 68 | 104 | 65.4% | 81 | 176 | 257 | 85 | 31 | 26 | 49 | 83 | 388 |
| 11 | 2015-16 | BOS | 33 | 30 | 4 | 470 | 87 | 192 | 45.3% | 0 | 1 | 0.0% | 40 | 51 | 78.4% | 41 | 89 | 130 | 54 | 12 | 13 | 38 | 51 | 214 |
| 12 | 2015-16 | DAL | 33 | 25 | 1 | 433 | 91 | 143 | 63.6% | 0 | 0 | 0.0% | 31 | 42 | 73.8% | 60 | 115 | 175 | 30 | 10 | 15 | 28 | 63 | 213 |
| 13 | 2015-16 | TOT | 33 | 55 | 5 | 903 | 178 | 335 | 53.1% | 0 | 1 | 0.0% | 71 | 93 | 76.3% | 101 | 204 | 305 | 84 | 22 | 28 | 66 | 114 | 427 |
| 14 | 2016-17 | SAS | 34 | 79 | 10 | 1,477 | 248 | 420 | 59.0% | 0 | 0 | 0.0% | 80 | 113 | 70.8% | 149 | 292 | 441 | 124 | 31 | 40 | 82 | 125 | 576 |
Max Min
NBA Alltime Leaders
Games Played
Robert Parish: 1,611Kareem Abdul-Jabbar: 1,560
Vince Carter: 1,541
Dirk Nowitzki: 1,522
John Stockton: 1,504
Points
LeBron James: 40,474Kareem Abdul-Jabbar: 38,387
Karl Malone: 36,928
Kobe Bryant: 33,643
Michael Jordan: 32,292
Steals
John Stockton: 3,265Jason Kidd: 2,684
Chris Paul: 2,614
Michael Jordan: 2,514
Gary Payton: 2,445
Free Throws Made
Karl Malone: 9,787Moses Malone: 8,531
LeBron James: 8,390
Kobe Bryant: 8,378
Oscar Robertson: 7,694