Courtney Lee Stats: NBA Career

Welcome to the profile page of Courtney Lee, a seasoned NBA player whose career spanned over twelve years across eight different teams. Lee's journey in the NBA began with the Orlando Magic during the 2008-09 season and concluded with the Dallas Mavericks in the 2019-20 season. Let's dive into the fascinating stats and details that define the career of this skilled shooting guard.
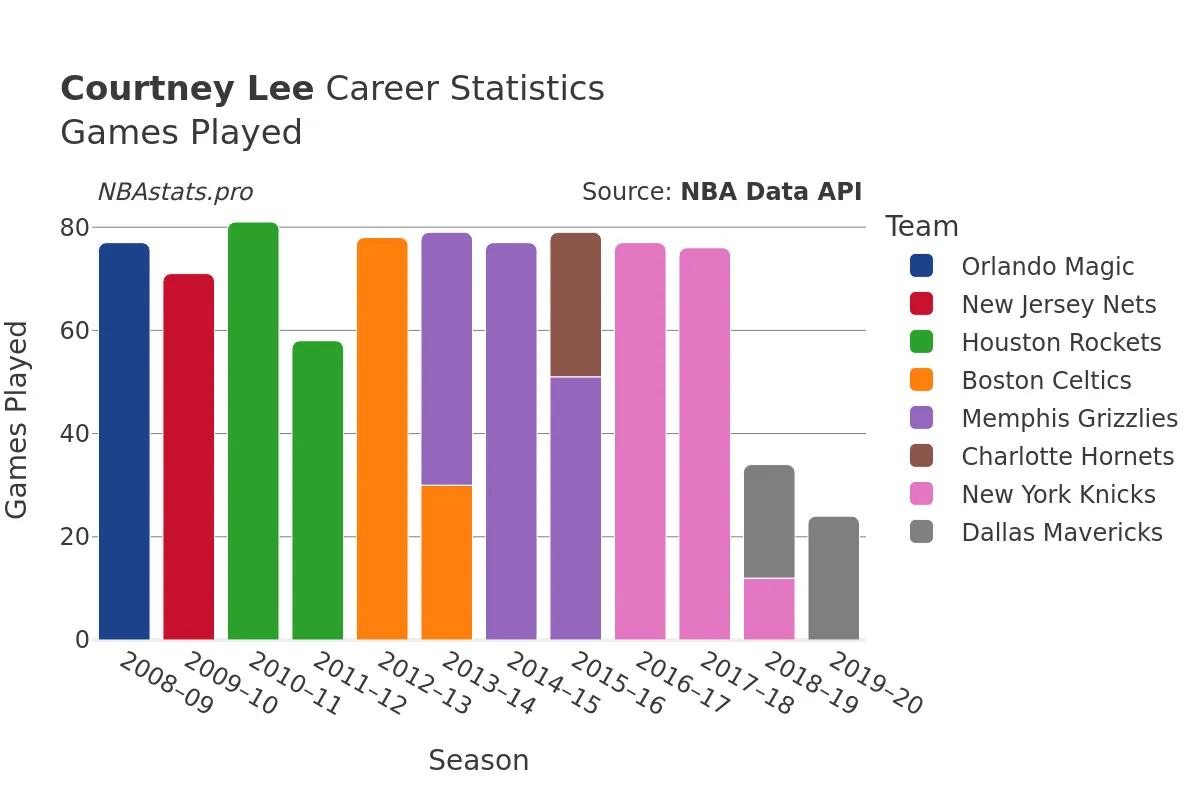
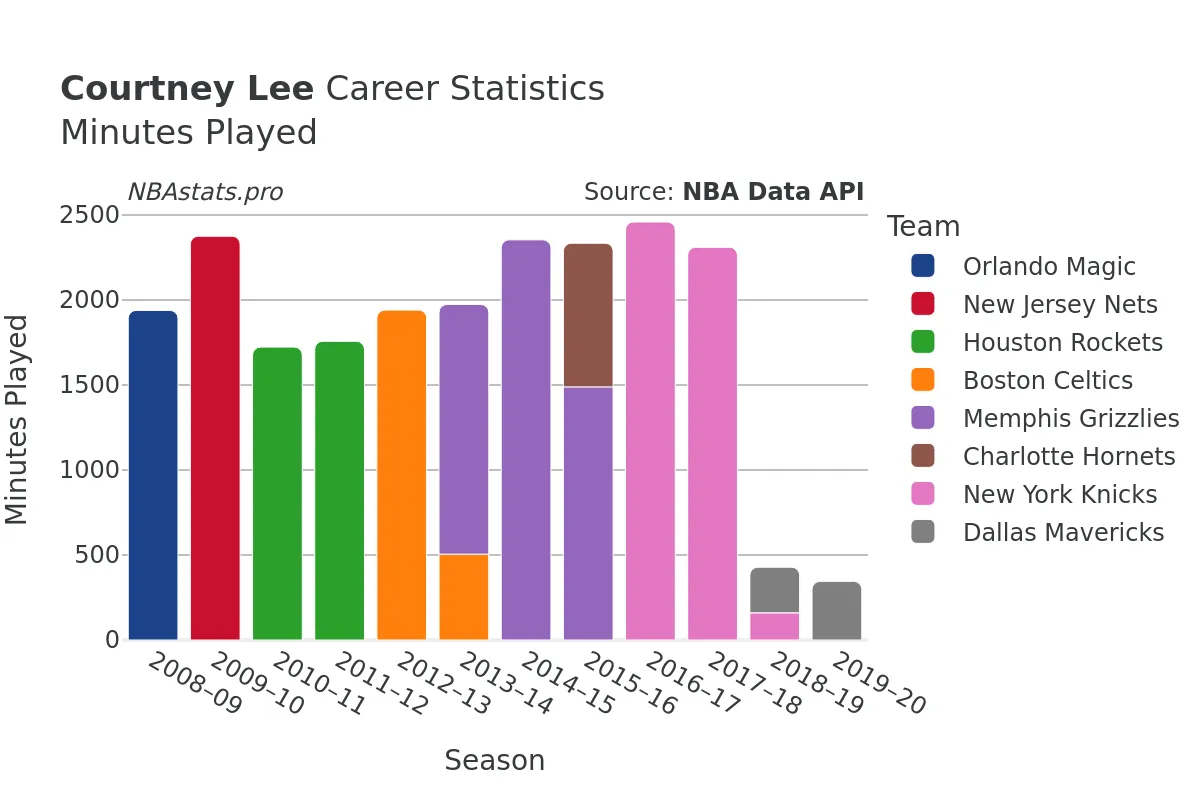
Lee, known for his sharpshooting abilities, played a total of 1003 games during his career, amassing an impressive ...26,674 minutes on the court. With 7,949 field goals attempted, he successfully made 3,599 of them, boasting a shooting percentage of 45.28%. Beyond his prowess on the court, Lee also showcased his talent from the free-throw line, making 1,179 out of 1,385 attempts, highlighting his consistency and reliability in high-pressure situations.
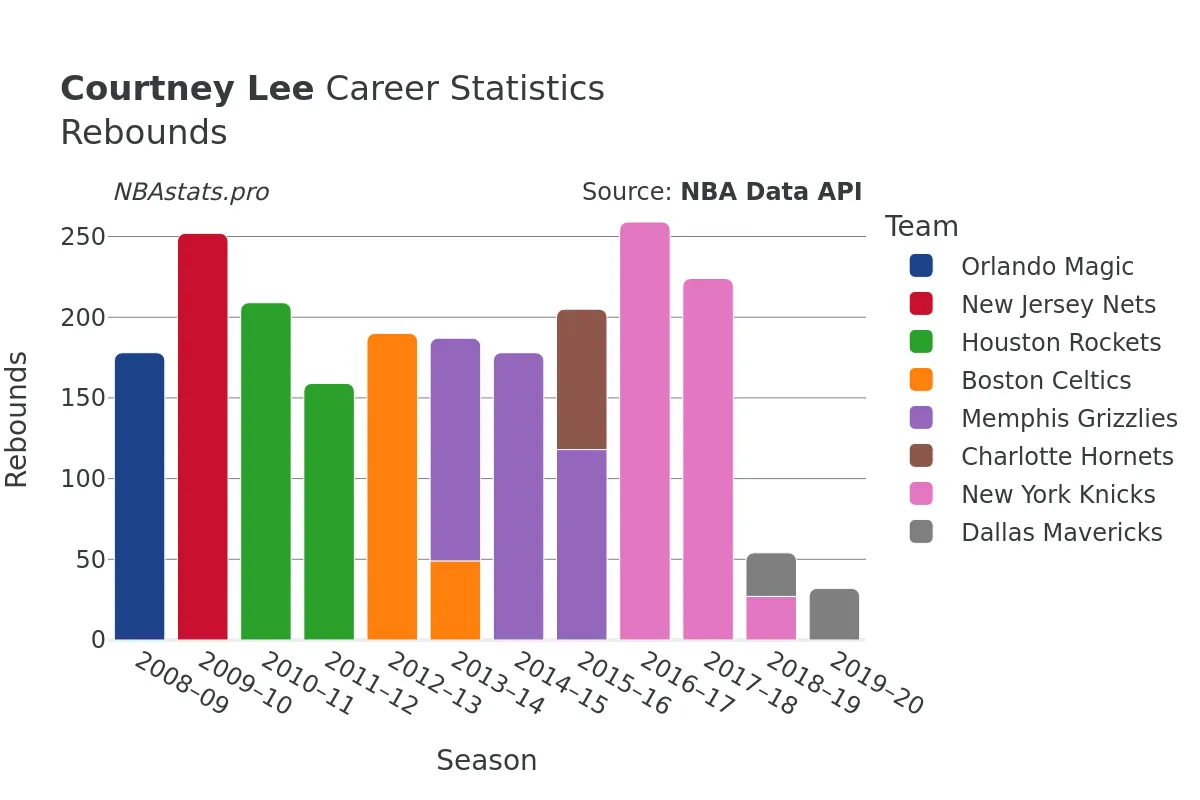
Rebounding is another aspect where Lee made a significant impact throughout his career, securing a total of 2,573 rebounds. Of these, 2,142 were defensive rebounds, showcasing his defensive prowess and ability to thwart opponents' scoring opportunities. Additionally, Lee displayed his versatility on the court by contributing 431 offensive rebounds, demonstrating his commitment to both ends of the floor.
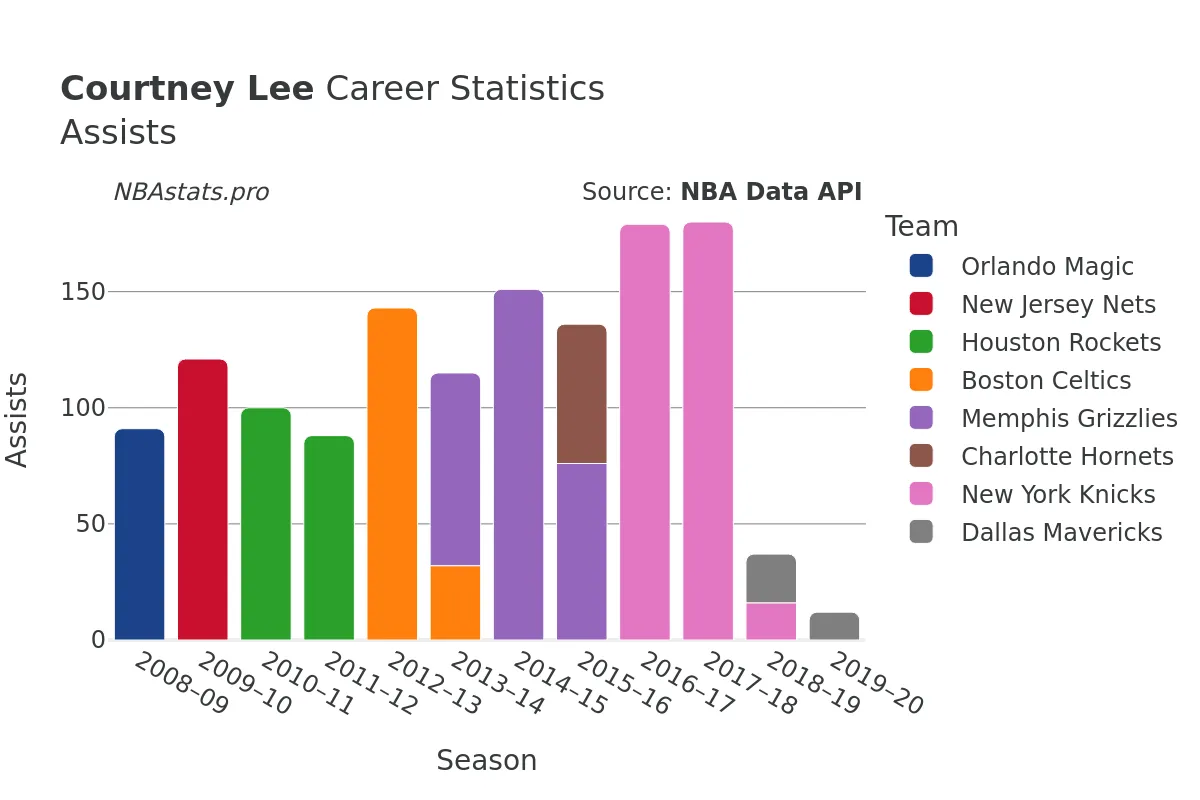
As a well-rounded player, Lee was not only a scorer but also a facilitator, dishing out 1,641 assists over his career. His court vision and passing ability contributed to his team's offensive efficiency, creating scoring opportunities for his teammates and elevating the overall performance of the squad.
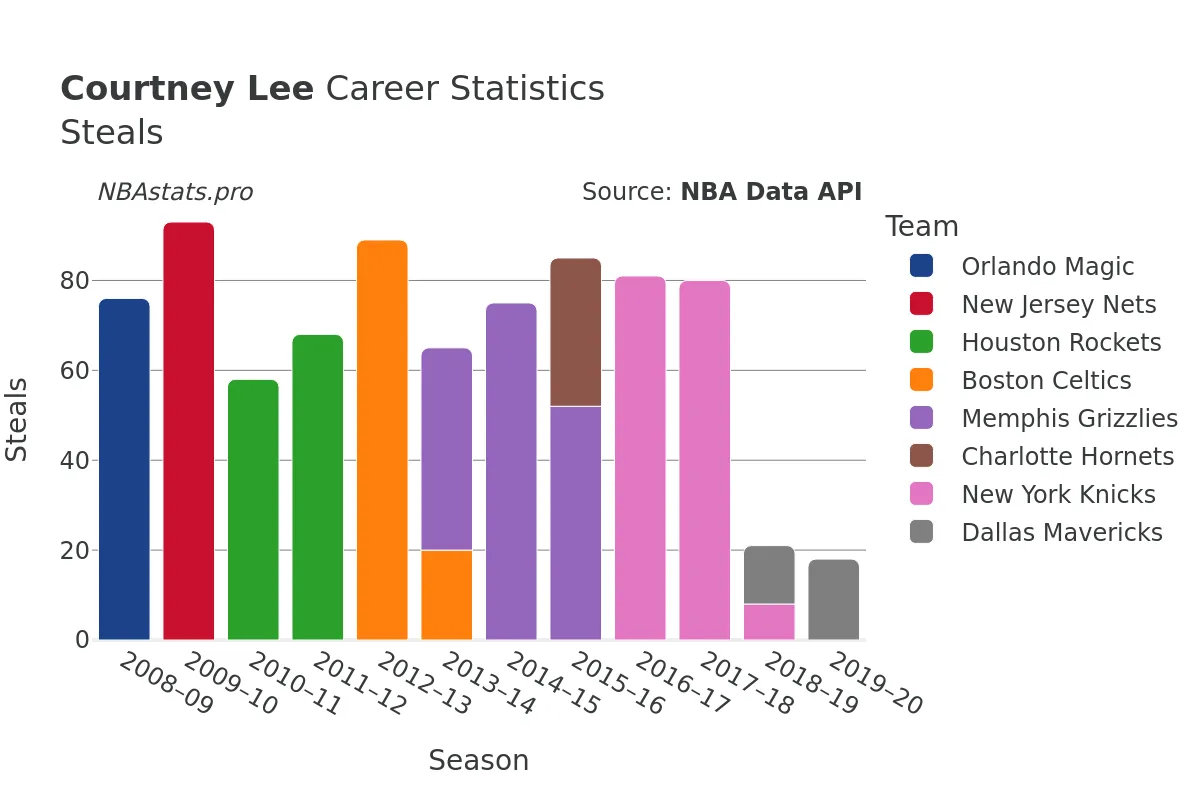
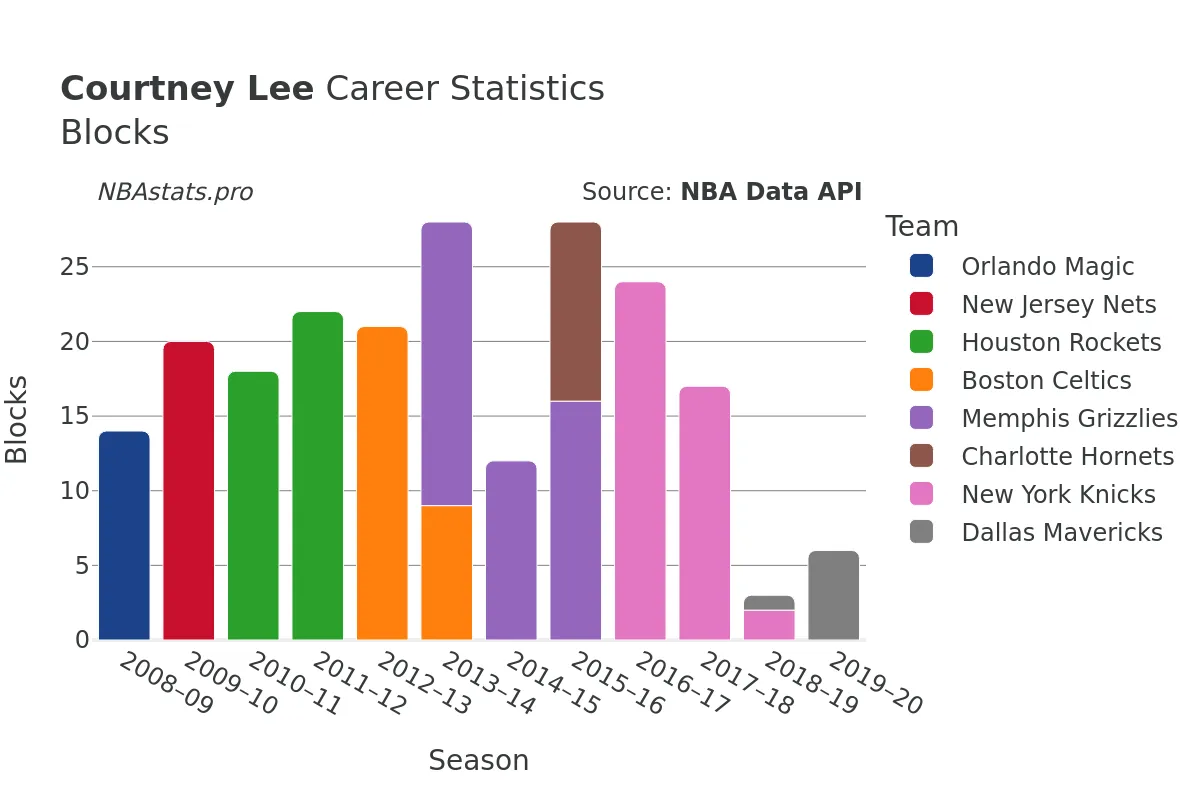
Defensively, Lee was a force to be reckoned with, tallying an impressive 980 steals and 272 blocks. His defensive acumen, coupled with his offensive skill set, made him a valuable asset on both ends of the floor, impacting the game in multiple facets.
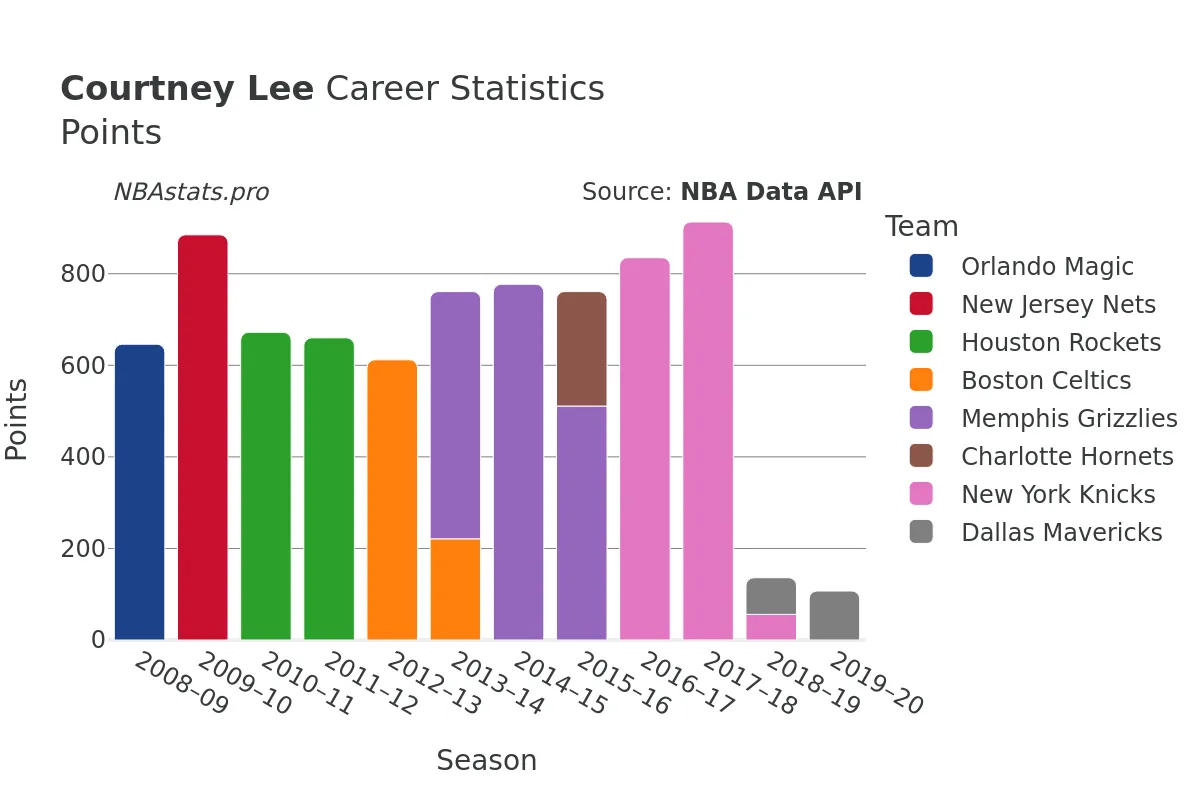
Lee's career point total stands at 9,423, underscoring his scoring proficiency and offensive output throughout his time in the league. Whether it was knocking down crucial shots or driving to the basket with finesse, Lee consistently found ways to put points on the board and contribute to his team's success.
Beyond the numbers and statistics, Lee's journey through various teams and cities reflects his adaptability and resilience as a professional athlete. From Orlando to Dallas, he embraced new challenges and opportunities, leaving an indelible mark on each organization he represented.
While Lee may have concluded his active playing career, his legacy as a skilled and dedicated NBA player lives on through his impressive stats and memorable performances on the court. So, take a closer look at the numbers, delve into the charts, and uncover the story of Courtney Lee, a player whose impact transcended statistics and resonated with fans and basketball enthusiasts alike.
Read more
Games Played
Points
Assists
Rebounds
Steals
Minutes Played
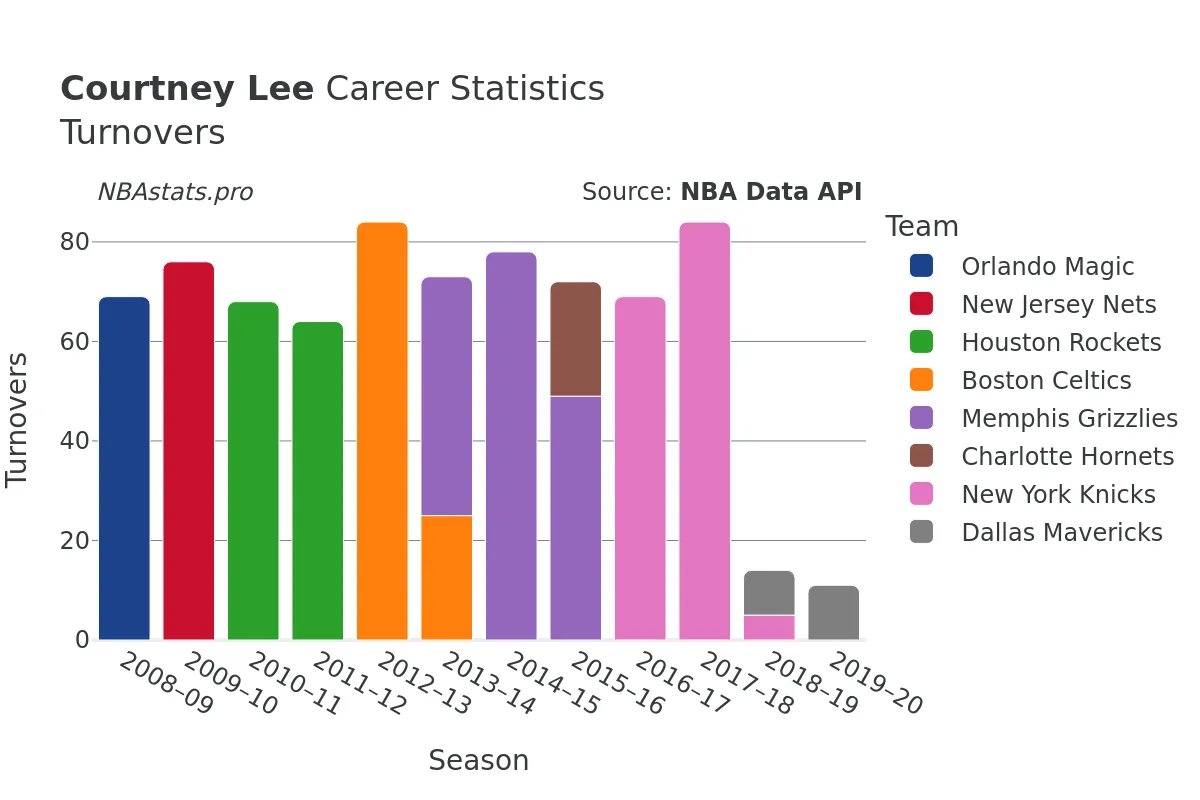
Turnovers
Blocks
Courtney Lee Career Stats Table
| SEASON | TEAM | AGE | GP | GS | MIN | FGM | FGA | FG % | FG3M | FG3A | FG3 % | FTM | FTA | FT % | OREB | DREB | REB | AST | STL | BLK | TOV | PF | PTS | |
|---|---|---|---|---|---|---|---|---|---|---|---|---|---|---|---|---|---|---|---|---|---|---|---|---|
| 1 | 2008-09 | ORL | 23 | 77 | 42 | 1,939 | 243 | 540 | 45.0% | 82 | 203 | 40.4% | 78 | 94 | 83.0% | 18 | 160 | 178 | 91 | 76 | 14 | 69 | 157 | 646 |
| 2 | 2009-10 | NJN | 24 | 71 | 66 | 2,375 | 338 | 775 | 43.6% | 76 | 225 | 33.8% | 133 | 153 | 86.9% | 60 | 192 | 252 | 121 | 93 | 20 | 76 | 130 | 885 |
| 3 | 2010-11 | HOU | 25 | 81 | 1 | 1,723 | 253 | 576 | 43.9% | 71 | 174 | 40.8% | 95 | 120 | 79.2% | 51 | 158 | 209 | 100 | 58 | 18 | 68 | 102 | 672 |
| 4 | 2011-12 | HOU | 26 | 58 | 26 | 1,757 | 251 | 580 | 43.3% | 87 | 217 | 40.1% | 71 | 86 | 82.6% | 26 | 133 | 159 | 88 | 68 | 22 | 64 | 106 | 660 |
| 5 | 2012-13 | BOS | 27 | 78 | 39 | 1,941 | 246 | 530 | 46.4% | 58 | 156 | 37.2% | 62 | 72 | 86.1% | 31 | 159 | 190 | 143 | 89 | 21 | 84 | 139 | 612 |
| 6 | 2013-14 | BOS | 28 | 30 | 0 | 505 | 90 | 183 | 49.2% | 23 | 52 | 44.2% | 18 | 22 | 81.8% | 8 | 41 | 49 | 32 | 20 | 9 | 25 | 37 | 221 |
| 7 | 2013-14 | MEM | 28 | 49 | 47 | 1,469 | 205 | 431 | 47.6% | 49 | 142 | 34.5% | 81 | 90 | 90.0% | 21 | 117 | 138 | 83 | 45 | 19 | 48 | 90 | 540 |
| 8 | 2013-14 | TOT | 28 | 79 | 47 | 1,973 | 295 | 614 | 48.0% | 72 | 194 | 37.1% | 99 | 112 | 88.4% | 29 | 158 | 187 | 115 | 65 | 28 | 73 | 127 | 761 |
| 9 | 2014-15 | MEM | 29 | 77 | 74 | 2,354 | 288 | 643 | 44.8% | 90 | 224 | 40.2% | 111 | 129 | 86.0% | 21 | 157 | 178 | 151 | 75 | 12 | 78 | 129 | 777 |
| 10 | 2015-16 | MEM | 30 | 51 | 37 | 1,489 | 192 | 419 | 45.8% | 51 | 138 | 37.0% | 76 | 92 | 82.6% | 19 | 99 | 118 | 76 | 52 | 16 | 49 | 79 | 511 |
| 11 | 2015-16 | CHA | 30 | 28 | 28 | 845 | 98 | 220 | 44.5% | 31 | 79 | 39.2% | 23 | 26 | 88.5% | 10 | 77 | 87 | 60 | 33 | 12 | 23 | 55 | 250 |
| 12 | 2015-16 | TOT | 30 | 79 | 65 | 2,334 | 290 | 639 | 45.4% | 82 | 217 | 37.8% | 99 | 118 | 83.9% | 29 | 176 | 205 | 136 | 85 | 28 | 72 | 134 | 761 |
| 13 | 2016-17 | NYK | 31 | 77 | 74 | 2,459 | 321 | 704 | 45.6% | 108 | 269 | 40.1% | 85 | 98 | 86.7% | 53 | 206 | 259 | 179 | 81 | 24 | 69 | 141 | 835 |
| 14 | 2017-18 | NYK | 32 | 76 | 69 | 2,310 | 343 | 755 | 45.4% | 113 | 278 | 40.6% | 114 | 124 | 91.9% | 30 | 194 | 224 | 180 | 80 | 17 | 84 | 109 | 913 |
| 15 | 2018-19 | NYK | 33 | 12 | 2 | 160 | 21 | 47 | 44.7% | 5 | 16 | 31.3% | 9 | 14 | 64.3% | 6 | 21 | 27 | 16 | 8 | 2 | 5 | 13 | 56 |
| 16 | 2018-19 | DAL | 33 | 22 | 4 | 268 | 32 | 82 | 39.0% | 11 | 39 | 28.2% | 5 | 7 | 71.4% | 3 | 24 | 27 | 21 | 13 | 1 | 9 | 19 | 80 |
| 17 | 2018-19 | TOT | 33 | 34 | 6 | 428 | 53 | 129 | 41.1% | 16 | 55 | 29.1% | 14 | 21 | 66.7% | 9 | 45 | 54 | 37 | 21 | 3 | 14 | 32 | 136 |
| 18 | 2019-20 | DAL | 34 | 24 | 9 | 345 | 40 | 82 | 48.8% | 21 | 47 | 44.7% | 6 | 7 | 85.7% | 7 | 25 | 32 | 12 | 18 | 6 | 11 | 33 | 107 |
Max Min
NBA Alltime Leaders
Games Played
Robert Parish: 1,611Kareem Abdul-Jabbar: 1,560
Vince Carter: 1,541
Dirk Nowitzki: 1,522
John Stockton: 1,504
Points
LeBron James: 40,474Kareem Abdul-Jabbar: 38,387
Karl Malone: 36,928
Kobe Bryant: 33,643
Michael Jordan: 32,292
Steals
John Stockton: 3,265Jason Kidd: 2,684
Chris Paul: 2,614
Michael Jordan: 2,514
Gary Payton: 2,445
Free Throws Made
Karl Malone: 9,787Moses Malone: 8,531
LeBron James: 8,390
Kobe Bryant: 8,378
Oscar Robertson: 7,694