Chris Wilcox Stats: NBA Career

Welcome to the profile page of NBA basketball player Chris Wilcox!
Over his impressive 11-season career in the league, Wilcox, a versatile power forward, showcased his skills and athleticism while playing for multiple teams across various cities and states. He began his NBA journey in the 2002-03 season and concluded his playing career in the 2012-13 season. Let's dive into the stats to better understand the impact and contributions of this talented player on the court.
Wilcox made his mark o...n the NBA scene by donning the jerseys of some notable teams throughout his career. He started his journey with the Los Angeles Clippers before moving on to play for the Oklahoma City Thunder, New York Knicks, Detroit Pistons, and finally, the Boston Celtics. Each stop in his career allowed him to grow as a player and make significant contributions to his teams.
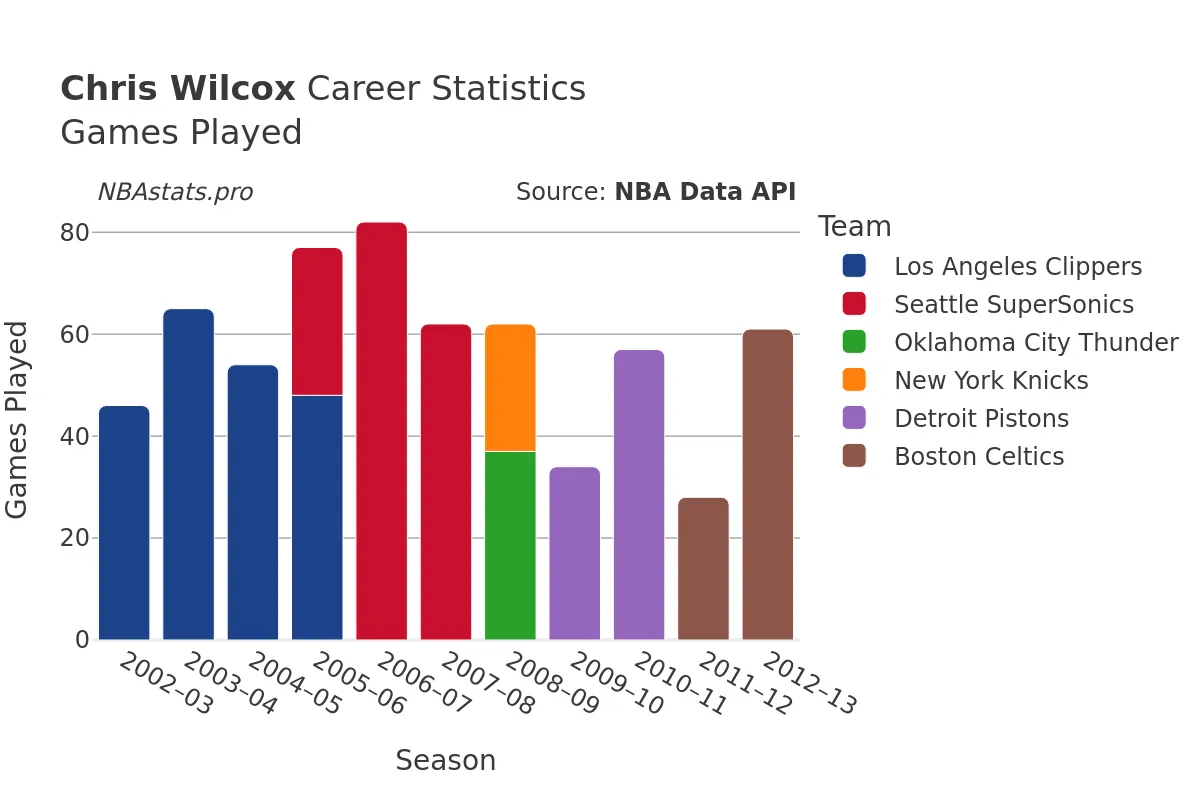
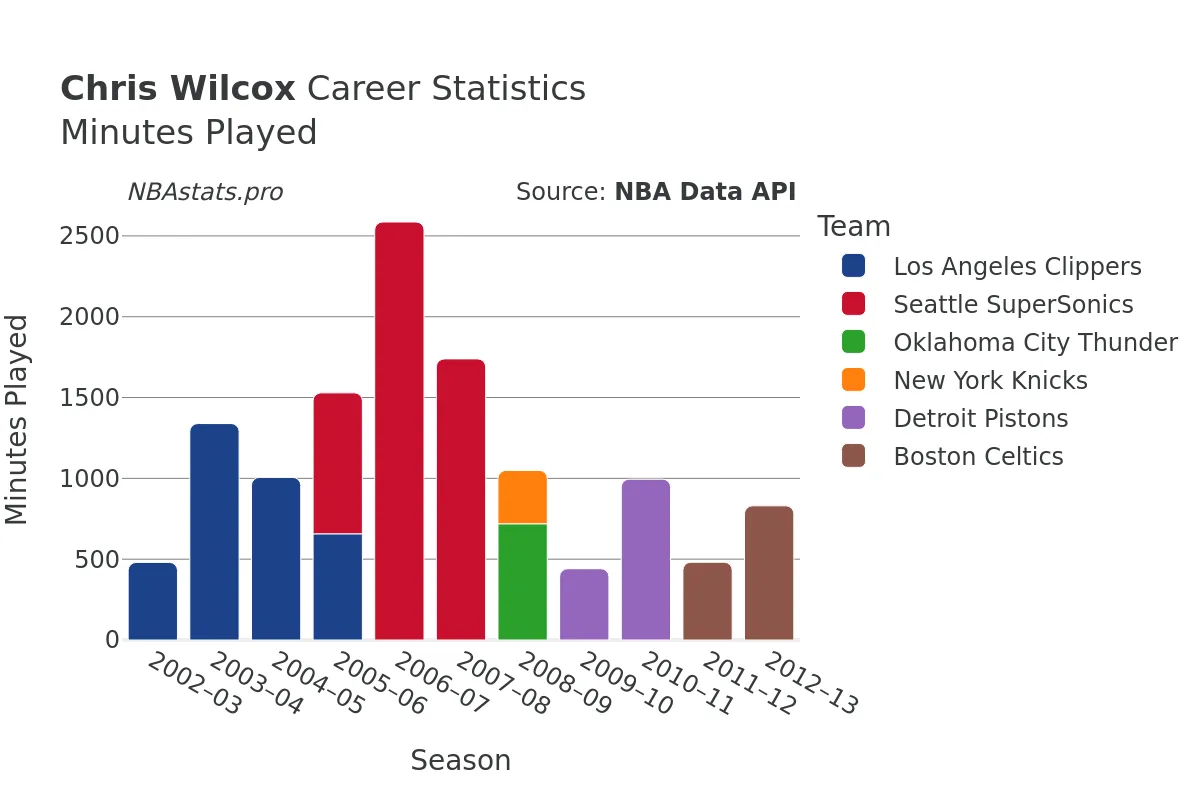
One of the most telling indicators of a player's impact on the game is their playing time. Over the course of 767 games played, Wilcox accumulated an impressive 15,055 minutes on the court. This amount of playing time speaks to his durability and importance to his teams as a reliable contributor.
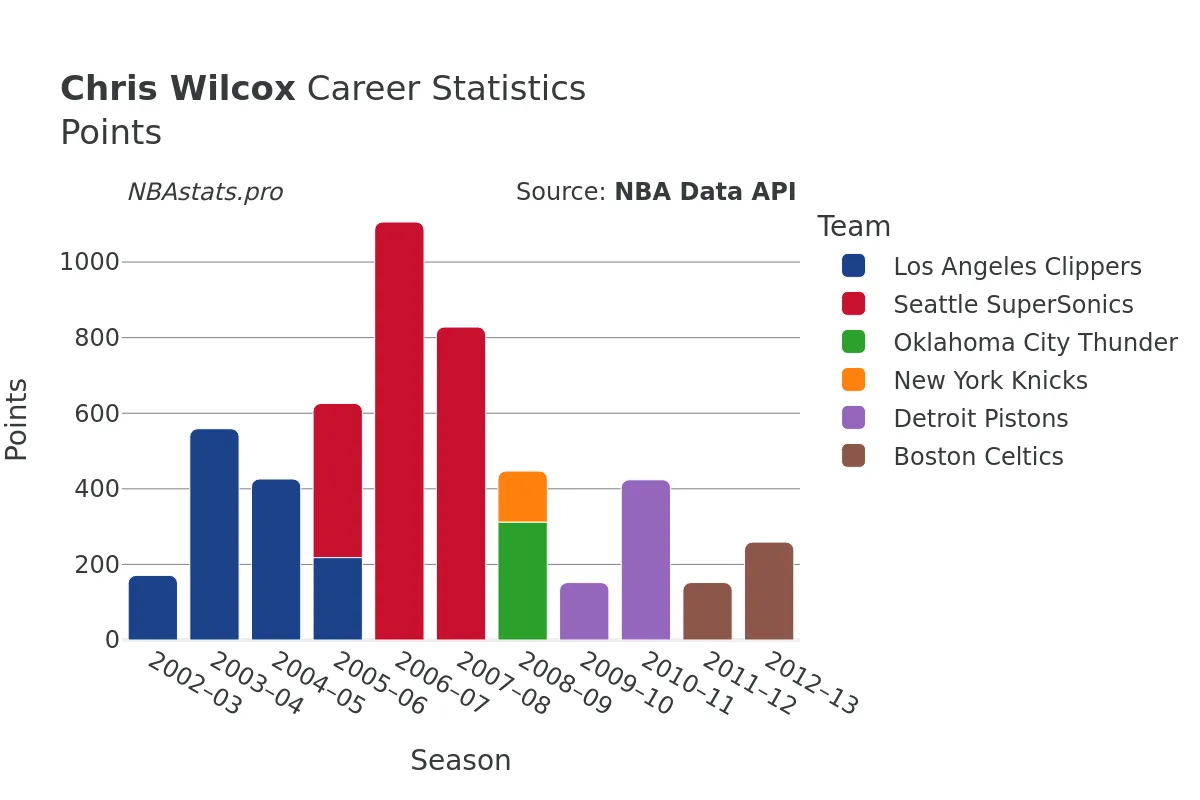
When it came to scoring, Wilcox was a force to be reckoned with. He attempted 4,704 field goals throughout his career and successfully made 2,542 of them, boasting an impressive field goal percentage of over 54%. His ability to efficiently convert his shot attempts into points undoubtedly made him a valuable asset to his teams on the offensive end.
Furthermore, Wilcox demonstrated his prowess at the free-throw line, attempting 1,767 free throws and making 1,139 of them. His success rate at the charity stripe further highlights his scoring acumen and ability to capitalize on scoring opportunities.
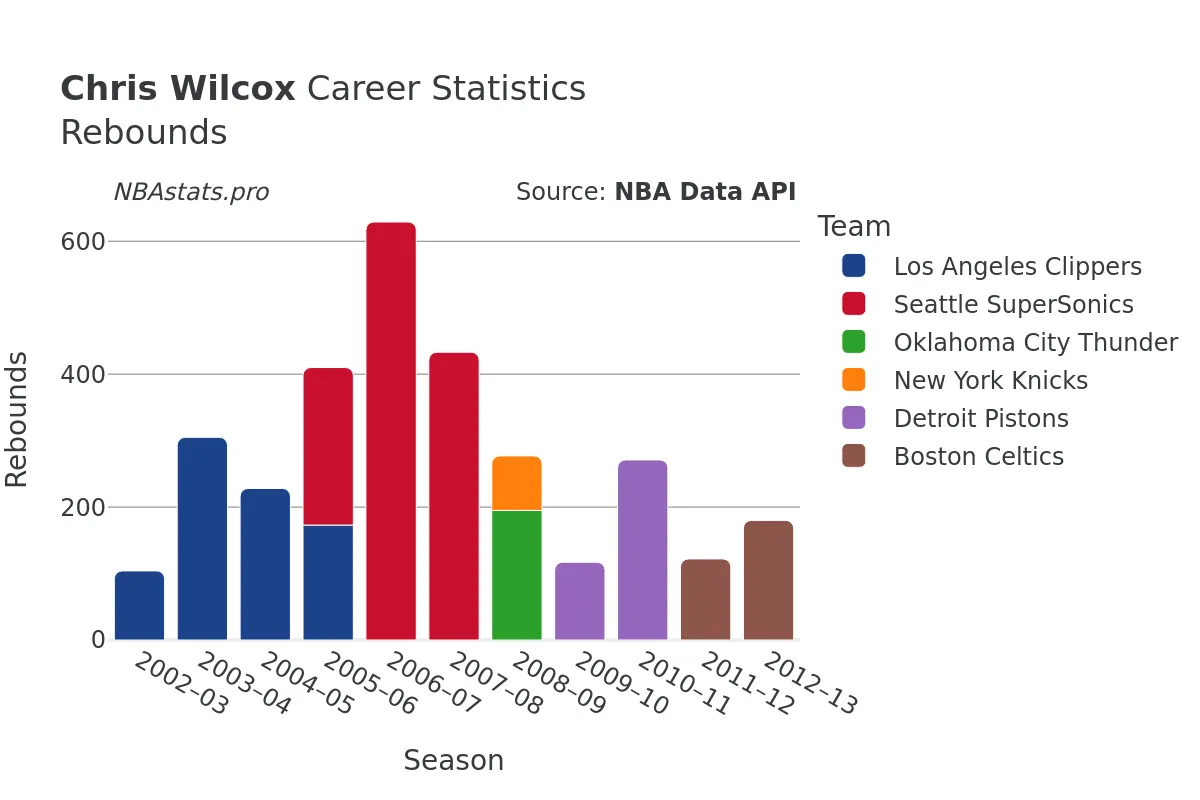
Rebounding is another area where Wilcox excelled. Throughout his career, he amassed a total of 3,763 rebounds, showcasing his prowess on the boards. Of those rebounds, 1,184 were offensive rebounds, demonstrating his tenacity and ability to secure crucial possessions for his team.
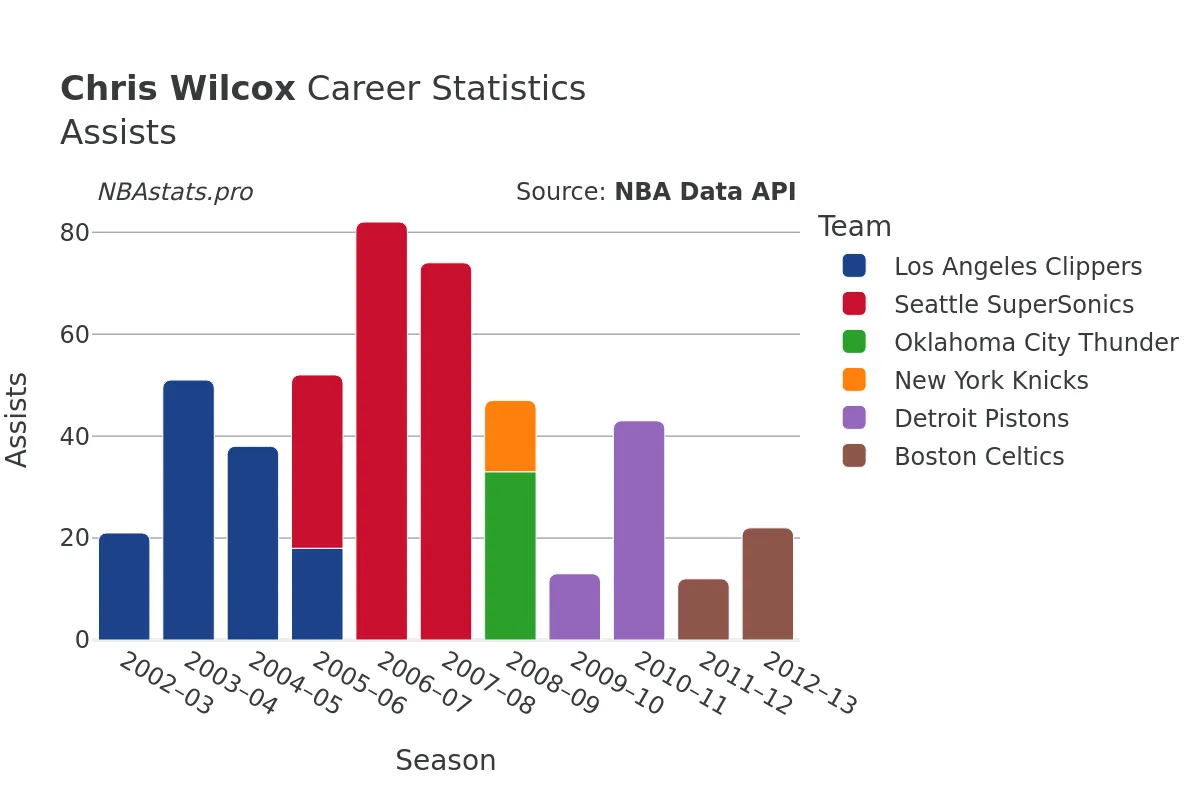
In addition to his scoring and rebounding abilities, Wilcox was also a capable playmaker on the court. He dished out 554 assists over his career, showcasing his ability to facilitate ball movement and create scoring opportunities for his teammates.
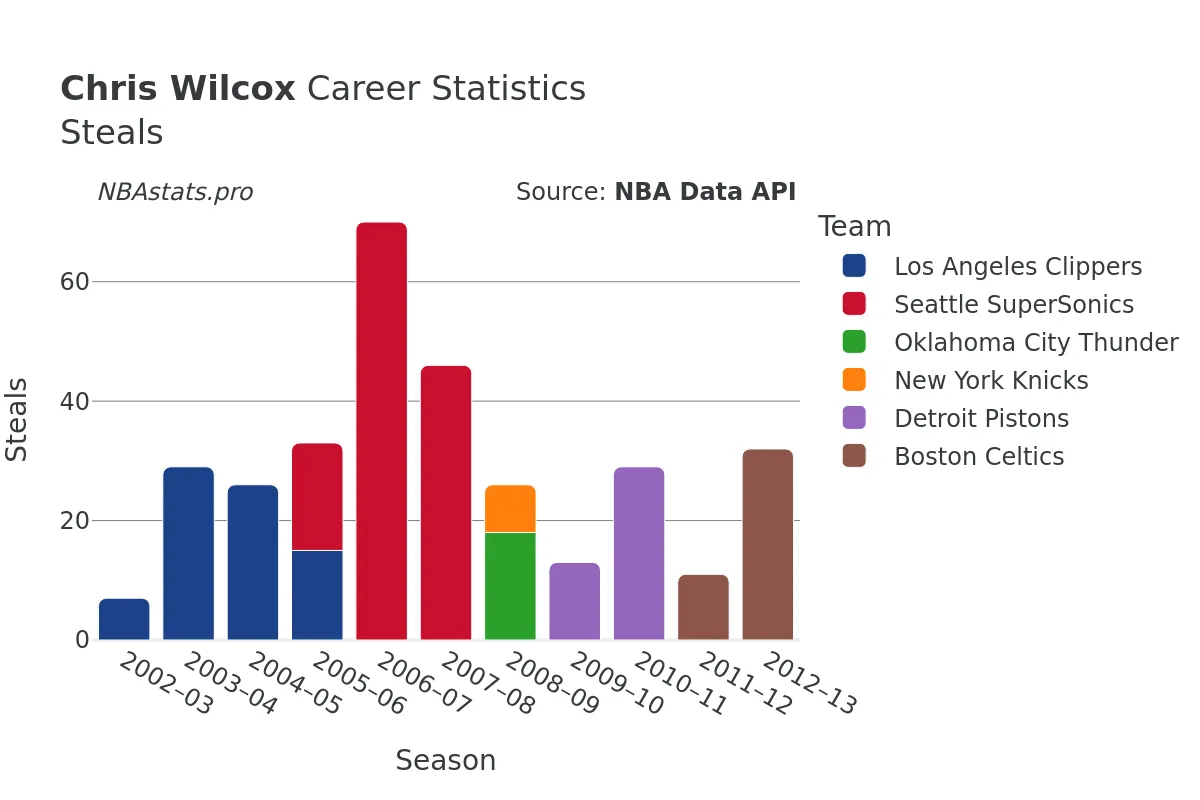
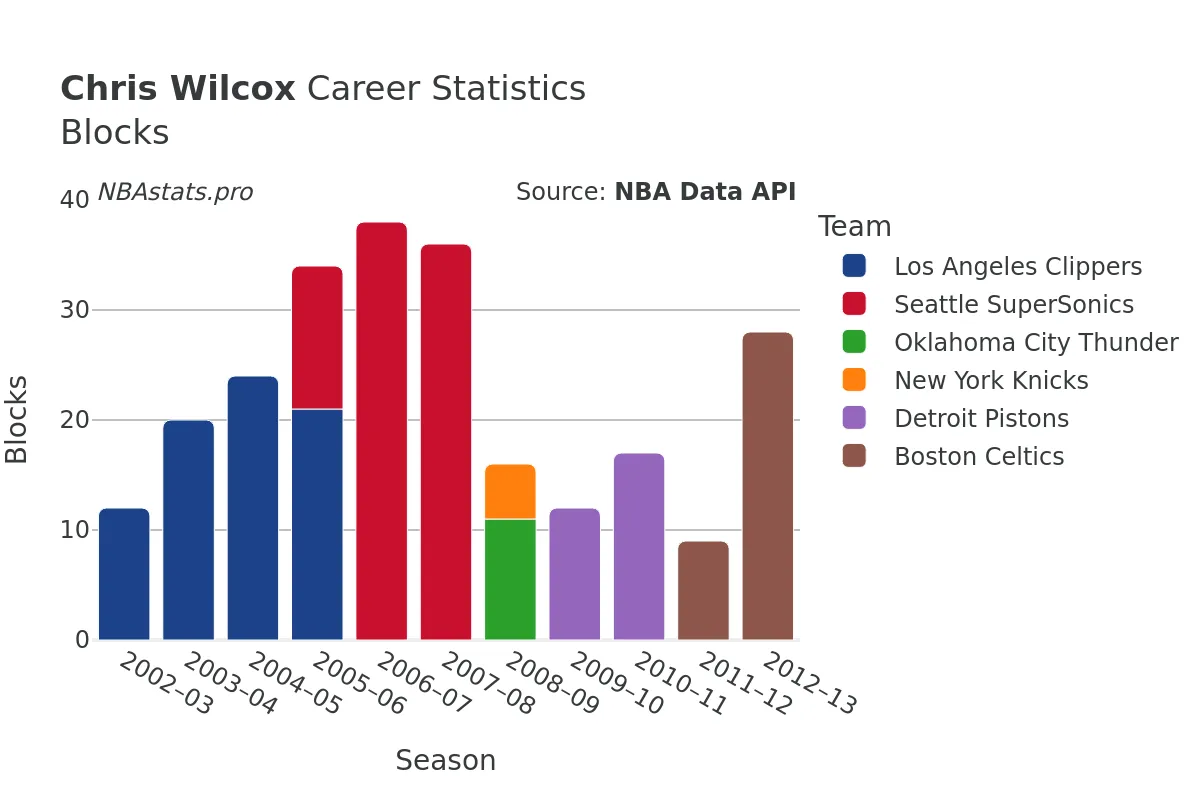
Defensively, Wilcox made his presence felt with 381 steals and 296 blocks, showcasing his ability to disrupt opponents and protect the rim. His defensive contributions were instrumental in helping his teams secure stops and turn defense into offense.
Overall, Chris Wilcox's career statistics paint a picture of a dynamic and impactful player who left his mark on the NBA with his scoring, rebounding, playmaking, and defensive prowess. As you explore the charts and data on this page, you'll gain a deeper insight into the career of this skilled basketball player and appreciate the contributions he made to the teams he represented.
Read more
Games Played
Points
Assists
Rebounds
Steals
Minutes Played
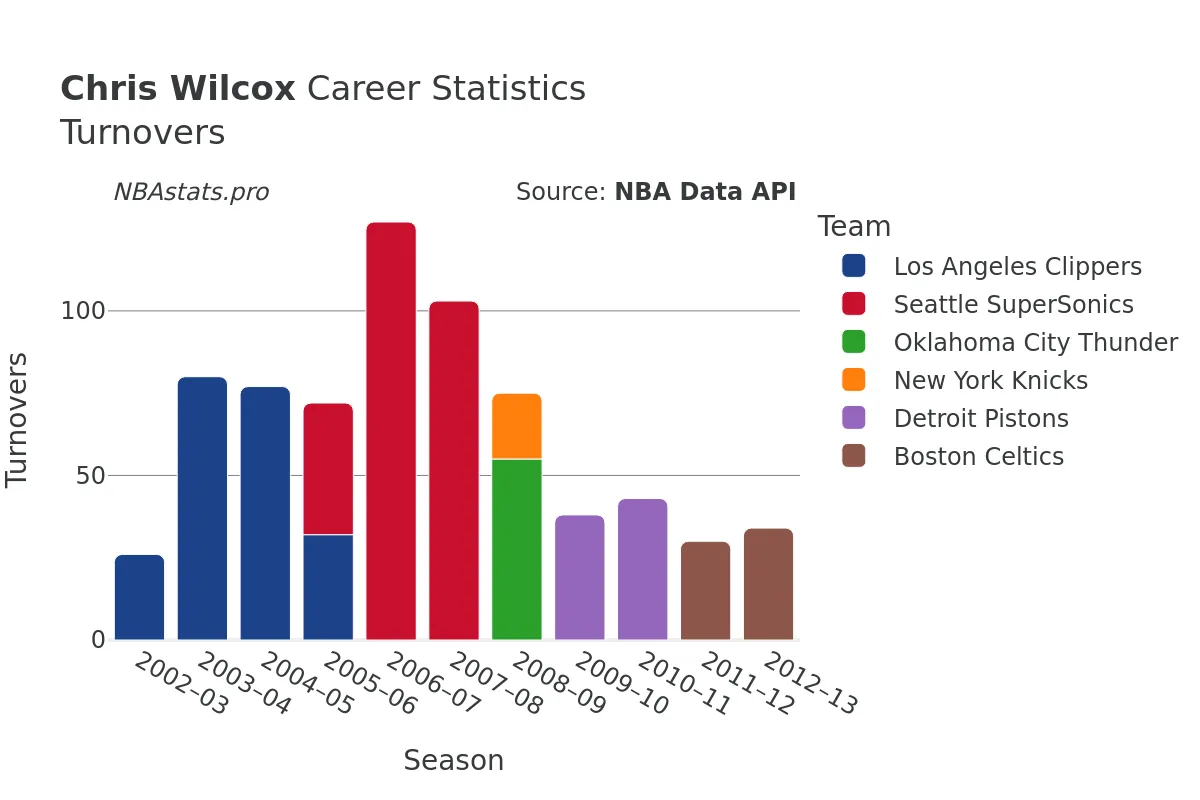
Turnovers
Blocks
Chris Wilcox Career Stats Table
| SEASON | TEAM | AGE | GP | GS | MIN | FGM | FGA | FG % | FG3M | FG3A | FG3 % | FTM | FTA | FT % | OREB | DREB | REB | AST | STL | BLK | TOV | PF | PTS | |
|---|---|---|---|---|---|---|---|---|---|---|---|---|---|---|---|---|---|---|---|---|---|---|---|---|
| 1 | 2002-03 | LAC | 20 | 46 | 3 | 480 | 73 | 140 | 52.1% | 0 | 0 | 0.0% | 25 | 50 | 50.0% | 32 | 72 | 104 | 21 | 7 | 12 | 26 | 65 | 171 |
| 2 | 2003-04 | LAC | 21 | 65 | 17 | 1,339 | 227 | 436 | 52.1% | 0 | 1 | 0.0% | 105 | 150 | 70.0% | 125 | 180 | 305 | 51 | 29 | 20 | 80 | 183 | 559 |
| 3 | 2004-05 | LAC | 22 | 54 | 25 | 1,006 | 169 | 329 | 51.4% | 0 | 0 | 0.0% | 88 | 144 | 61.1% | 63 | 165 | 228 | 38 | 26 | 24 | 77 | 129 | 426 |
| 4 | 2005-06 | LAC | 23 | 48 | 1 | 657 | 90 | 168 | 53.6% | 0 | 2 | 0.0% | 38 | 59 | 64.4% | 46 | 127 | 173 | 18 | 15 | 21 | 32 | 103 | 218 |
| 5 | 2005-06 | SEA | 23 | 29 | 23 | 872 | 167 | 282 | 59.2% | 0 | 0 | 0.0% | 74 | 94 | 78.7% | 72 | 165 | 237 | 34 | 18 | 13 | 40 | 80 | 408 |
| 6 | 2005-06 | TOT | 23 | 77 | 24 | 1,530 | 257 | 450 | 57.1% | 0 | 2 | 0.0% | 112 | 153 | 73.2% | 118 | 292 | 410 | 52 | 33 | 34 | 72 | 183 | 626 |
| 7 | 2006-07 | SEA | 24 | 82 | 81 | 2,586 | 433 | 819 | 52.9% | 0 | 6 | 0.0% | 240 | 351 | 68.4% | 178 | 451 | 629 | 82 | 70 | 38 | 127 | 248 | 1,106 |
| 8 | 2007-08 | SEA | 25 | 62 | 55 | 1,739 | 334 | 638 | 52.4% | 0 | 3 | 0.0% | 160 | 248 | 64.5% | 126 | 307 | 433 | 74 | 46 | 36 | 103 | 174 | 828 |
| 9 | 2008-09 | OKC | 26 | 37 | 6 | 719 | 130 | 268 | 48.5% | 0 | 3 | 0.0% | 52 | 87 | 59.8% | 65 | 130 | 195 | 33 | 18 | 11 | 55 | 89 | 312 |
| 10 | 2008-09 | NYK | 26 | 25 | 0 | 330 | 54 | 102 | 52.9% | 0 | 1 | 0.0% | 27 | 53 | 50.9% | 31 | 51 | 82 | 14 | 8 | 5 | 20 | 48 | 135 |
| 11 | 2008-09 | TOT | 26 | 62 | 6 | 1,050 | 184 | 370 | 49.7% | 0 | 4 | 0.0% | 79 | 140 | 56.4% | 96 | 181 | 277 | 47 | 26 | 16 | 75 | 137 | 447 |
| 12 | 2009-10 | DET | 27 | 34 | 10 | 441 | 63 | 120 | 52.5% | 0 | 0 | 0.0% | 26 | 52 | 50.0% | 44 | 73 | 117 | 13 | 13 | 12 | 38 | 64 | 152 |
| 13 | 2010-11 | DET | 28 | 57 | 29 | 995 | 187 | 322 | 58.1% | 0 | 1 | 0.0% | 50 | 89 | 56.2% | 95 | 176 | 271 | 43 | 29 | 17 | 43 | 145 | 424 |
| 14 | 2011-12 | BOS | 29 | 28 | 4 | 481 | 64 | 107 | 59.8% | 0 | 0 | 0.0% | 24 | 39 | 61.5% | 38 | 84 | 122 | 12 | 11 | 9 | 30 | 64 | 152 |
| 15 | 2012-13 | BOS | 30 | 61 | 7 | 830 | 110 | 153 | 71.9% | 0 | 1 | 0.0% | 39 | 58 | 67.2% | 55 | 125 | 180 | 22 | 32 | 28 | 34 | 125 | 259 |
Max Min
NBA Alltime Leaders
Games Played
Robert Parish: 1,611Kareem Abdul-Jabbar: 1,560
Vince Carter: 1,541
Dirk Nowitzki: 1,522
John Stockton: 1,504
Points
LeBron James: 40,474Kareem Abdul-Jabbar: 38,387
Karl Malone: 36,928
Kobe Bryant: 33,643
Michael Jordan: 32,292
Steals
John Stockton: 3,265Jason Kidd: 2,684
Chris Paul: 2,614
Michael Jordan: 2,514
Gary Payton: 2,445
Free Throws Made
Karl Malone: 9,787Moses Malone: 8,531
LeBron James: 8,390
Kobe Bryant: 8,378
Oscar Robertson: 7,694