Chris Mullin Stats: NBA Career

Step right up, NBA fans! Today, we delve into the illustrious career of the one and only Chris Mullin. Hailing from the sunny states of California and Indiana, Mullin graced the hardwood for the Golden State Warriors and the Indiana Pacers during a memorable stint in the professional basketball league.
Mullin, a sharpshooting small forward, made a lasting impact on the game with his smooth strokes and versatile playing style. Although he may have hung up his jersey after the 2000-01 season, his... legacy continues to resonate through the annals of NBA history.
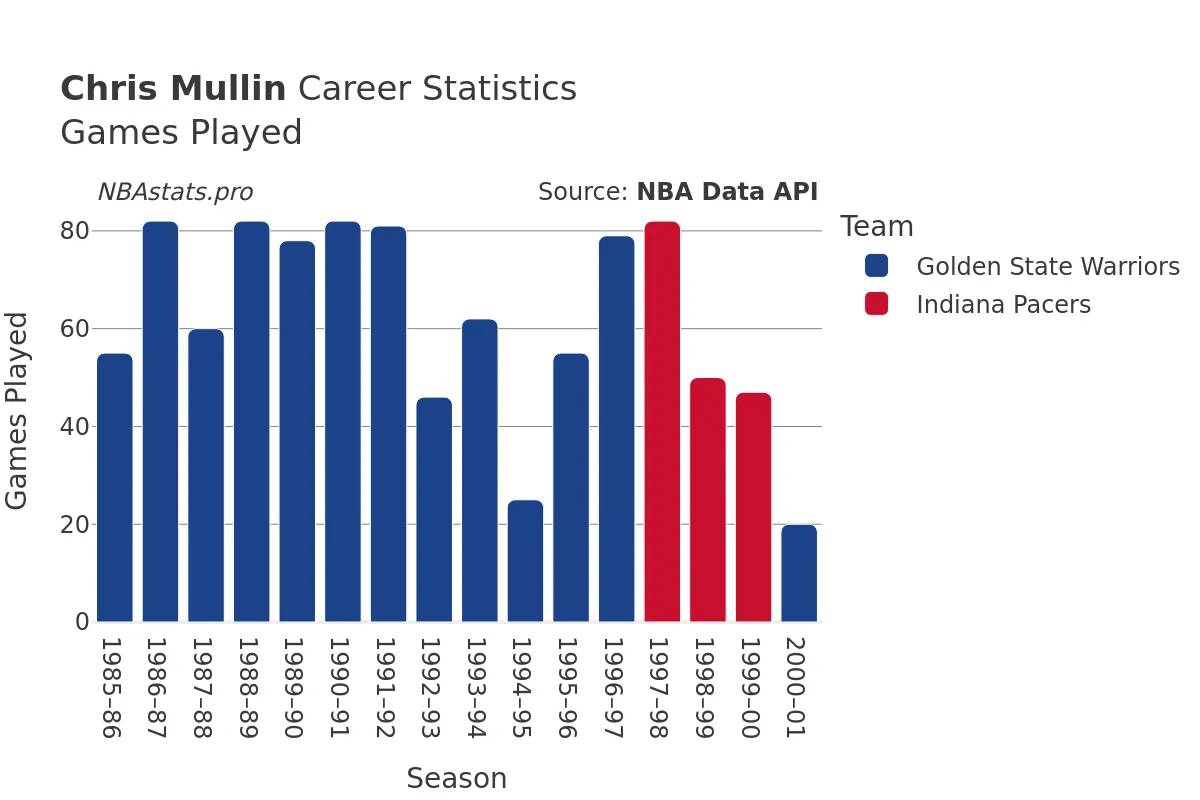
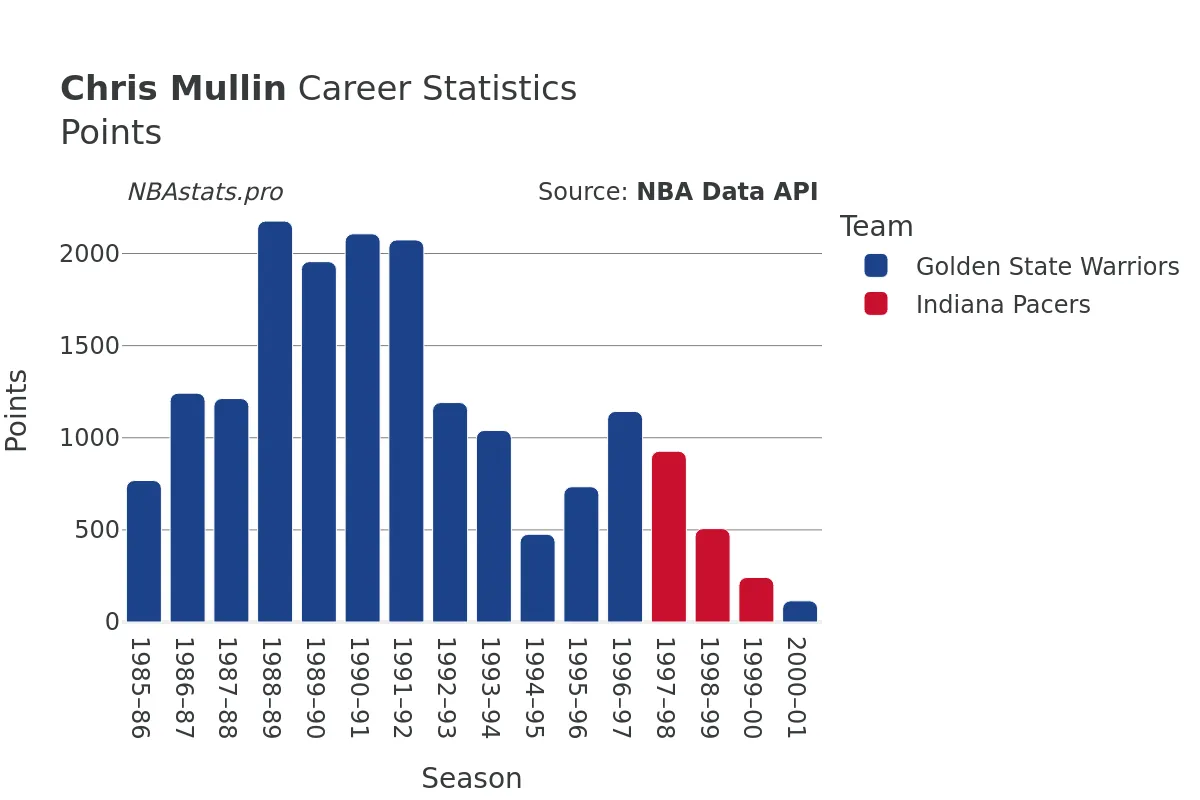
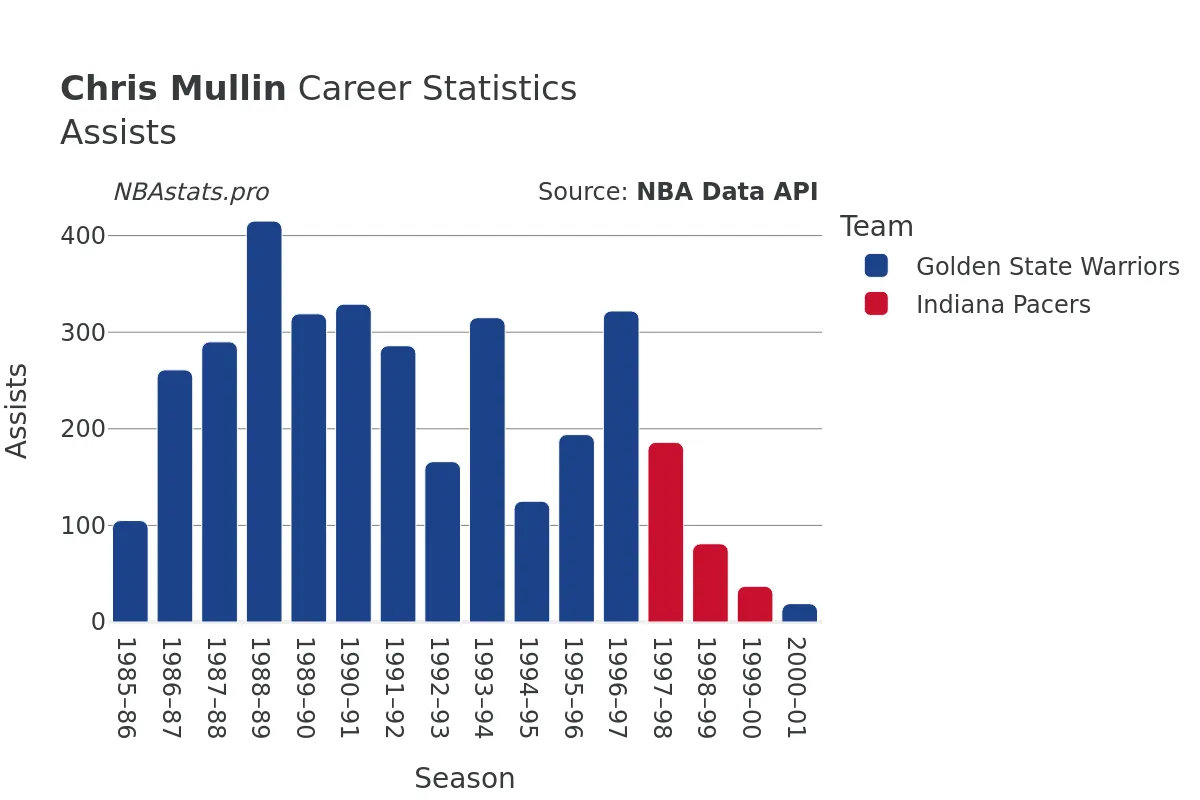
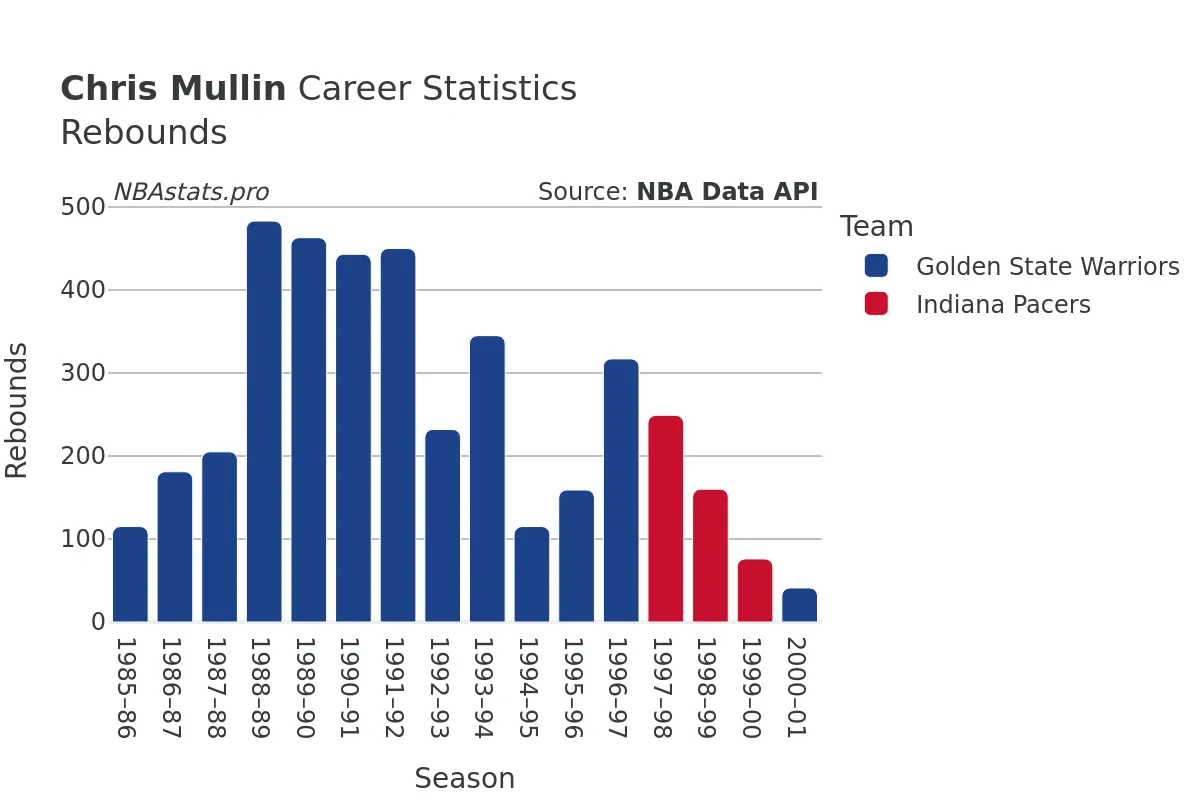
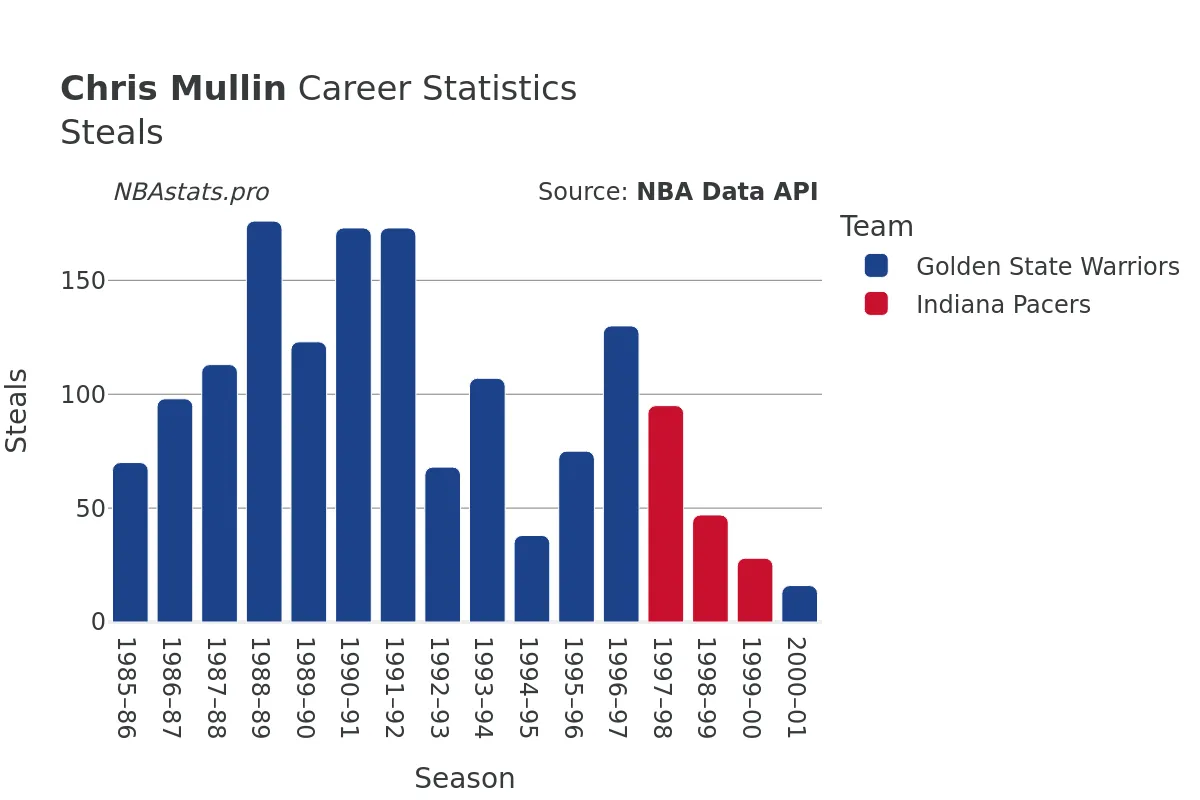
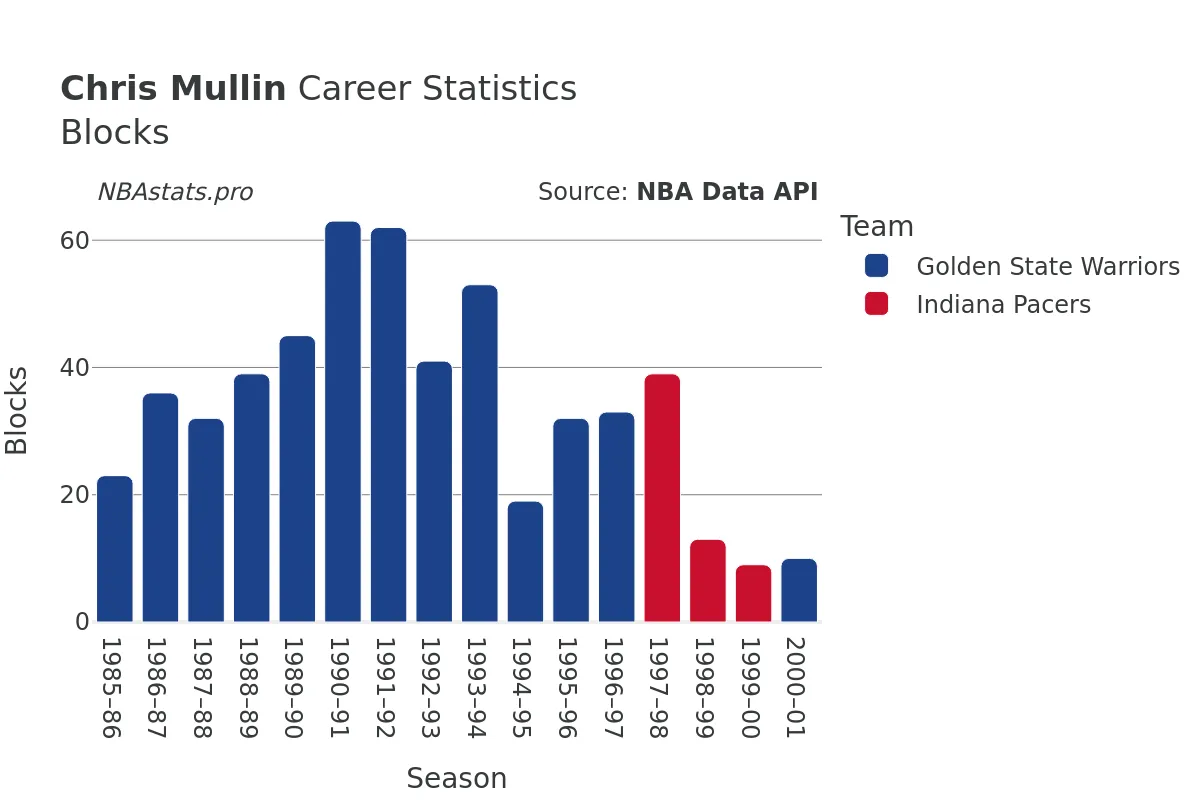
Let's break down the numbers that define the career of this basketball prodigy. Over the course of 986 games played, Mullin showcased his skills on the court, amassing an impressive tally of 17,911 points. But scoring was just one facet of his game. Mullin proved to be a well-rounded player, contributing 4,034 rebounds, 3,450 assists, 1,530 steals, and 549 blocks throughout his career.
Efficiency was key for Mullin, as evidenced by his field goal percentage of 50.89%. With a deft shooting touch, he attempted 13,243 shots and successfully made 6,740 of them. His ability to knock down shots from all over the court made him a nightmare for opposing defenses.
Mullin's impact wasn't limited to scoring. He also excelled in the art of free throws, converting an impressive 86.56% of his attempts from the charity stripe. A reliable presence in clutch situations, Mullin's proficiency from the free-throw line often sealed the deal for his team.
Rebounding was another area where Mullin made his mark. With 3,034 defensive rebounds and 1,026 offensive rebounds, he displayed a tenacity on the boards that set him apart from his peers. His ability to crash the glass and secure possessions for his team was a testament to his basketball IQ and work ethic.
Defensively, Mullin was no slouch either. His 1,530 steals and 549 blocks underscore his commitment to making life difficult for opponents. Whether it was disrupting passing lanes or swatting away shots, Mullin's defensive prowess was a valuable asset for his teams.
Mullin's journey in the NBA spanned from the 1985-86 season to the 2000-01 season, during which he showcased his skills and left an indelible mark on the league. While his playing days may be behind him, his impact on the game continues to inspire basketball enthusiasts worldwide.
So, dear fans, as you delve into the charts and statistics that encapsulate the career of Chris Mullin, prepare to be awed by the sheer brilliance and artistry of this basketball virtuoso. From his scoring exploits to his all-around contributions on the court, Mullin's legacy stands as a testament to the power of passion, skill, and dedication in the game of basketball.
Read more
Games Played
Points
Assists
Rebounds
Steals
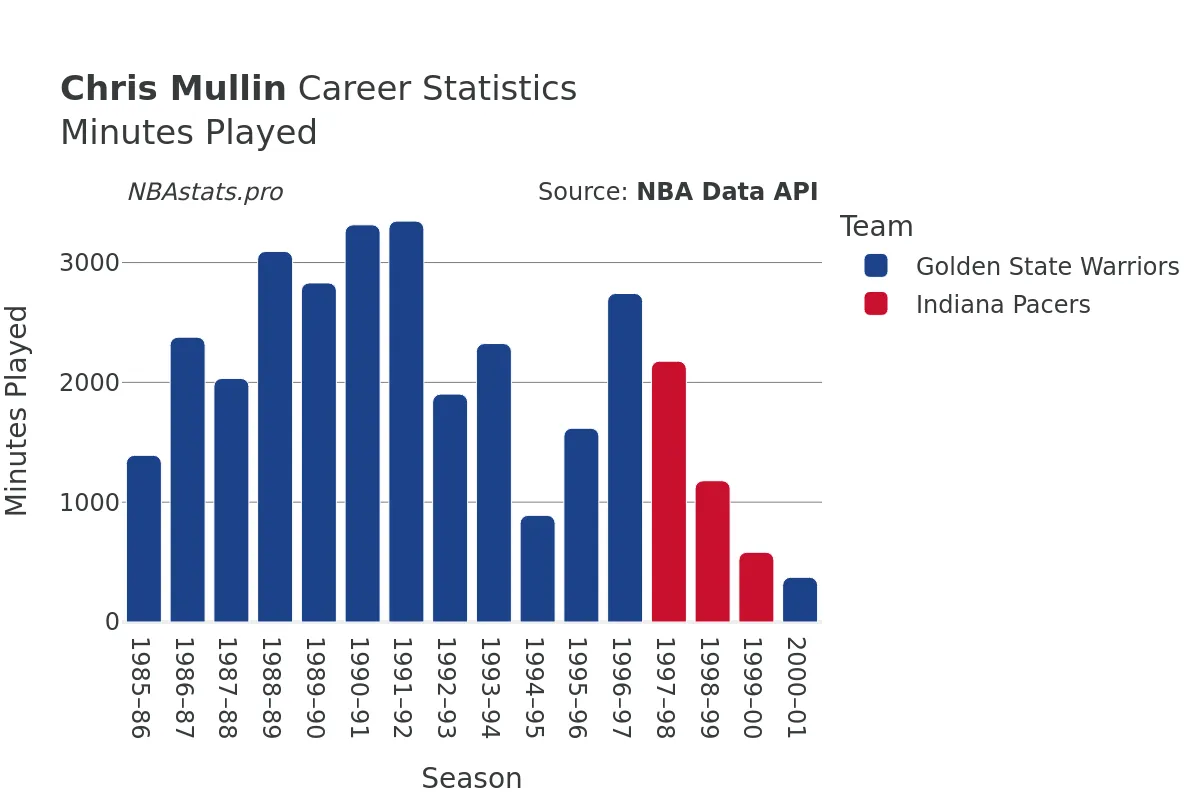
Minutes Played
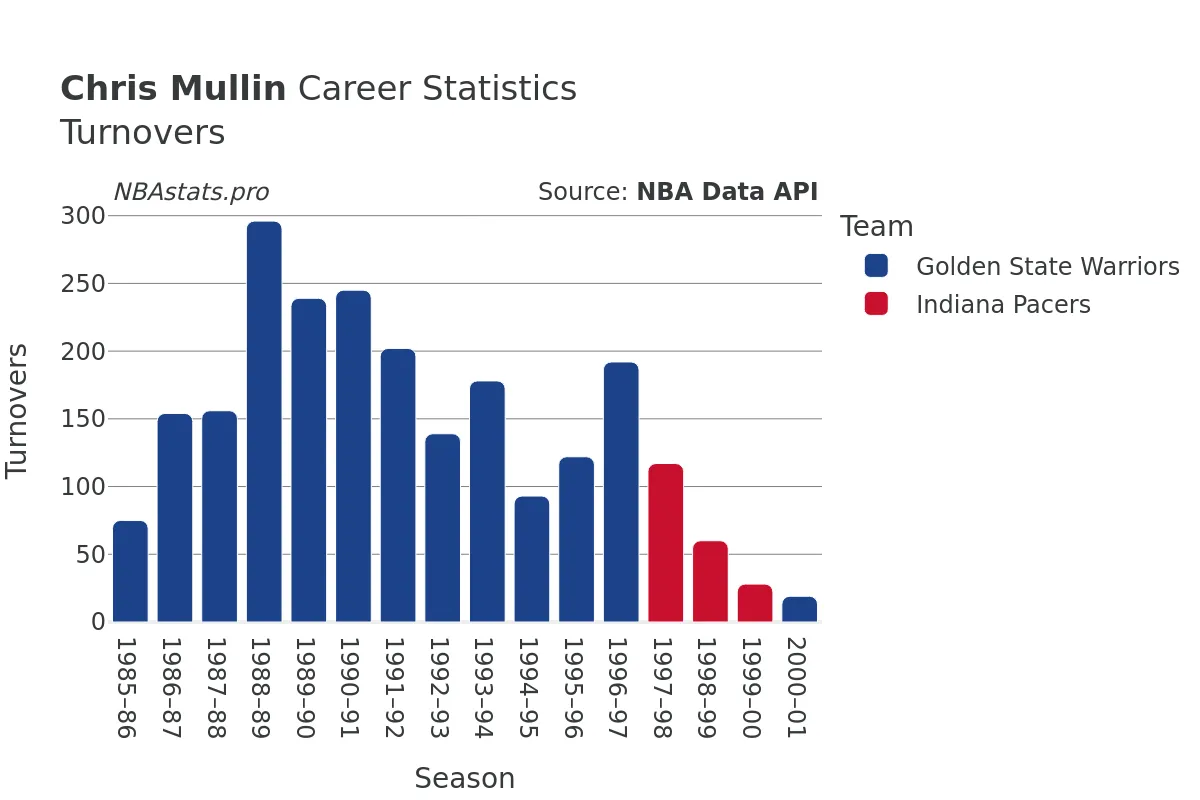
Turnovers
Blocks
Chris Mullin Career Stats Table
| SEASON | TEAM | AGE | GP | GS | MIN | FGM | FGA | FG % | FG3M | FG3A | FG3 % | FTM | FTA | FT % | OREB | DREB | REB | AST | STL | BLK | TOV | PF | PTS | |
|---|---|---|---|---|---|---|---|---|---|---|---|---|---|---|---|---|---|---|---|---|---|---|---|---|
| 1 | 1985-86 | GOS | 22 | 55 | 30 | 1,391 | 287 | 620 | 46.3% | 5 | 27 | 18.5% | 189 | 211 | 89.6% | 42 | 73 | 115 | 105 | 70 | 23 | 75 | 130 | 768 |
| 2 | 1986-87 | GOS | 23 | 82 | 82 | 2,377 | 477 | 928 | 51.4% | 19 | 63 | 30.2% | 269 | 326 | 82.5% | 39 | 142 | 181 | 261 | 98 | 36 | 154 | 217 | 1,242 |
| 3 | 1987-88 | GOS | 24 | 60 | 55 | 2,033 | 470 | 926 | 50.8% | 34 | 97 | 35.1% | 239 | 270 | 88.5% | 58 | 147 | 205 | 290 | 113 | 32 | 156 | 136 | 1,213 |
| 4 | 1988-89 | GOS | 25 | 82 | 82 | 3,093 | 830 | 1,630 | 50.9% | 23 | 100 | 23.0% | 493 | 553 | 89.2% | 152 | 331 | 483 | 415 | 176 | 39 | 296 | 178 | 2,176 |
| 5 | 1989-90 | GOS | 26 | 78 | 78 | 2,830 | 682 | 1,272 | 53.6% | 87 | 234 | 37.2% | 505 | 568 | 88.9% | 130 | 333 | 463 | 319 | 123 | 45 | 239 | 142 | 1,956 |
| 6 | 1990-91 | GOS | 27 | 82 | 82 | 3,315 | 777 | 1,449 | 53.6% | 40 | 133 | 30.1% | 513 | 580 | 88.4% | 141 | 302 | 443 | 329 | 173 | 63 | 245 | 176 | 2,107 |
| 7 | 1991-92 | GOS | 28 | 81 | 81 | 3,346 | 830 | 1,584 | 52.4% | 64 | 175 | 36.6% | 350 | 420 | 83.3% | 127 | 323 | 450 | 286 | 173 | 62 | 202 | 171 | 2,074 |
| 8 | 1992-93 | GOS | 29 | 46 | 46 | 1,902 | 474 | 930 | 51.0% | 60 | 133 | 45.1% | 183 | 226 | 81.0% | 42 | 190 | 232 | 166 | 68 | 41 | 139 | 76 | 1,191 |
| 9 | 1993-94 | GOS | 30 | 62 | 39 | 2,324 | 410 | 869 | 47.2% | 55 | 151 | 36.4% | 165 | 219 | 75.3% | 64 | 281 | 345 | 315 | 107 | 53 | 178 | 114 | 1,040 |
| 10 | 1994-95 | GOS | 31 | 25 | 23 | 890 | 170 | 348 | 48.9% | 42 | 93 | 45.2% | 94 | 107 | 87.9% | 25 | 90 | 115 | 125 | 38 | 19 | 93 | 53 | 476 |
| 11 | 1995-96 | GOS | 32 | 55 | 19 | 1,617 | 269 | 539 | 49.9% | 59 | 150 | 39.3% | 137 | 160 | 85.6% | 44 | 115 | 159 | 194 | 75 | 32 | 122 | 127 | 734 |
| 12 | 1996-97 | GSW | 33 | 79 | 62 | 2,742 | 438 | 792 | 55.3% | 83 | 202 | 41.1% | 184 | 213 | 86.4% | 75 | 242 | 317 | 322 | 130 | 33 | 192 | 155 | 1,143 |
| 13 | 1997-98 | IND | 34 | 82 | 82 | 2,177 | 333 | 692 | 48.1% | 107 | 243 | 44.0% | 154 | 164 | 93.9% | 38 | 211 | 249 | 186 | 95 | 39 | 117 | 186 | 927 |
| 14 | 1998-99 | IND | 35 | 50 | 50 | 1,179 | 177 | 371 | 47.7% | 73 | 157 | 46.5% | 80 | 92 | 87.0% | 25 | 135 | 160 | 81 | 47 | 13 | 60 | 101 | 507 |
| 15 | 1999-00 | IND | 36 | 47 | 2 | 582 | 80 | 187 | 42.8% | 45 | 110 | 40.9% | 37 | 41 | 90.2% | 14 | 62 | 76 | 37 | 28 | 9 | 28 | 60 | 242 |
| 16 | 2000-01 | GSW | 37 | 20 | 8 | 373 | 36 | 106 | 34.0% | 19 | 52 | 36.5% | 24 | 28 | 85.7% | 10 | 31 | 41 | 19 | 16 | 10 | 19 | 28 | 115 |
Max Min
NBA Alltime Leaders
Games Played
Robert Parish: 1,611Kareem Abdul-Jabbar: 1,560
Vince Carter: 1,541
Dirk Nowitzki: 1,522
John Stockton: 1,504
Points
LeBron James: 40,474Kareem Abdul-Jabbar: 38,387
Karl Malone: 36,928
Kobe Bryant: 33,643
Michael Jordan: 32,292
Steals
John Stockton: 3,265Jason Kidd: 2,684
Chris Paul: 2,614
Michael Jordan: 2,514
Gary Payton: 2,445
Free Throws Made
Karl Malone: 9,787Moses Malone: 8,531
LeBron James: 8,390
Kobe Bryant: 8,378
Oscar Robertson: 7,694