Channing Frye Stats: NBA Career

Embark on a fascinating journey into the career of NBA veteran, Channing Frye. With an illustrious path that spanned across multiple teams and cities, Frye left a lasting impact on the basketball court. Let's delve into the statistics and milestones that defined his time in the NBA.
Frye entered the NBA scene in the 2005-06 season, donning the jersey of the New York Knicks. This marked the beginning of a remarkable professional career that would see him showcase his talents for several renowned... franchises. Throughout his tenure in the league, Frye's journey took him through the Portland Trail Blazers, Phoenix Suns, Orlando Magic, Cleveland Cavaliers, and finally, the Los Angeles Lakers.
One of the most intriguing aspects of Frye's career is his versatility and adaptability on the court. Standing at 6 feet 11 inches, his presence was felt at both ends of the floor. His offensive prowess was evident in his goal statistics, with an impressive 44.18% field goal percentage. Frye's ability to find the basket consistently, as showcased by his 3,187 goals made out of 7,214 attempts, made him a reliable scoring option for his teams.
A standout facet of Frye's game was his proficiency at the free-throw line. Boasting a stellar free-throw percentage, Frye's clutch performances in pressure situations endeared him to fans and teammates alike. With 922 successful free throws out of 1,118 attempts, Frye's accuracy from the charity stripe was a valuable asset for any team he suited up for.
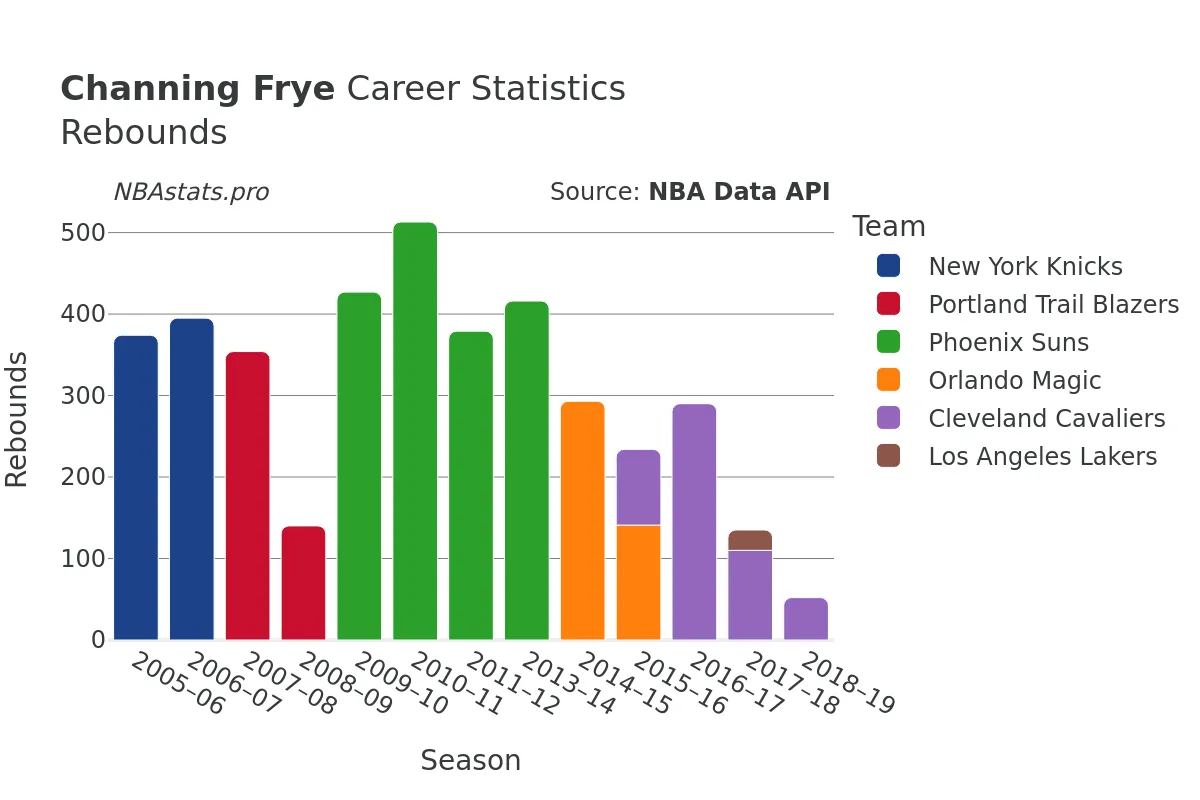
Beyond scoring, Frye's impact extended to the boards, where he displayed a knack for grabbing rebounds. Over the course of his career, Frye amassed an impressive total of 4,371 rebounds. His prowess on the glass was highlighted by his ability to secure both defensive and offensive rebounds, with 3,557 and 814 respectively, showcasing his well-rounded skills as a big man.
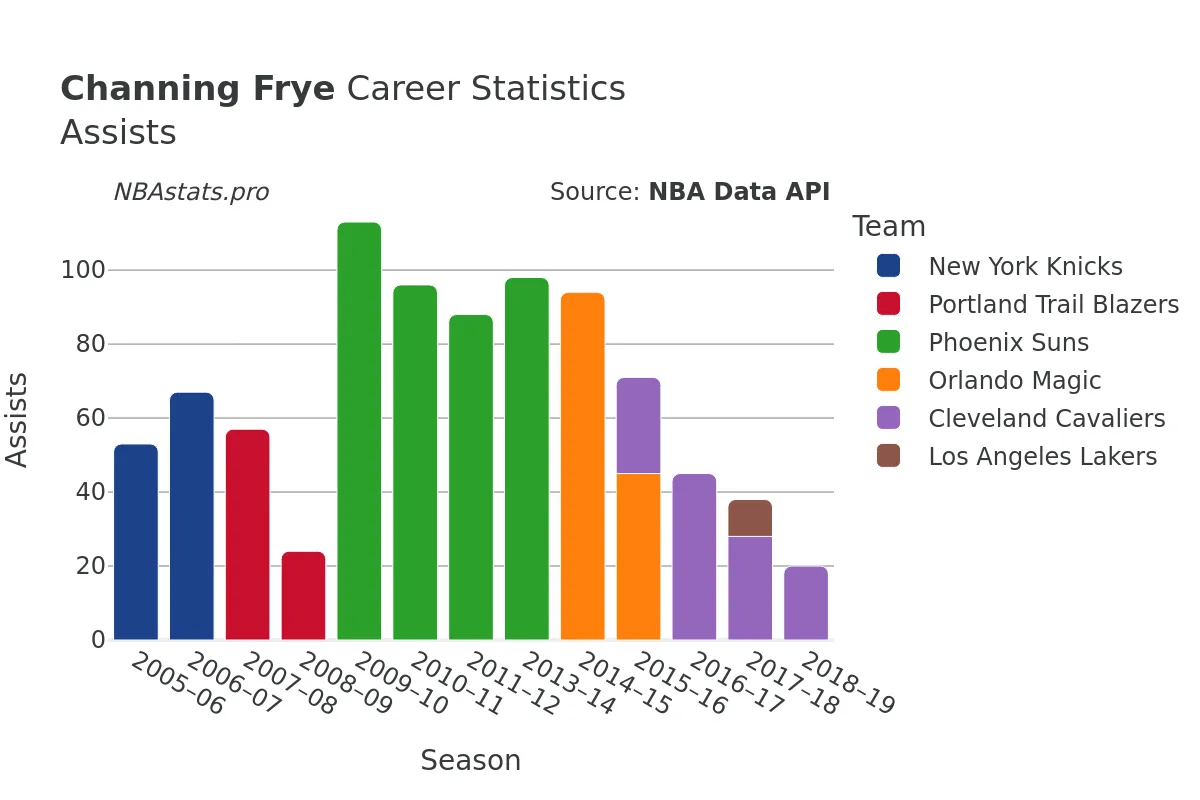
In addition to his scoring and rebounding abilities, Frye was also a proficient playmaker, notching up 973 assists over his career. His court vision and passing acumen allowed him to create scoring opportunities for his teammates, further solidifying his value on the court.
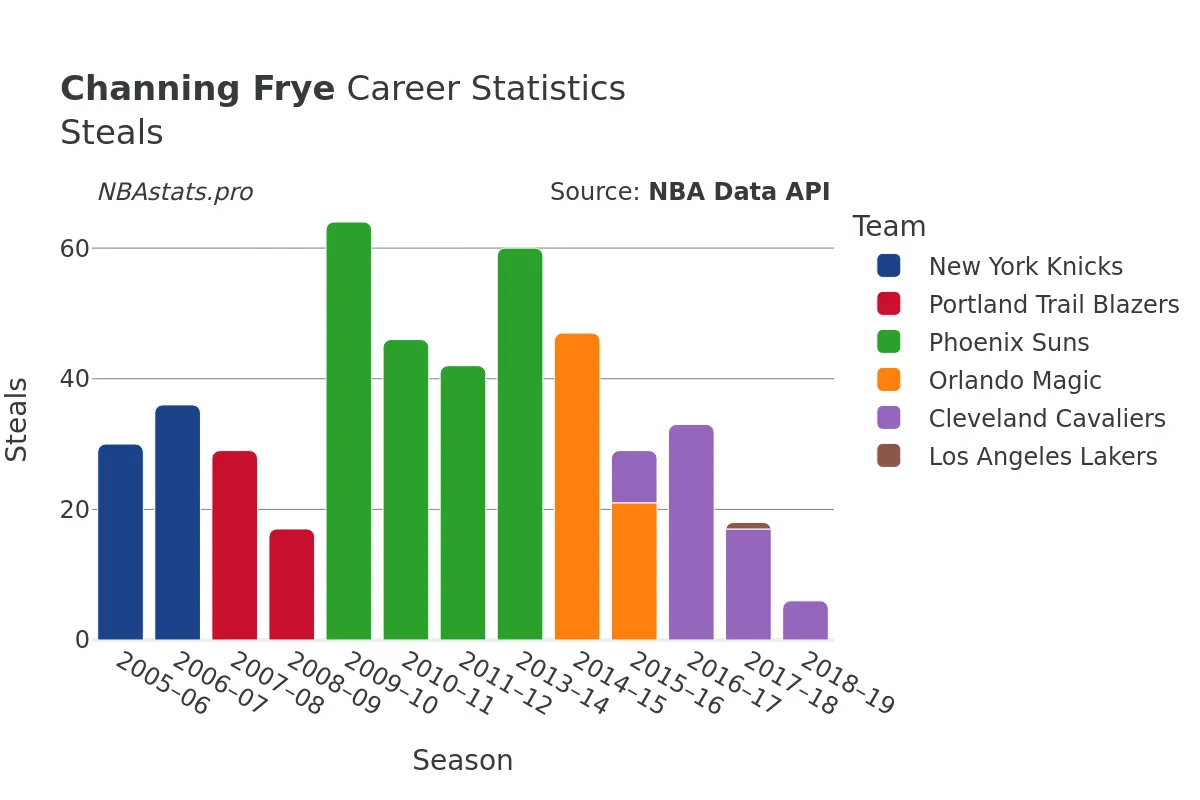
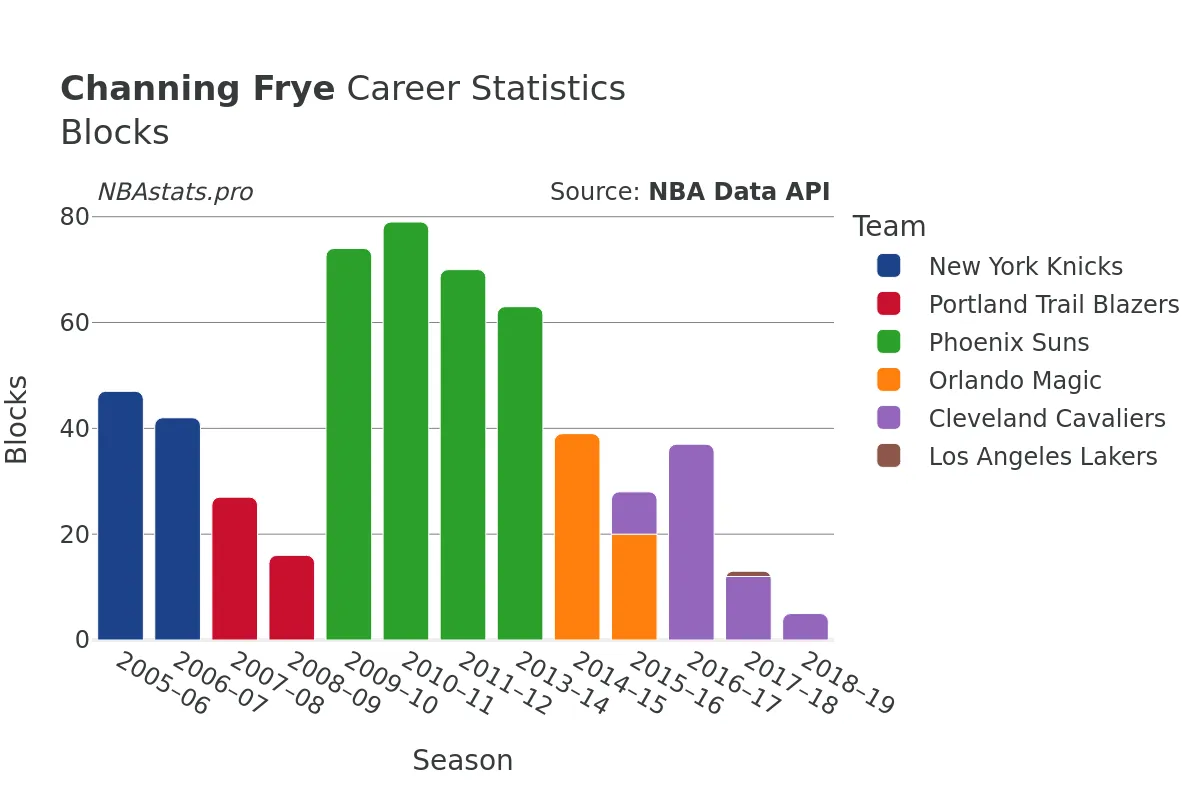
Defensively, Frye's presence was formidable, evidenced by his 504 steals and 581 blocks. His ability to disrupt opposing offenses and protect the rim made him a valuable asset on the defensive end of the floor.
As Frye's career progressed, his veteran leadership and experience became invaluable to the teams he played for. His guidance both on and off the court helped mentor younger players and foster a culture of professionalism and excellence within his teams.
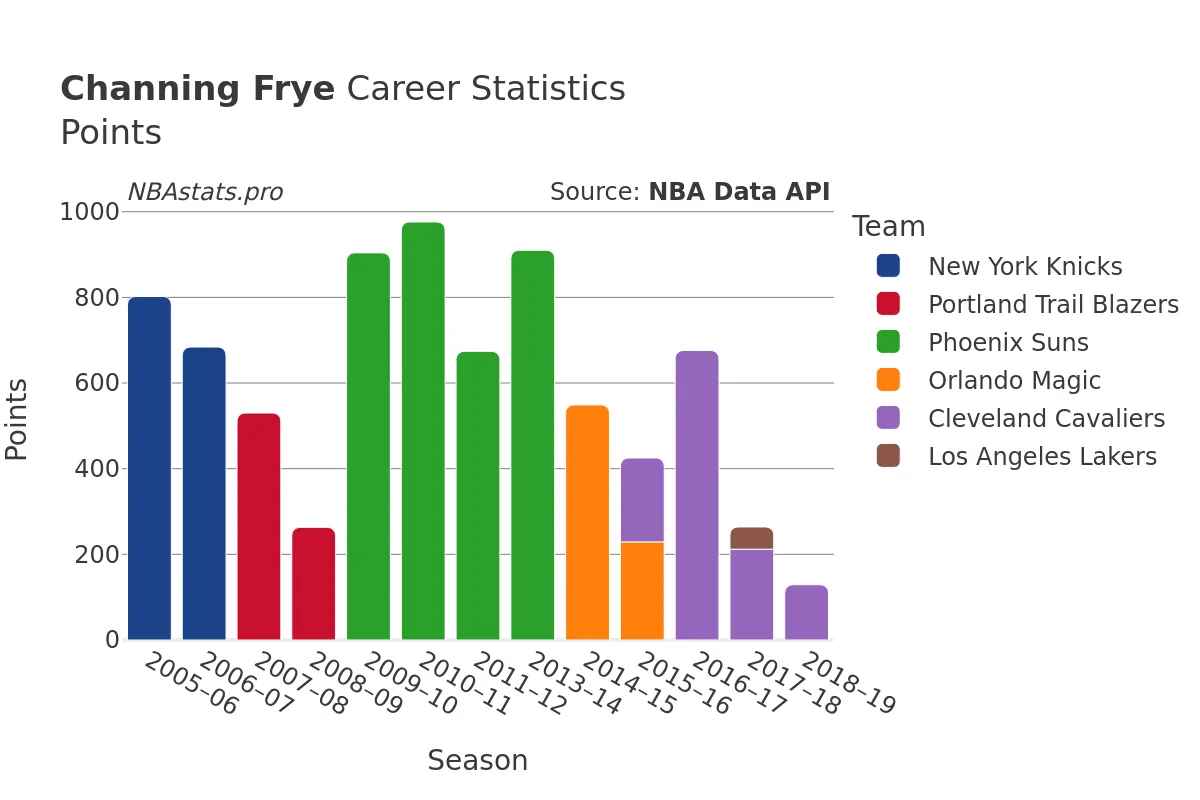
With a career total of 8,475 points, Frye's contributions to the game of basketball will forever be etched in NBA history. From his scoring prowess to his rebounding tenacity and defensive presence, Frye's impact transcended statistics, leaving a legacy of hard work, dedication, and passion for the game.
Explore the numbers, dissect the data, and uncover the story of Channing Frye's NBA journey. Dive into the charts, compare the stats, and gain a deeper understanding of the player who left an indelible mark on the basketball world.
Read more
Games Played
Points
Assists
Rebounds
Steals
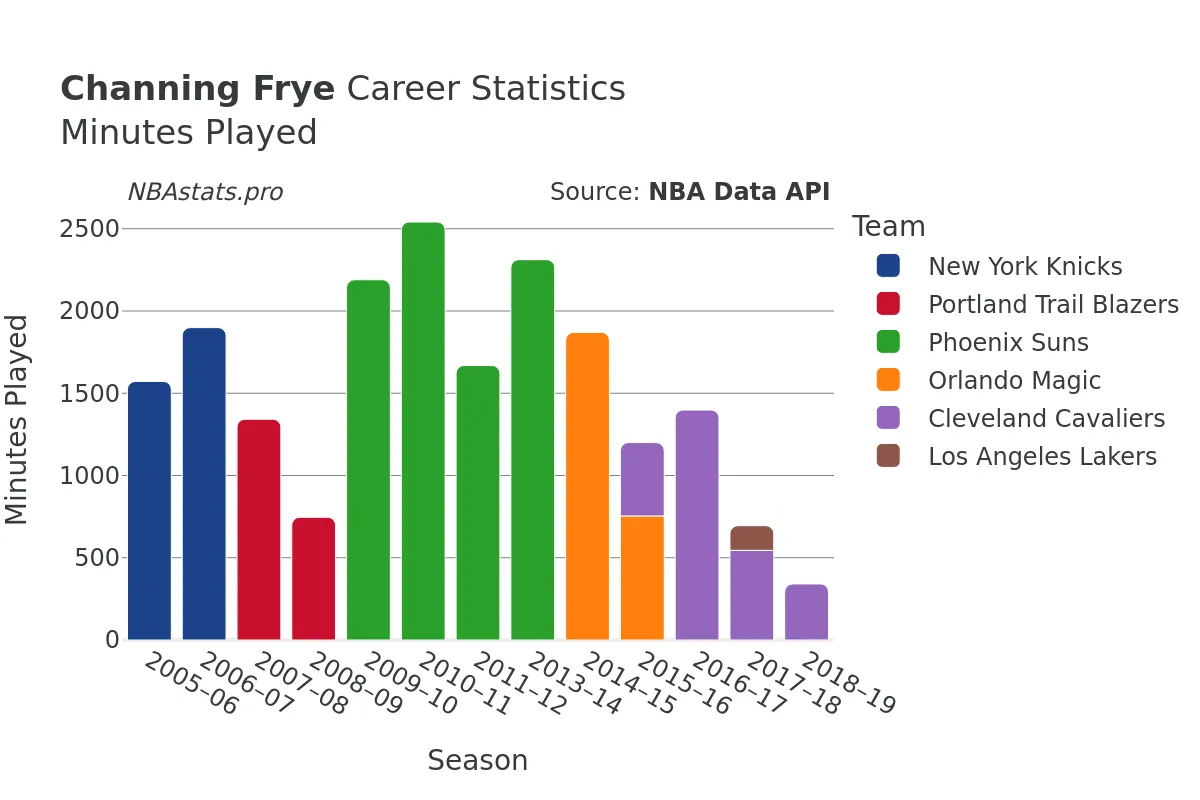
Minutes Played
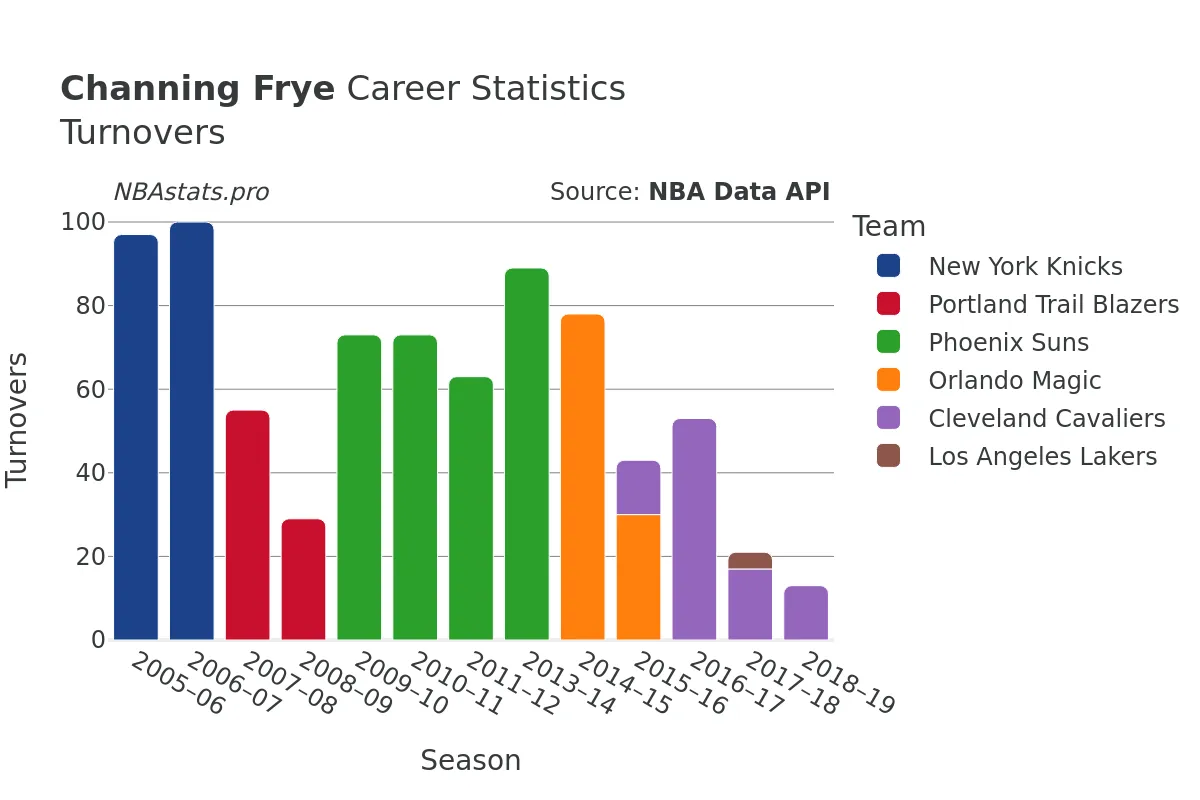
Turnovers
Blocks
Channing Frye Career Stats Table
| SEASON | TEAM | AGE | GP | GS | MIN | FGM | FGA | FG % | FG3M | FG3A | FG3 % | FTM | FTA | FT % | OREB | DREB | REB | AST | STL | BLK | TOV | PF | PTS | |
|---|---|---|---|---|---|---|---|---|---|---|---|---|---|---|---|---|---|---|---|---|---|---|---|---|
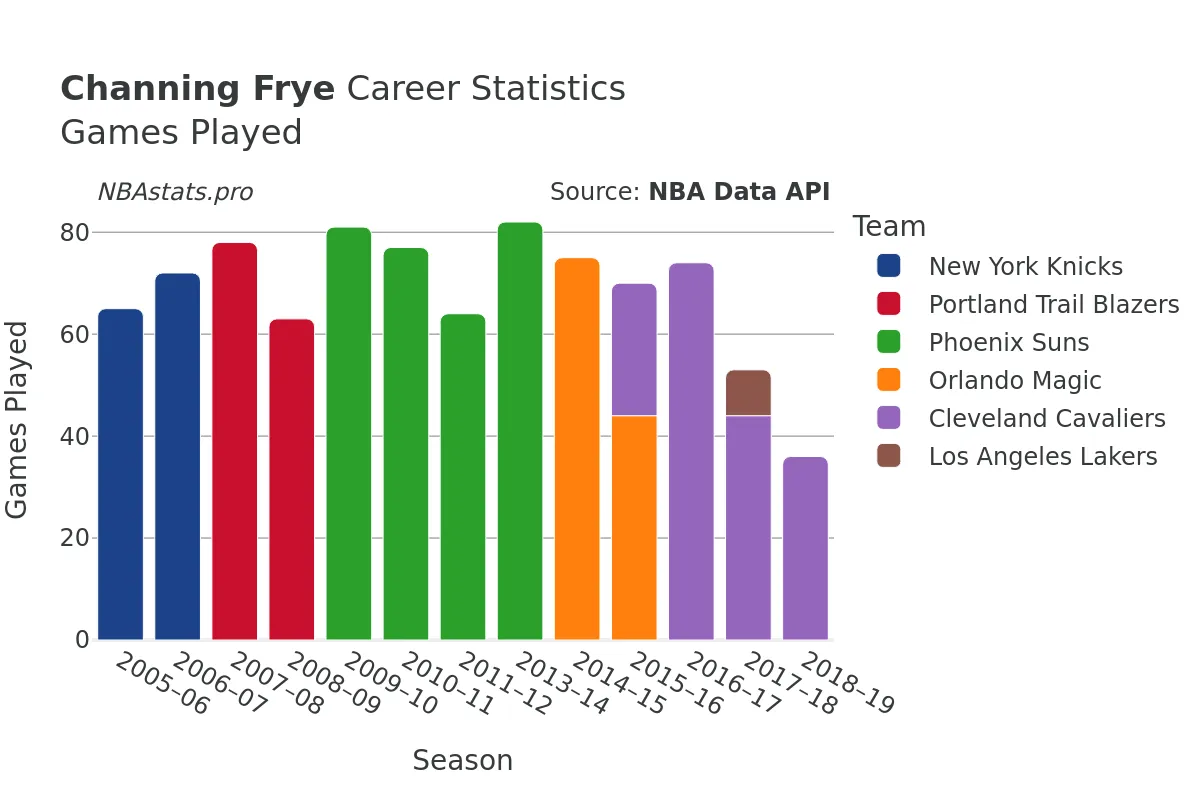
| 1 | 2005-06 | NYK | 23 | 65 | 14 | 1,572 | 305 | 640 | 47.7% | 3 | 9 | 33.3% | 189 | 229 | 82.5% | 138 | 236 | 374 | 53 | 30 | 47 | 97 | 200 | 802 |
| 2 | 2006-07 | NYK | 24 | 72 | 59 | 1,899 | 298 | 689 | 43.3% | 3 | 18 | 16.7% | 85 | 108 | 78.7% | 91 | 304 | 395 | 67 | 36 | 42 | 100 | 216 | 684 |
| 3 | 2007-08 | POR | 25 | 78 | 20 | 1,342 | 221 | 453 | 48.8% | 3 | 10 | 30.0% | 85 | 109 | 78.0% | 107 | 247 | 354 | 57 | 29 | 27 | 55 | 208 | 530 |
| 4 | 2008-09 | POR | 26 | 63 | 1 | 746 | 113 | 267 | 42.3% | 11 | 33 | 33.3% | 26 | 36 | 72.2% | 41 | 99 | 140 | 24 | 17 | 16 | 29 | 106 | 263 |
| 5 | 2009-10 | PHX | 27 | 81 | 41 | 2,190 | 317 | 703 | 45.1% | 172 | 392 | 43.9% | 98 | 121 | 81.0% | 66 | 361 | 427 | 113 | 64 | 74 | 73 | 263 | 904 |
| 6 | 2010-11 | PHX | 28 | 77 | 64 | 2,541 | 358 | 829 | 43.2% | 171 | 439 | 39.0% | 89 | 107 | 83.2% | 65 | 448 | 513 | 96 | 46 | 79 | 73 | 272 | 976 |
| 7 | 2011-12 | PHX | 29 | 64 | 59 | 1,669 | 255 | 613 | 41.6% | 91 | 263 | 34.6% | 73 | 82 | 89.0% | 71 | 308 | 379 | 88 | 42 | 70 | 63 | 176 | 674 |
| 8 | 2013-14 | PHX | 31 | 82 | 82 | 2,312 | 336 | 778 | 43.2% | 160 | 432 | 37.0% | 78 | 95 | 82.1% | 73 | 343 | 416 | 98 | 60 | 63 | 89 | 245 | 910 |
| 9 | 2014-15 | ORL | 32 | 75 | 51 | 1,870 | 191 | 487 | 39.2% | 136 | 346 | 39.3% | 31 | 35 | 88.6% | 27 | 266 | 293 | 94 | 47 | 39 | 78 | 191 | 549 |
| 10 | 2015-16 | ORL | 33 | 44 | 29 | 754 | 81 | 186 | 43.5% | 48 | 121 | 39.7% | 19 | 21 | 90.5% | 23 | 118 | 141 | 45 | 21 | 20 | 30 | 71 | 229 |
| 11 | 2015-16 | CLE | 33 | 26 | 3 | 446 | 71 | 161 | 44.1% | 43 | 114 | 37.7% | 11 | 14 | 78.6% | 12 | 81 | 93 | 26 | 8 | 8 | 13 | 56 | 196 |
| 12 | 2015-16 | TOT | 33 | 70 | 32 | 1,199 | 152 | 347 | 43.8% | 91 | 235 | 38.7% | 30 | 35 | 85.7% | 35 | 199 | 234 | 71 | 29 | 28 | 43 | 127 | 425 |
| 13 | 2016-17 | CLE | 34 | 74 | 15 | 1,398 | 238 | 520 | 45.8% | 137 | 335 | 40.9% | 63 | 74 | 85.1% | 37 | 253 | 290 | 45 | 33 | 37 | 53 | 138 | 676 |
| 14 | 2017-18 | CLE | 35 | 44 | 1 | 545 | 84 | 169 | 49.7% | 30 | 90 | 33.3% | 14 | 15 | 93.3% | 10 | 100 | 110 | 28 | 17 | 12 | 17 | 54 | 212 |
| 15 | 2017-18 | LAL | 35 | 9 | 0 | 150 | 20 | 43 | 46.5% | 9 | 25 | 36.0% | 3 | 4 | 75.0% | 2 | 23 | 25 | 10 | 1 | 1 | 4 | 15 | 52 |
| 16 | 2017-18 | TOT | 35 | 53 | 1 | 695 | 104 | 212 | 49.1% | 39 | 115 | 33.9% | 17 | 19 | 89.5% | 12 | 123 | 135 | 38 | 18 | 13 | 21 | 69 | 264 |
| 17 | 2018-19 | CLE | 36 | 36 | 6 | 341 | 43 | 117 | 36.8% | 32 | 79 | 40.5% | 11 | 14 | 78.6% | 4 | 48 | 52 | 20 | 6 | 5 | 13 | 44 | 129 |
Max Min
NBA Alltime Leaders
Games Played
Robert Parish: 1,611Kareem Abdul-Jabbar: 1,560
Vince Carter: 1,541
Dirk Nowitzki: 1,522
John Stockton: 1,504
Points
LeBron James: 40,474Kareem Abdul-Jabbar: 38,387
Karl Malone: 36,928
Kobe Bryant: 33,643
Michael Jordan: 32,292
Steals
John Stockton: 3,265Jason Kidd: 2,684
Chris Paul: 2,614
Michael Jordan: 2,514
Gary Payton: 2,445
Free Throws Made
Karl Malone: 9,787Moses Malone: 8,531
LeBron James: 8,390
Kobe Bryant: 8,378
Oscar Robertson: 7,694