Chandler Parsons Stats: NBA Career

**Chandler Parsons: A Versatile Player with a Knack for Accuracy**
When it comes to versatility on the basketball court, Chandler Parsons is a name that resonates with fans and analysts alike. With an impressive career spanning from the 2011-12 season to the 2019-20 season, Parsons has showcased his skills and basketball IQ while playing for four different teams - the Houston Rockets, Dallas Mavericks, Memphis Grizzlies, and Atlanta Hawks. Let's dive deeper into the numbers to truly appreciate ...the impact this talented player has had on the game.
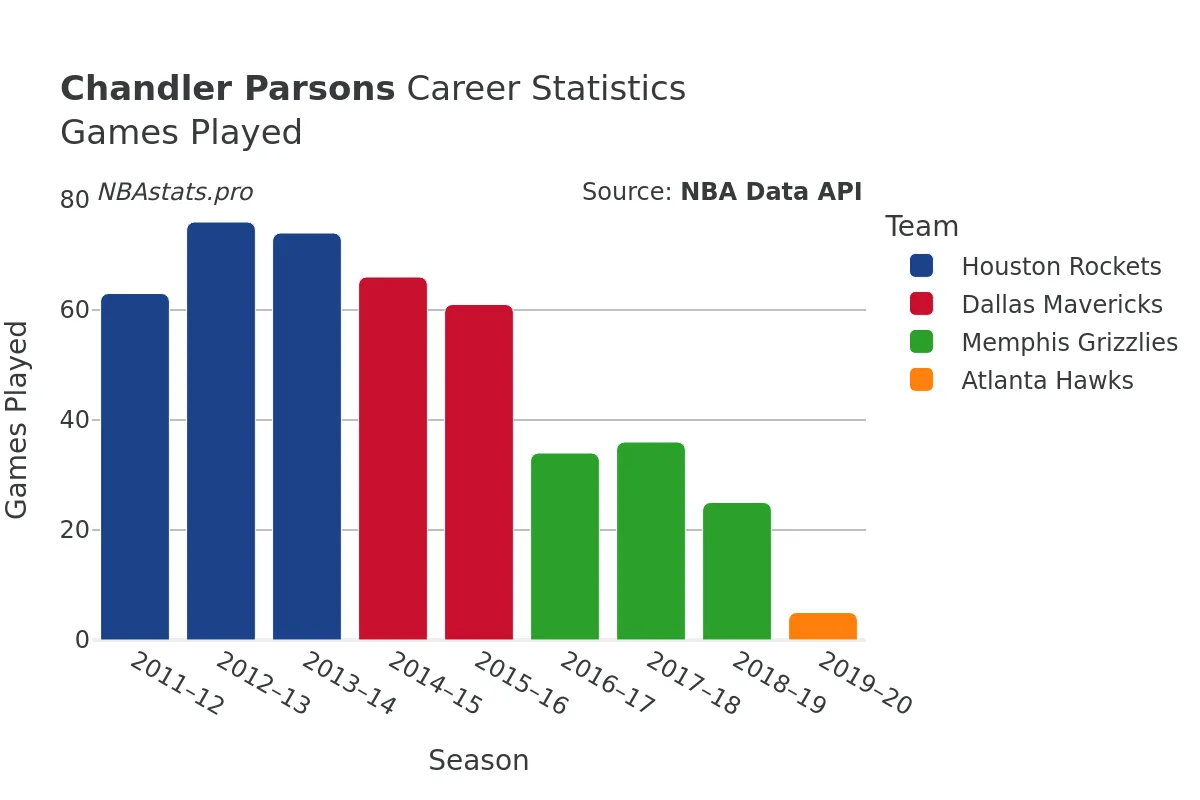
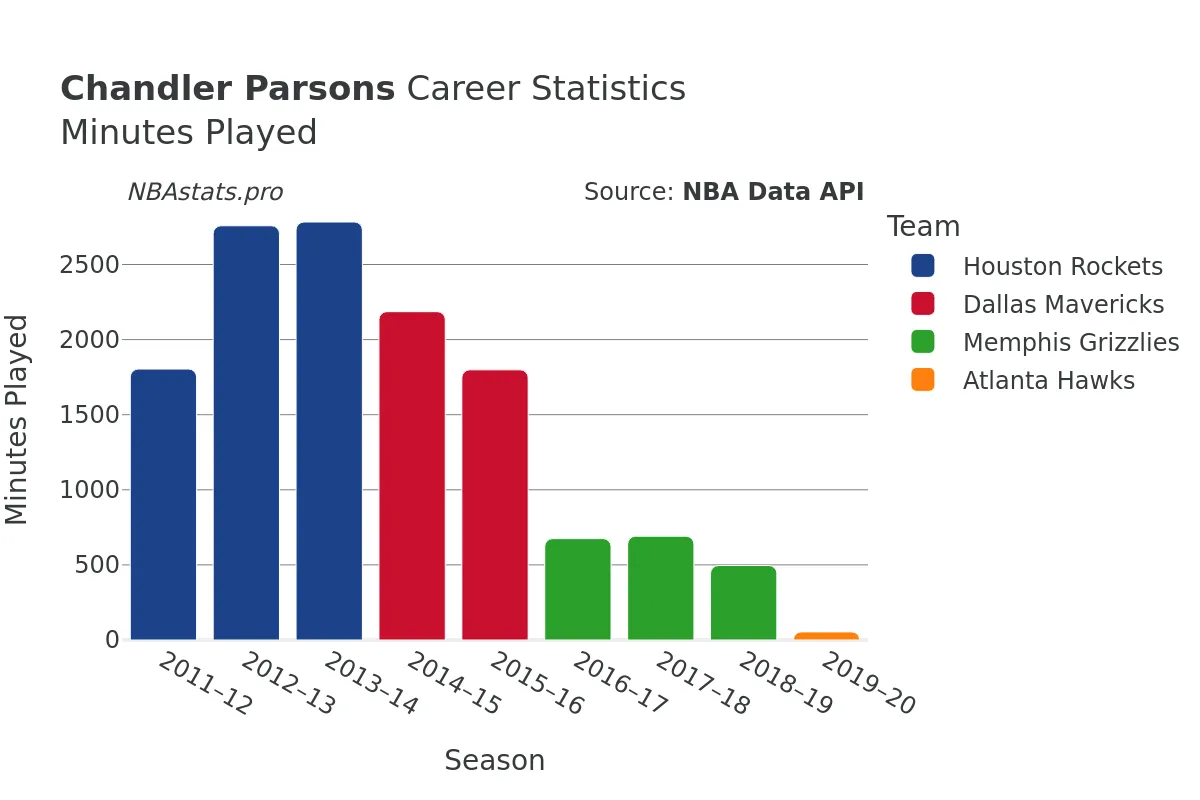
Throughout his career, Parsons played a total of 440 games, amassing an impressive 13,246 minutes on the court. This extensive playing time speaks volumes about his durability, work ethic, and value to his teams. Parsons made a total of 2,129 field goals out of 4,611 attempts, boasting an impressive shooting percentage of approximately 46%. This level of accuracy is a testament to his skill and ability to score efficiently when his team needs it the most.
One aspect of Chandler Parsons' game that truly stands out is his consistency from the free-throw line. With 626 successful free throws out of 878 attempts, Parsons maintained a free-throw percentage that was undoubtedly a weapon for his teams. His ability to deliver at the charity stripe under pressure showcases his composure and focus in crucial moments of the game.
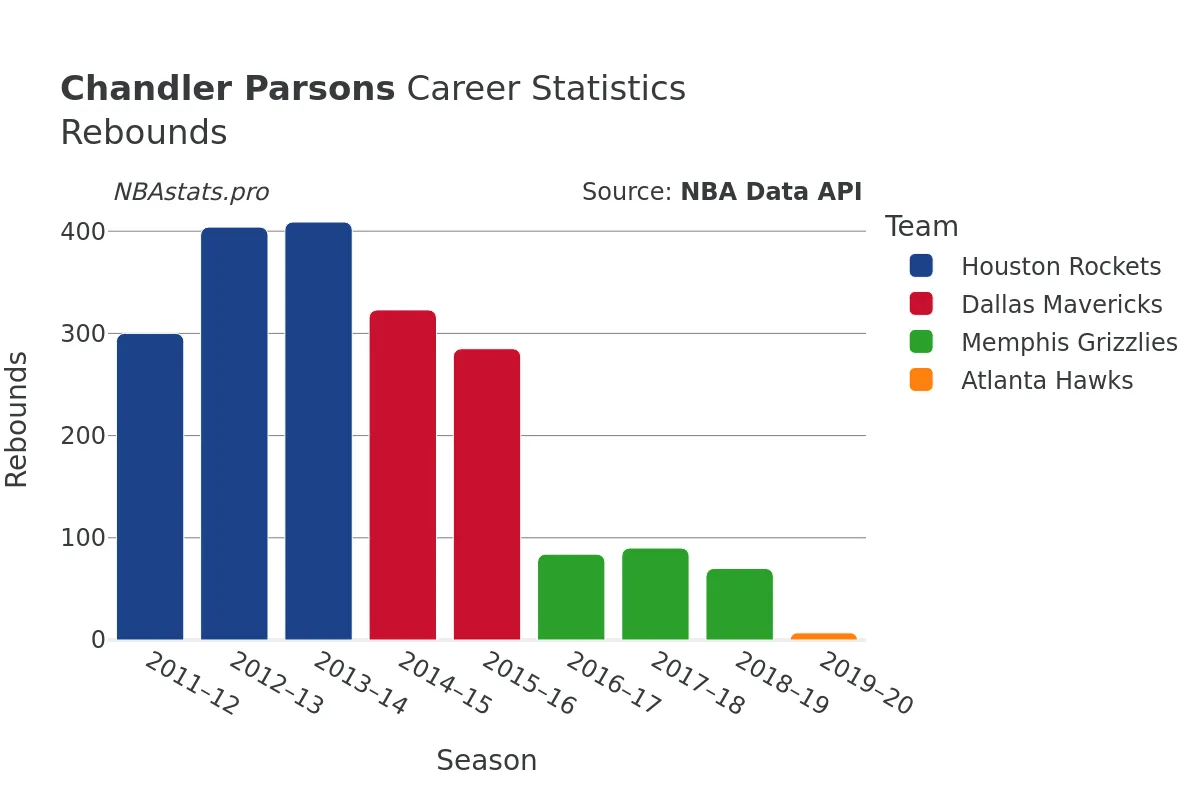
Rebounding is another area where Parsons excelled during his time in the league. He secured a total of 1,972 rebounds, with 1,616 defensive rebounds and 356 offensive rebounds. His prowess on the boards allowed his teams to control the flow of the game, create second-chance opportunities, and limit the opponents' offensive possessions.
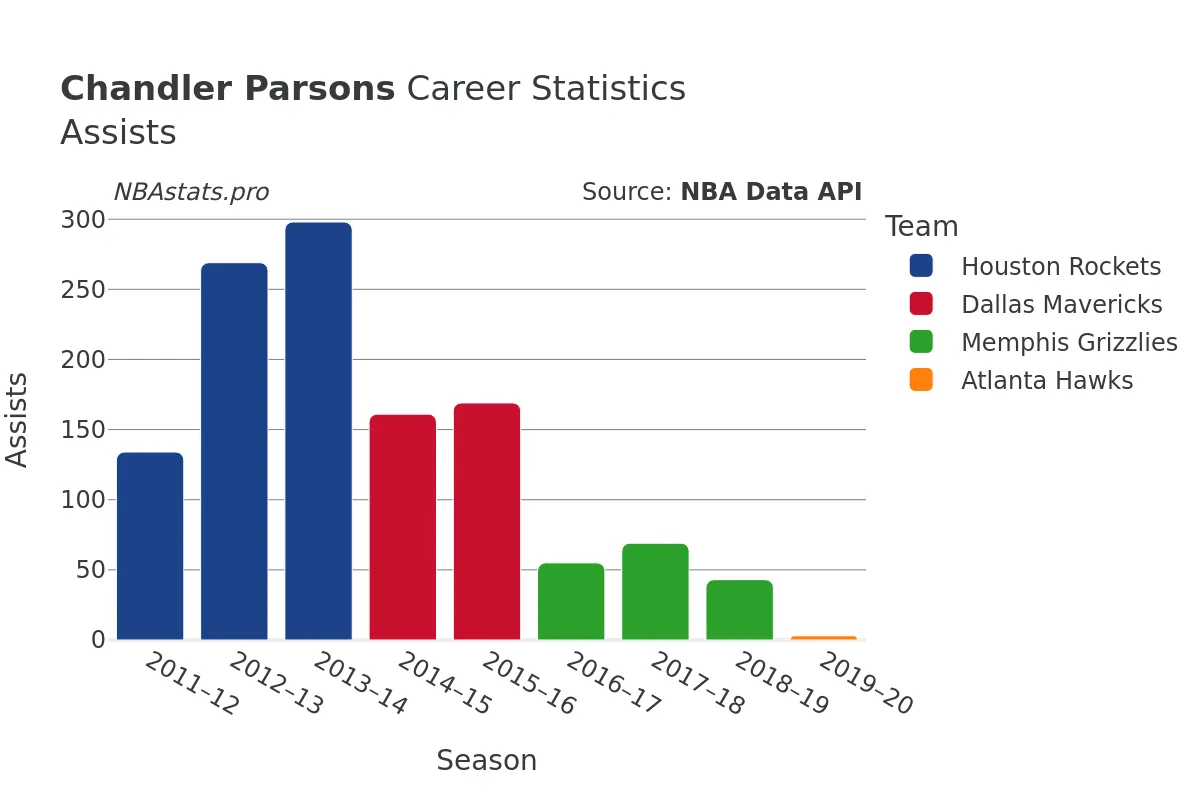
When it comes to playmaking, Chandler Parsons proved to be a valuable asset as well. He recorded 1,201 assists throughout his career, showcasing his ability to create scoring opportunities for his teammates and facilitate ball movement on the court. His vision and passing skills added another dimension to his game, making him a well-rounded player on both ends of the floor.
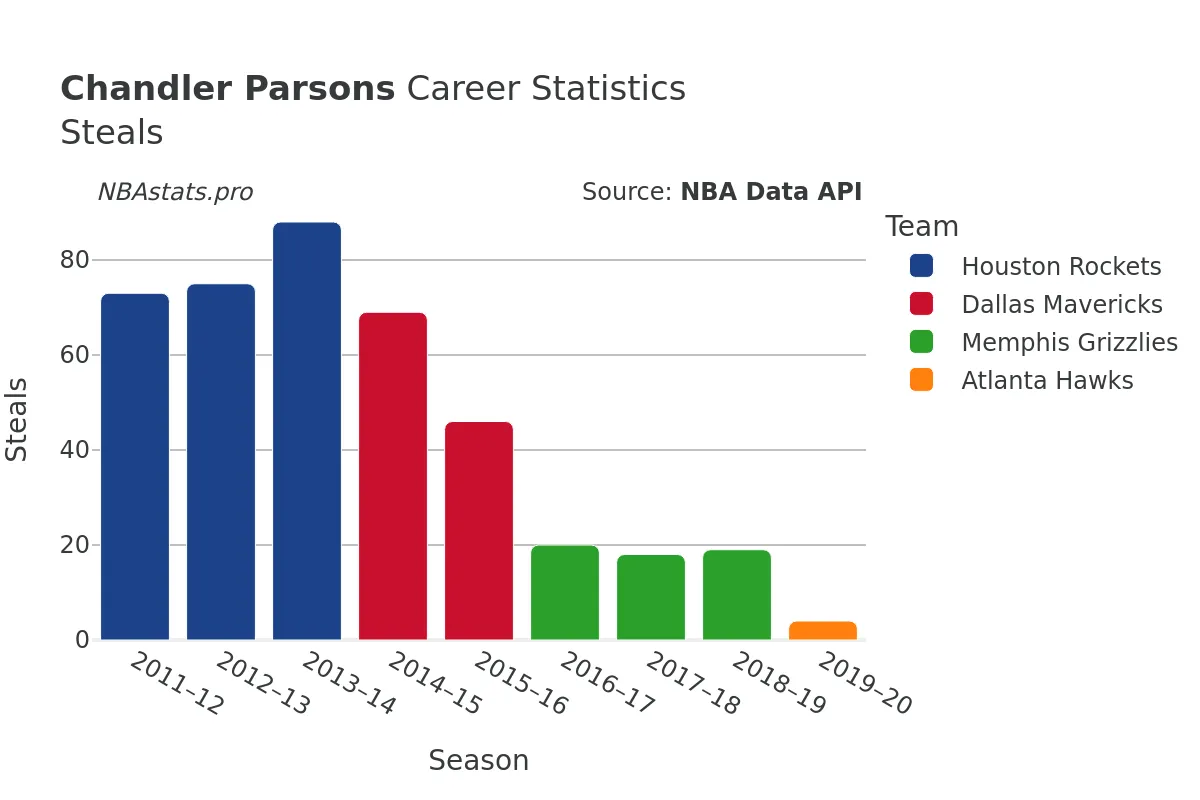
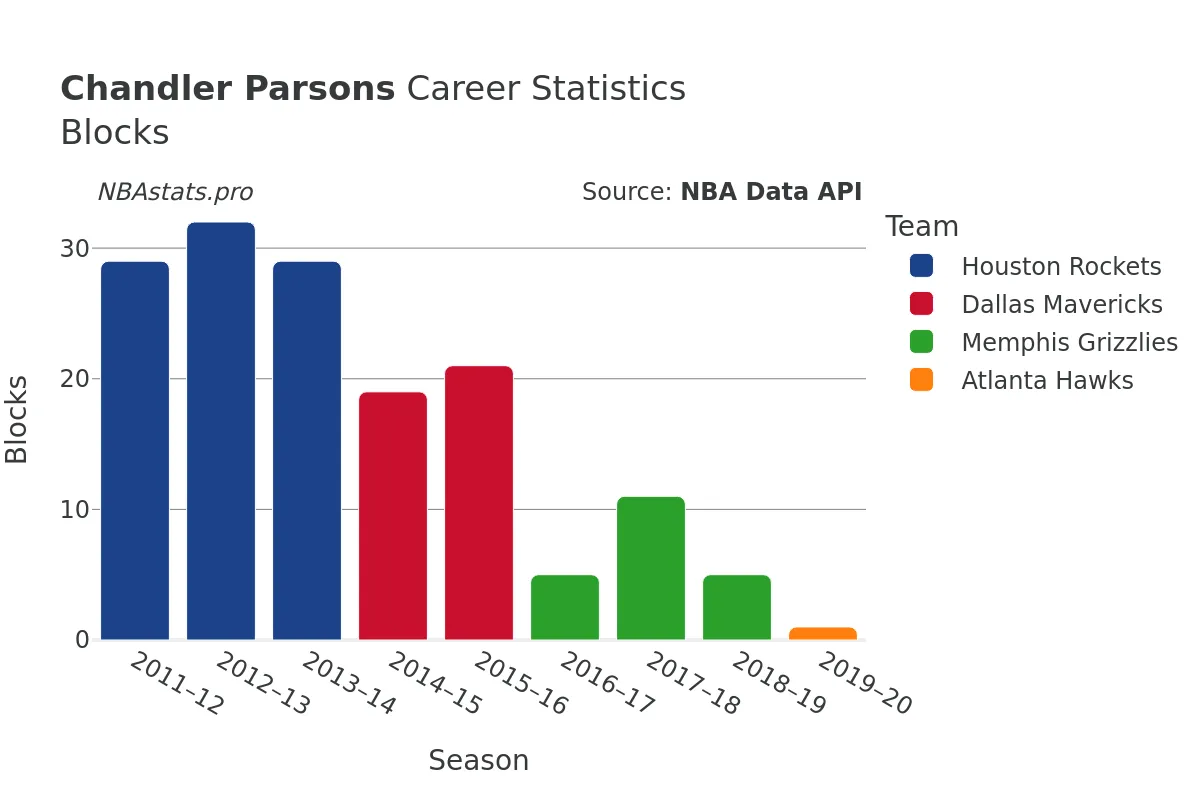
Defensively, Parsons made his presence felt with 412 steals and 152 blocks. His ability to disrupt the opponents' offense, generate turnovers, and protect the rim highlights his commitment to making an impact on both ends of the court. Parsons' defensive awareness and versatility enabled him to guard multiple positions effectively, making him a valuable asset for his teams.
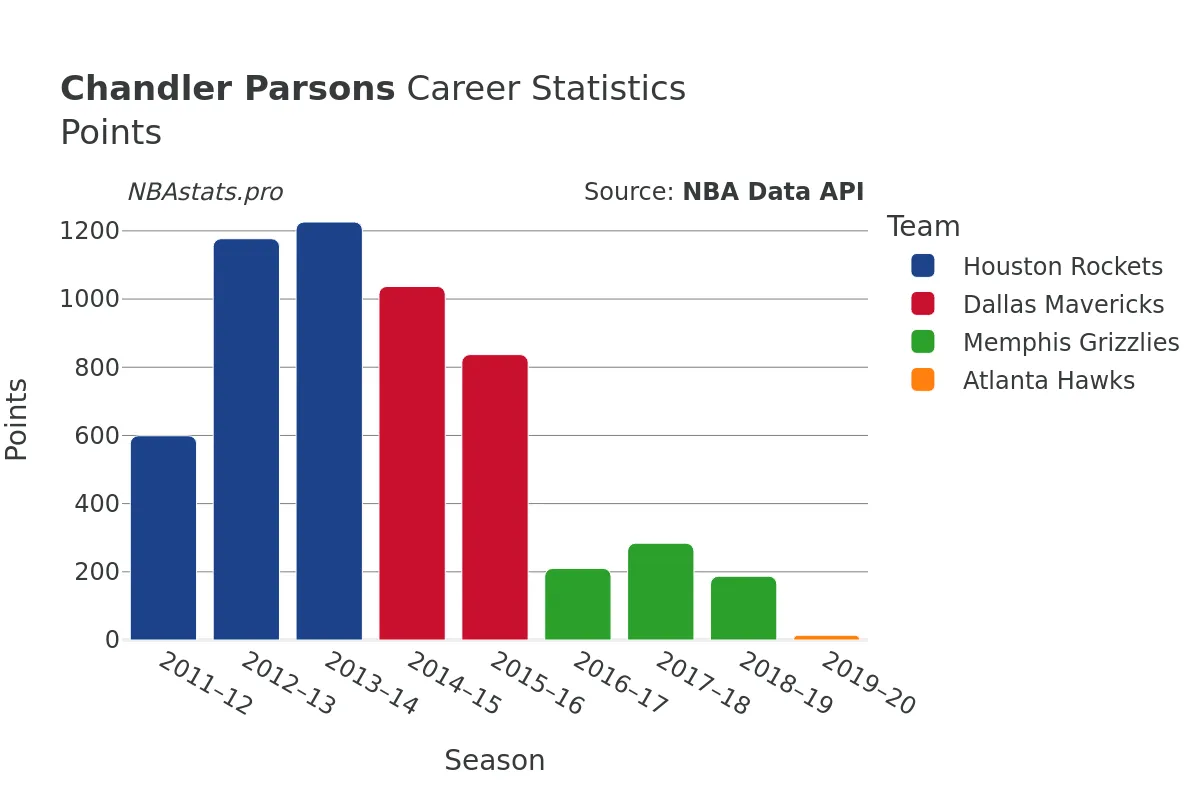
In terms of scoring, Chandler Parsons amassed a total of 5,571 points throughout his career. His scoring prowess, combined with his efficiency and versatility, made him a reliable scoring option for his teams in crucial moments. Whether it was knocking down jump shots, attacking the rim, or converting at the free-throw line, Parsons consistently found ways to put points on the board and contribute to his team's success.
As we delve into the statistical achievements and highlights of Chandler Parsons' career, it becomes evident that he was not just a talented player but a consummate professional who made a positive impact wherever he went. His time in the league may have come to an end, but his legacy as a versatile player with a knack for accuracy will continue to be remembered and appreciated by basketball enthusiasts around the world.
Read more
Games Played
Points
Assists
Rebounds
Steals
Minutes Played
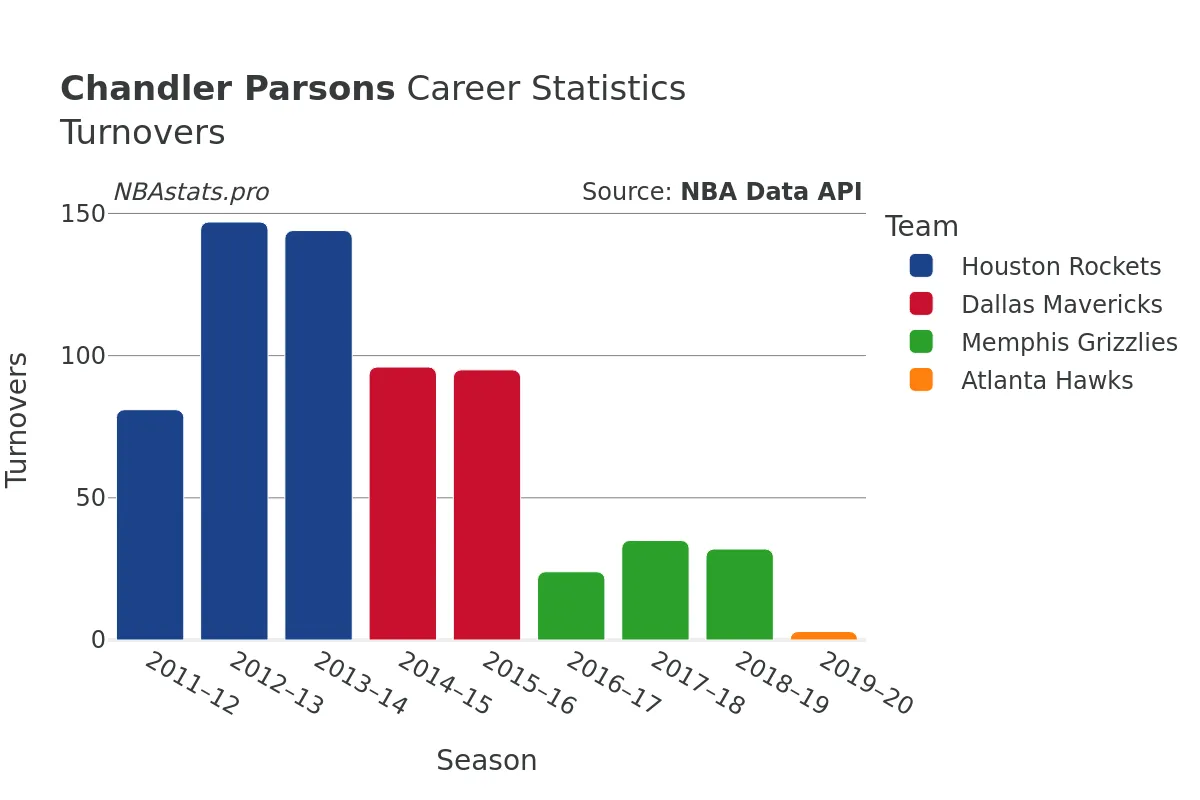
Turnovers
Blocks
Chandler Parsons Career Stats Table
| SEASON | TEAM | AGE | GP | GS | MIN | FGM | FGA | FG % | FG3M | FG3A | FG3 % | FTM | FTA | FT % | OREB | DREB | REB | AST | STL | BLK | TOV | PF | PTS | |
|---|---|---|---|---|---|---|---|---|---|---|---|---|---|---|---|---|---|---|---|---|---|---|---|---|
| 1 | 2011-12 | HOU | 23 | 63 | 57 | 1,804 | 248 | 549 | 45.2% | 60 | 178 | 33.7% | 43 | 78 | 55.1% | 90 | 210 | 300 | 134 | 73 | 29 | 81 | 142 | 599 |
| 2 | 2012-13 | HOU | 24 | 76 | 76 | 2,758 | 456 | 939 | 48.6% | 152 | 395 | 38.5% | 113 | 155 | 72.9% | 79 | 325 | 404 | 269 | 75 | 32 | 147 | 148 | 1,177 |
| 3 | 2013-14 | HOU | 25 | 74 | 74 | 2,783 | 466 | 987 | 47.2% | 130 | 351 | 37.0% | 164 | 221 | 74.2% | 69 | 340 | 409 | 298 | 88 | 29 | 144 | 168 | 1,226 |
| 4 | 2014-15 | DAL | 26 | 66 | 66 | 2,186 | 383 | 829 | 46.2% | 132 | 347 | 38.0% | 139 | 193 | 72.0% | 64 | 259 | 323 | 161 | 69 | 19 | 96 | 140 | 1,037 |
| 5 | 2015-16 | DAL | 27 | 61 | 51 | 1,799 | 320 | 651 | 49.2% | 104 | 251 | 41.4% | 93 | 136 | 68.4% | 29 | 256 | 285 | 169 | 46 | 21 | 95 | 114 | 837 |
| 6 | 2016-17 | MEM | 28 | 34 | 34 | 675 | 75 | 222 | 33.8% | 25 | 93 | 26.9% | 35 | 43 | 81.4% | 6 | 78 | 84 | 55 | 20 | 5 | 24 | 52 | 210 |
| 7 | 2017-18 | MEM | 29 | 36 | 8 | 691 | 108 | 234 | 46.2% | 51 | 121 | 42.1% | 17 | 27 | 63.0% | 14 | 76 | 90 | 69 | 18 | 11 | 35 | 53 | 284 |
| 8 | 2018-19 | MEM | 30 | 25 | 3 | 496 | 68 | 182 | 37.4% | 29 | 94 | 30.9% | 22 | 25 | 88.0% | 4 | 66 | 70 | 43 | 19 | 5 | 32 | 45 | 187 |
| 9 | 2019-20 | ATL | 31 | 5 | 0 | 54 | 5 | 18 | 27.8% | 4 | 14 | 28.6% | 0 | 0 | 0.0% | 1 | 6 | 7 | 3 | 4 | 1 | 3 | 3 | 14 |
Max Min
NBA Alltime Leaders
Games Played
Robert Parish: 1,611Kareem Abdul-Jabbar: 1,560
Vince Carter: 1,541
Dirk Nowitzki: 1,522
John Stockton: 1,504
Points
LeBron James: 40,474Kareem Abdul-Jabbar: 38,387
Karl Malone: 36,928
Kobe Bryant: 33,643
Michael Jordan: 32,292
Steals
John Stockton: 3,265Jason Kidd: 2,684
Chris Paul: 2,614
Michael Jordan: 2,514
Gary Payton: 2,445
Free Throws Made
Karl Malone: 9,787Moses Malone: 8,531
LeBron James: 8,390
Kobe Bryant: 8,378
Oscar Robertson: 7,694