Bruce Bowen Stats: NBA Career

Bruce Bowen, the defensive specialist and sharpshooter known for his tenacious play on the court, left a lasting impact on the NBA during his time in the league. A veteran of multiple teams including the Miami Heat, Boston Celtics, Philadelphia 76ers, and primarily the San Antonio Spurs, Bowen's defensive prowess and reliability made him an invaluable asset to any team he played for.
During his active years in the NBA from the 1996-97 season to the 2008-09 season, Bowen's defensive skills were ...unmatched. Standing at 6 feet 7 inches, he used his length and agility to harass opponents and shut down some of the league's most potent scorers. His defensive presence was felt in every game he played, earning him a reputation as one of the toughest defenders in the league.
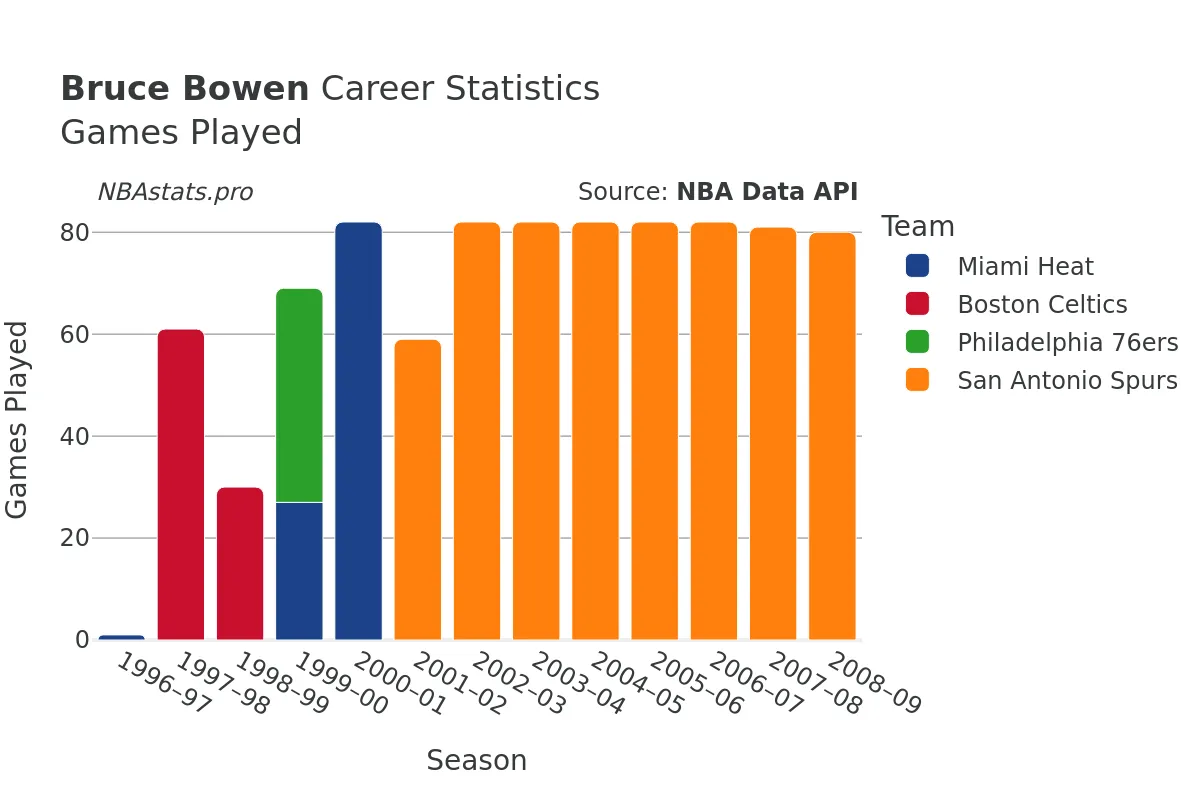
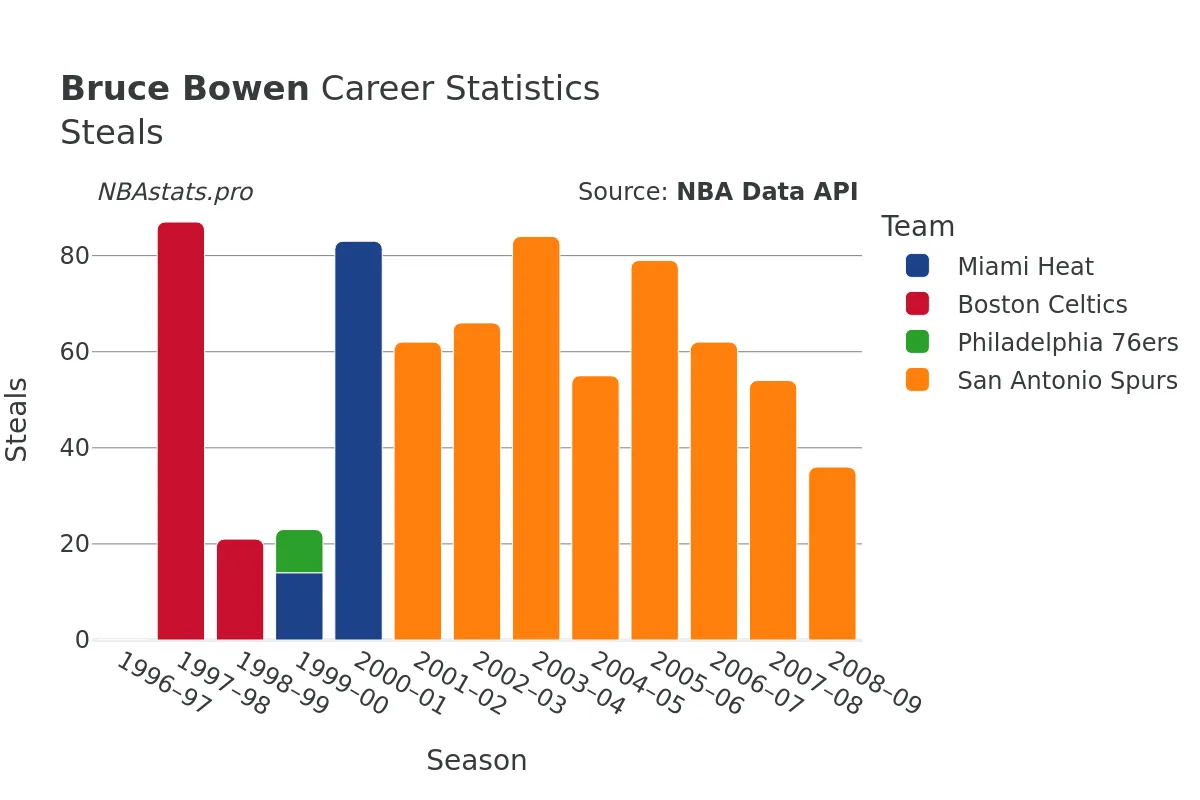
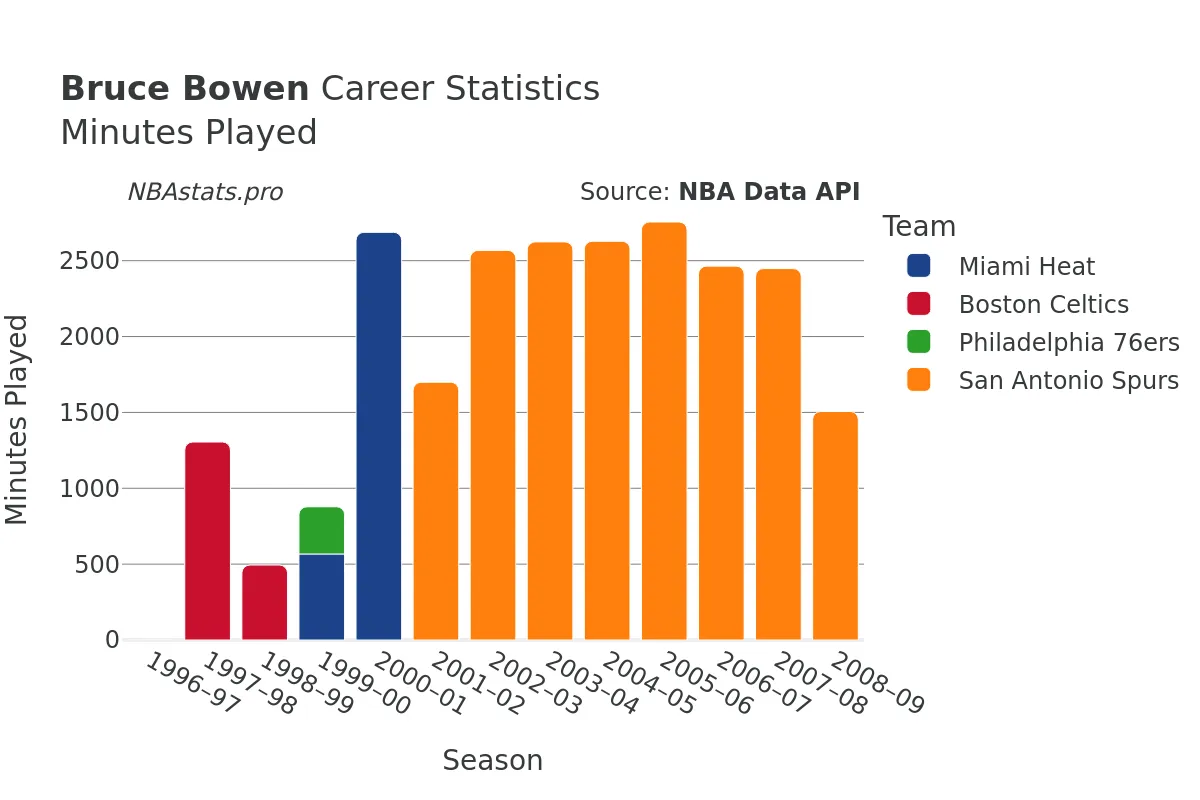
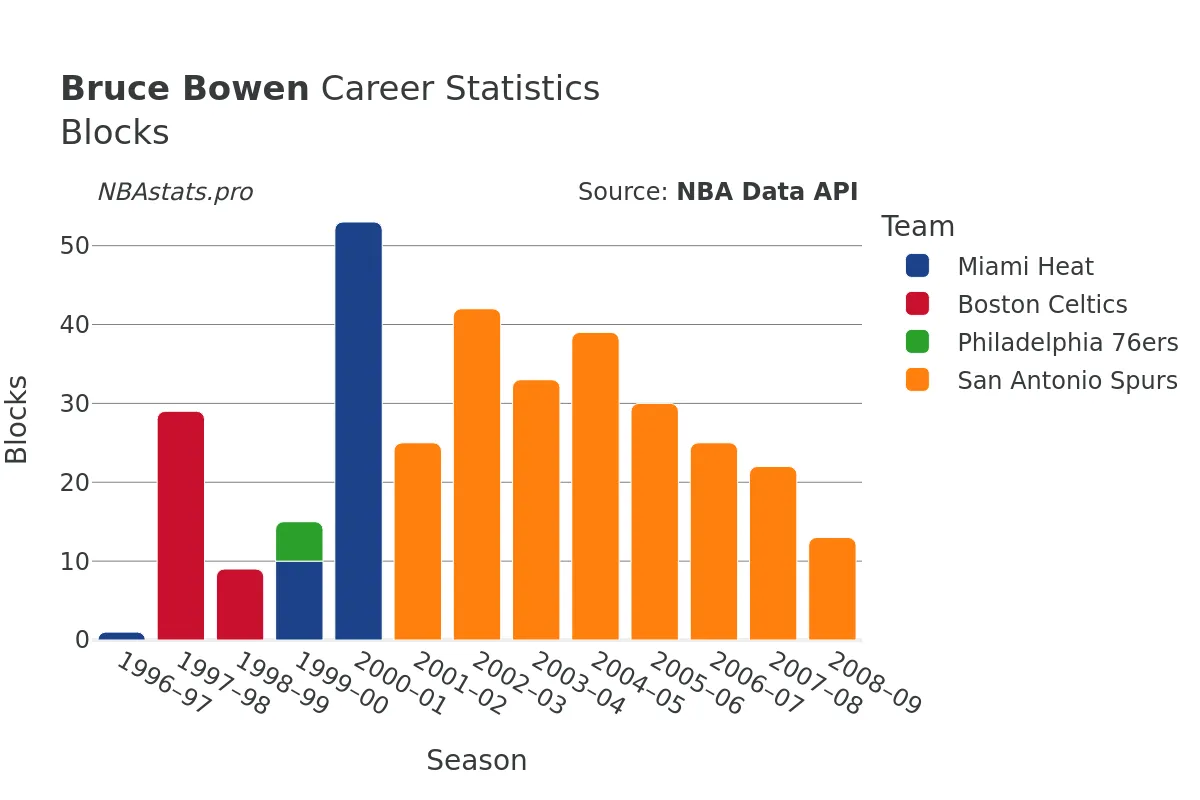
Bowen's stat line speaks volumes about his impact on the court. Over the course of his career, he played a total of 942 games, accumulating an impressive 24935 minutes of playing time. His defensive tenacity is further highlighted by his 735 steals and 351 blocks, showcasing his ability to disrupt plays and protect the rim when needed.
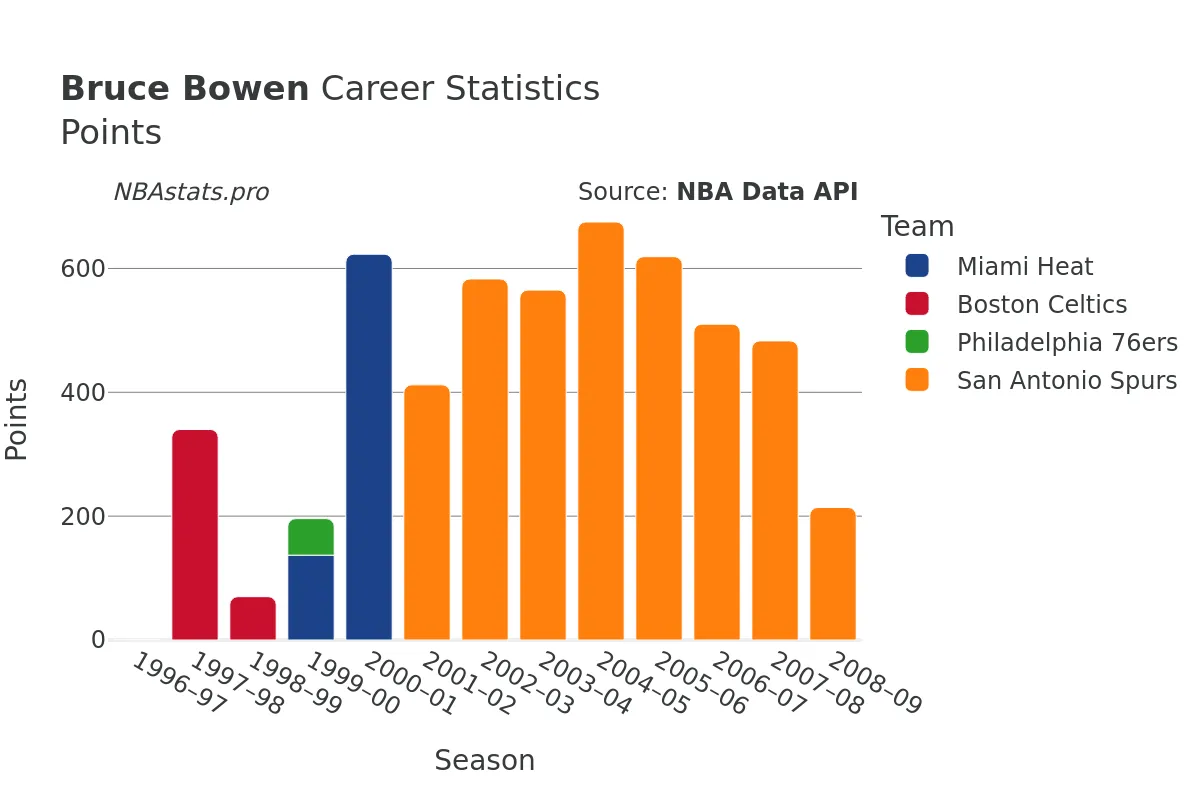
Offensively, Bowen was not just a one-dimensional player. While he was primarily known for his defensive skills, he also contributed significantly on the offensive end. With 4955 goals attempted and 2017 goals made, Bowen had a shooting percentage of 40.71%, showing his efficiency when it came to scoring. Additionally, his free throw percentage was solid, making 607 out of 1056 attempts with a 57.41% success rate from the charity stripe.
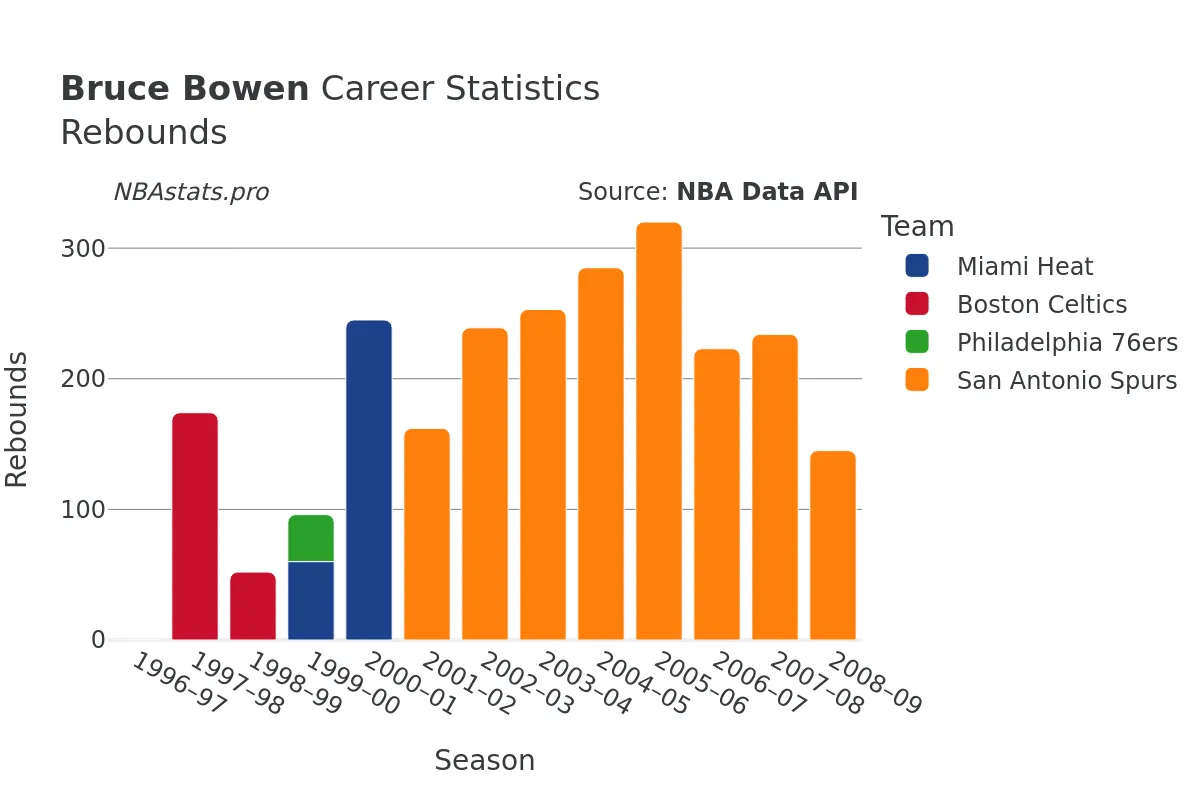
Rebounding was another area where Bowen excelled, pulling down a total of 2524 rebounds during his career. His ability to secure possessions for his team, whether it be on the defensive glass (2028 rebounds) or the offensive glass (496 rebounds), was instrumental in creating second-chance opportunities and limiting opponents' scoring chances.
In addition to his individual accomplishments, Bowen was a key contributor to team success wherever he went. His stints with multiple teams allowed him to showcase his skills and adapt to various playing styles, proving his versatility and basketball IQ on the court. Bowen's leadership and work ethic set a standard for his teammates, serving as a role model for young players looking to make an impact in the league.
As a basketball player analyst, delving into Bruce Bowen's career statistics provides a fascinating insight into the mind of a defensive maestro and team player. His numbers tell the story of a player who left everything on the court, from his relentless defensive pressure to his consistent scoring and rebounding contributions. Bowen's legacy as a defensive stopper and reliable scorer lives on in the annals of NBA history, reminding us of the impact a dedicated and hardworking player can have on a team's success.
Read more
Games Played
Points
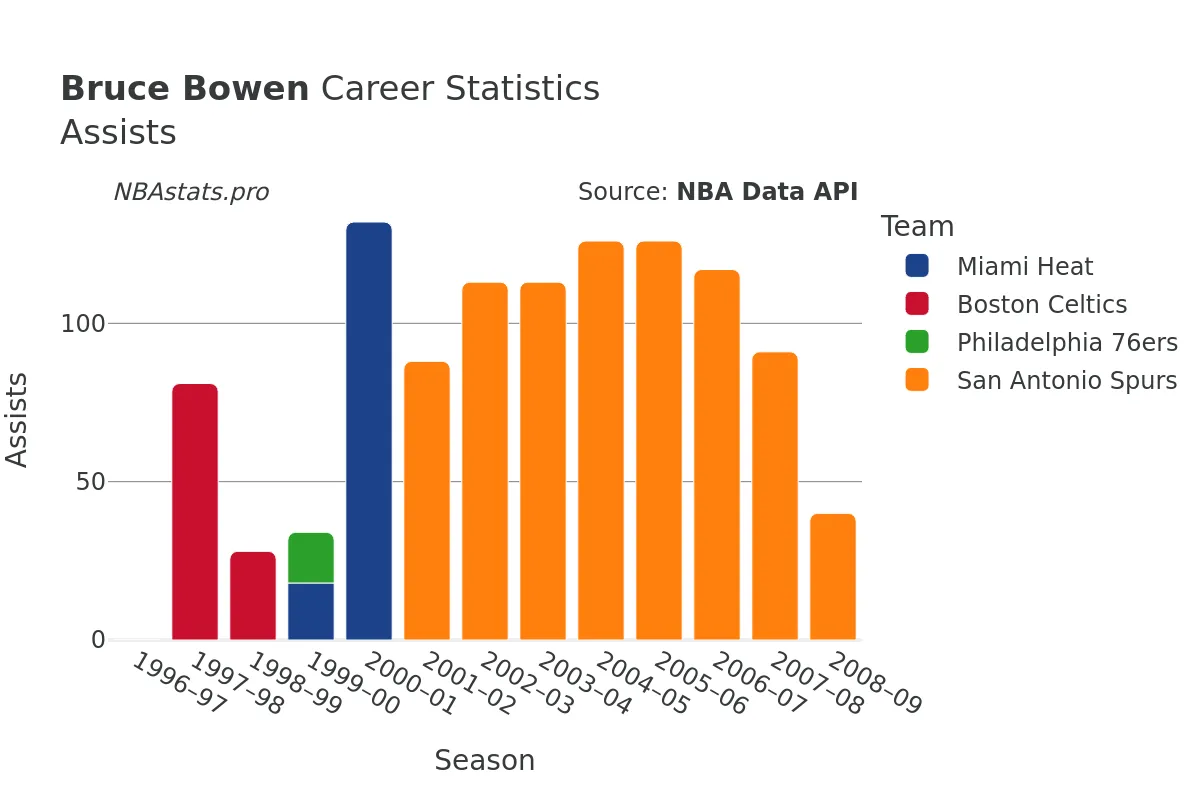
Assists
Rebounds
Steals
Minutes Played
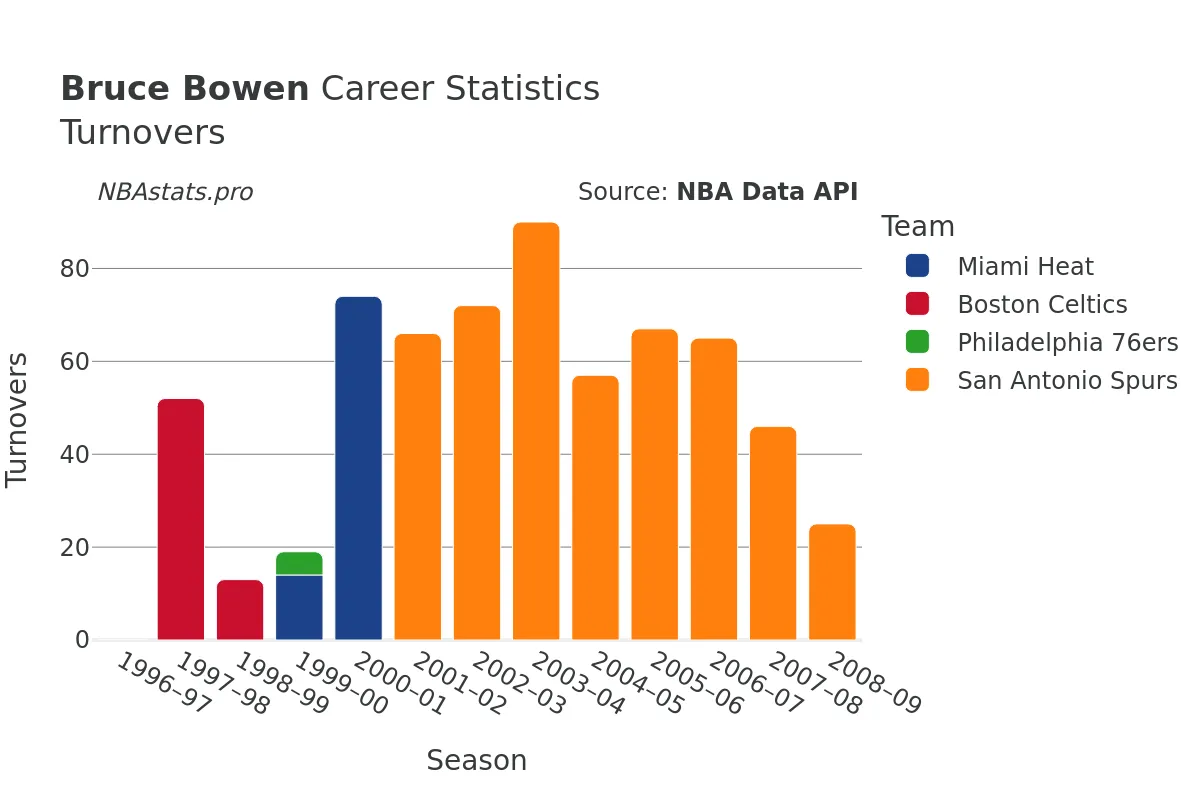
Turnovers
Blocks
Bruce Bowen Career Stats Table
| SEASON | TEAM | AGE | GP | GS | MIN | FGM | FGA | FG % | FG3M | FG3A | FG3 % | FTM | FTA | FT % | OREB | DREB | REB | AST | STL | BLK | TOV | PF | PTS | |
|---|---|---|---|---|---|---|---|---|---|---|---|---|---|---|---|---|---|---|---|---|---|---|---|---|
| 1 | 1996-97 | MIA | 26 | 1 | 0 | 1 | 0 | 0 | 0.0% | 0 | 0 | 0.0% | 0 | 0 | 0.0% | 0 | 0 | 0 | 0 | 0 | 1 | 0 | 0 | 0 |
| 2 | 1997-98 | BOS | 27 | 61 | 9 | 1,305 | 122 | 298 | 40.9% | 20 | 59 | 33.9% | 76 | 122 | 62.3% | 79 | 95 | 174 | 81 | 87 | 29 | 52 | 174 | 340 |
| 3 | 1998-99 | BOS | 28 | 30 | 1 | 494 | 26 | 93 | 28.0% | 7 | 26 | 26.9% | 11 | 24 | 45.8% | 15 | 37 | 52 | 28 | 21 | 9 | 13 | 51 | 70 |
| 4 | 1999-00 | PHI | 29 | 42 | 0 | 311 | 26 | 73 | 35.6% | 1 | 2 | 50.0% | 6 | 12 | 50.0% | 14 | 22 | 36 | 16 | 9 | 5 | 5 | 37 | 59 |
| 5 | 1999-00 | MIA | 29 | 27 | 2 | 567 | 46 | 121 | 38.0% | 26 | 56 | 46.4% | 19 | 31 | 61.3% | 13 | 47 | 60 | 18 | 14 | 10 | 14 | 81 | 137 |
| 6 | 1999-00 | TOT | 29 | 69 | 2 | 878 | 72 | 194 | 37.1% | 27 | 58 | 46.6% | 25 | 43 | 58.1% | 27 | 69 | 96 | 34 | 23 | 15 | 19 | 118 | 196 |
| 7 | 2000-01 | MIA | 30 | 82 | 72 | 2,687 | 211 | 581 | 36.3% | 103 | 307 | 33.6% | 98 | 161 | 60.9% | 45 | 200 | 245 | 132 | 83 | 53 | 74 | 269 | 623 |
| 8 | 2001-02 | SAS | 31 | 59 | 59 | 1,699 | 155 | 398 | 38.9% | 56 | 148 | 37.8% | 46 | 96 | 47.9% | 42 | 120 | 162 | 88 | 62 | 25 | 66 | 116 | 412 |
| 9 | 2002-03 | SAS | 32 | 82 | 82 | 2,568 | 223 | 479 | 46.6% | 101 | 229 | 44.1% | 36 | 89 | 40.4% | 59 | 180 | 239 | 113 | 66 | 42 | 72 | 195 | 583 |
| 10 | 2003-04 | SAS | 33 | 82 | 82 | 2,624 | 211 | 502 | 42.0% | 77 | 212 | 36.3% | 66 | 114 | 57.9% | 45 | 208 | 253 | 113 | 84 | 33 | 90 | 166 | 565 |
| 11 | 2004-05 | SAS | 34 | 82 | 82 | 2,628 | 251 | 598 | 42.0% | 102 | 253 | 40.3% | 71 | 112 | 63.4% | 50 | 235 | 285 | 126 | 55 | 39 | 57 | 175 | 675 |
| 12 | 2005-06 | SAS | 35 | 82 | 82 | 2,755 | 232 | 536 | 43.3% | 104 | 245 | 42.4% | 51 | 84 | 60.7% | 35 | 285 | 320 | 126 | 79 | 30 | 67 | 191 | 619 |
| 13 | 2006-07 | SAS | 36 | 82 | 82 | 2,464 | 189 | 467 | 40.5% | 89 | 232 | 38.4% | 43 | 73 | 58.9% | 23 | 200 | 223 | 117 | 62 | 25 | 65 | 175 | 510 |
| 14 | 2007-08 | SAS | 37 | 81 | 81 | 2,448 | 174 | 428 | 40.7% | 90 | 215 | 41.9% | 45 | 69 | 65.2% | 33 | 201 | 234 | 91 | 54 | 22 | 46 | 177 | 483 |
| 15 | 2008-09 | SAS | 38 | 80 | 10 | 1,506 | 79 | 187 | 42.2% | 42 | 98 | 42.9% | 14 | 26 | 53.8% | 16 | 129 | 145 | 40 | 36 | 13 | 25 | 123 | 214 |
Max Min
NBA Alltime Leaders
Games Played
Robert Parish: 1,611Kareem Abdul-Jabbar: 1,560
Vince Carter: 1,541
Dirk Nowitzki: 1,522
John Stockton: 1,504
Points
LeBron James: 40,474Kareem Abdul-Jabbar: 38,387
Karl Malone: 36,928
Kobe Bryant: 33,643
Michael Jordan: 32,292
Steals
John Stockton: 3,265Jason Kidd: 2,684
Chris Paul: 2,614
Michael Jordan: 2,514
Gary Payton: 2,445
Free Throws Made
Karl Malone: 9,787Moses Malone: 8,531
LeBron James: 8,390
Kobe Bryant: 8,378
Oscar Robertson: 7,694