Brian Roberts Stats: NBA Career

Introducing Brian Roberts: A Closer Look at the NBA Journeyman
Brian Roberts, a name that resonates with basketball enthusiasts across the nation, has left his mark on the NBA courts with his skill, tenacity, and unwavering dedication to the game. Over his five-year career, Roberts graced the rosters of three different teams – the New Orleans Pelicans, Charlotte Hornets, and Portland Trail Blazers – showcasing his versatility and adaptability in various playing environments.
The journey of Bri...an Roberts in the NBA began in the 2012-13 season when he made his debut with the New Orleans Pelicans. Hailing from the vibrant city of New Orleans, Louisiana, Roberts wasted no time in proving his worth on the court. A skilled point guard, Roberts brought his A-game night after night, enchanting fans with his sharpshooting and playmaking abilities. His journey with the Pelicans set the stage for what would be a remarkable career ahead.
As Roberts transitioned to the Charlotte Hornets, the city of Charlotte, North Carolina, welcomed him with open arms. From his start age of 27, Roberts continued to impress with his consistency and determination. His contribution to the Hornets' lineup did not go unnoticed, as he played an integral role in shaping the team's strategies and gameplay. Roberts' stats spoke volumes about his impact on the court, with his scoring, assists, and defensive prowess shining through each game.
The final chapter of Roberts' NBA career saw him donning the jersey of the Portland Trail Blazers, representing the spirited city of Portland, Oregon. Despite the geographical shift, Roberts seamlessly adjusted to the team dynamics, proving his adaptability and professionalism once again. His veteran presence brought a sense of stability to the Trail Blazers, as he mentored younger players and led by example with his work ethic and passion for the game.
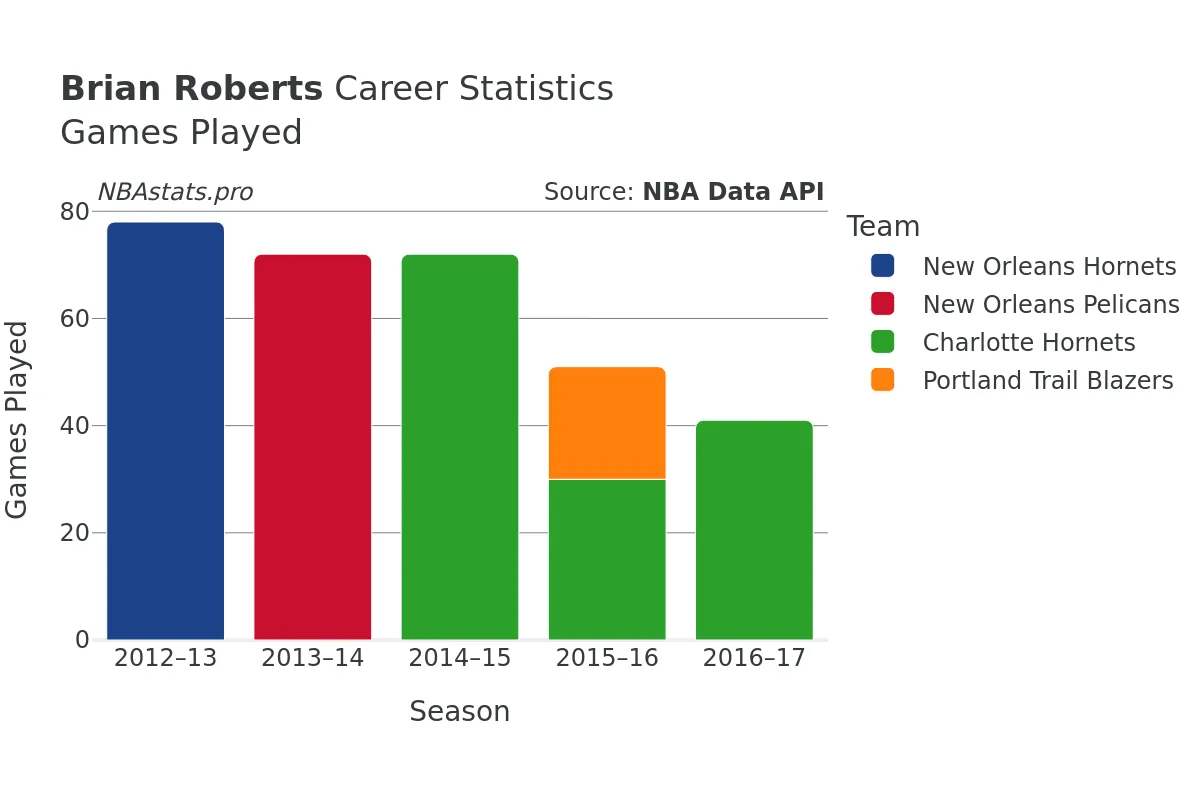
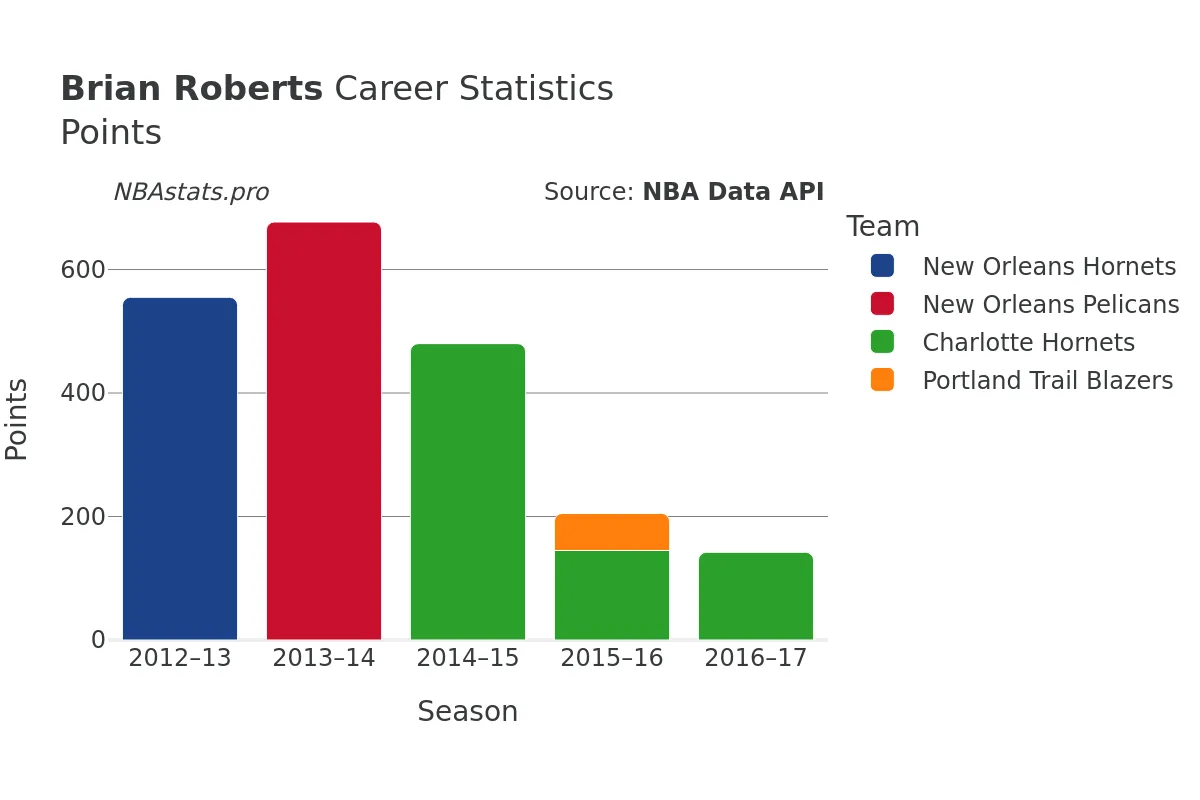
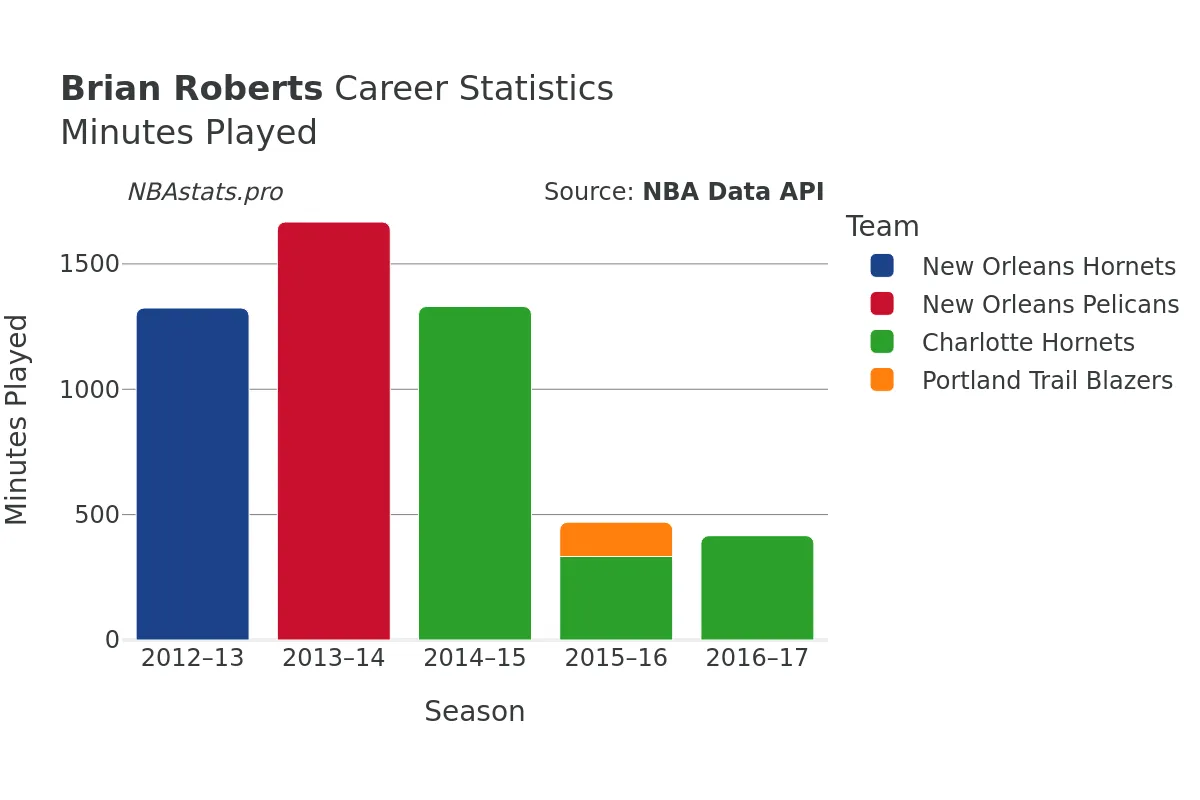
Looking beyond the team affiliations, Roberts' stats paint a vivid picture of his skills and contributions on the court. Over the course of 365 games played and 5677 minutes on the hardwood, Roberts showcased his scoring prowess with 827 field goals made out of 1996 attempts, boasting an impressive shooting percentage of 41%. His accuracy extended to the free-throw line, where he exhibited nerves of steel with a free-throw percentage that validated his clutch performances in crucial moments.
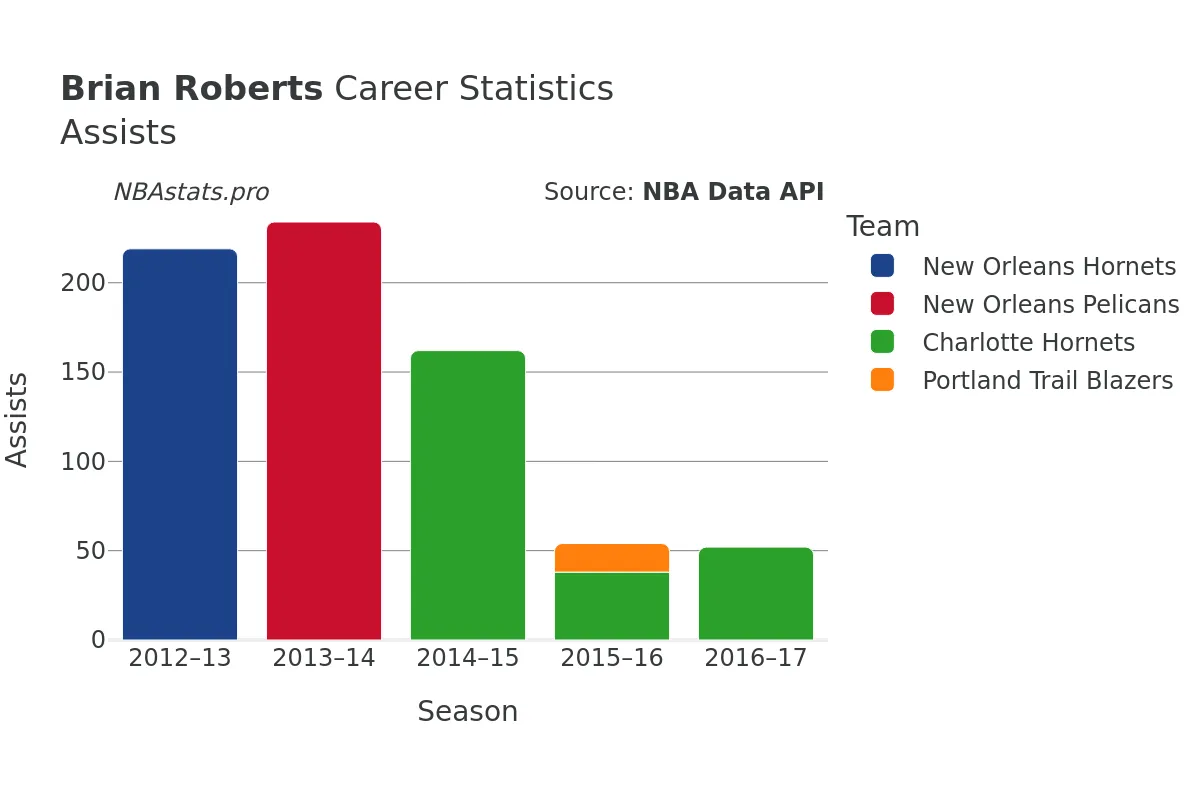
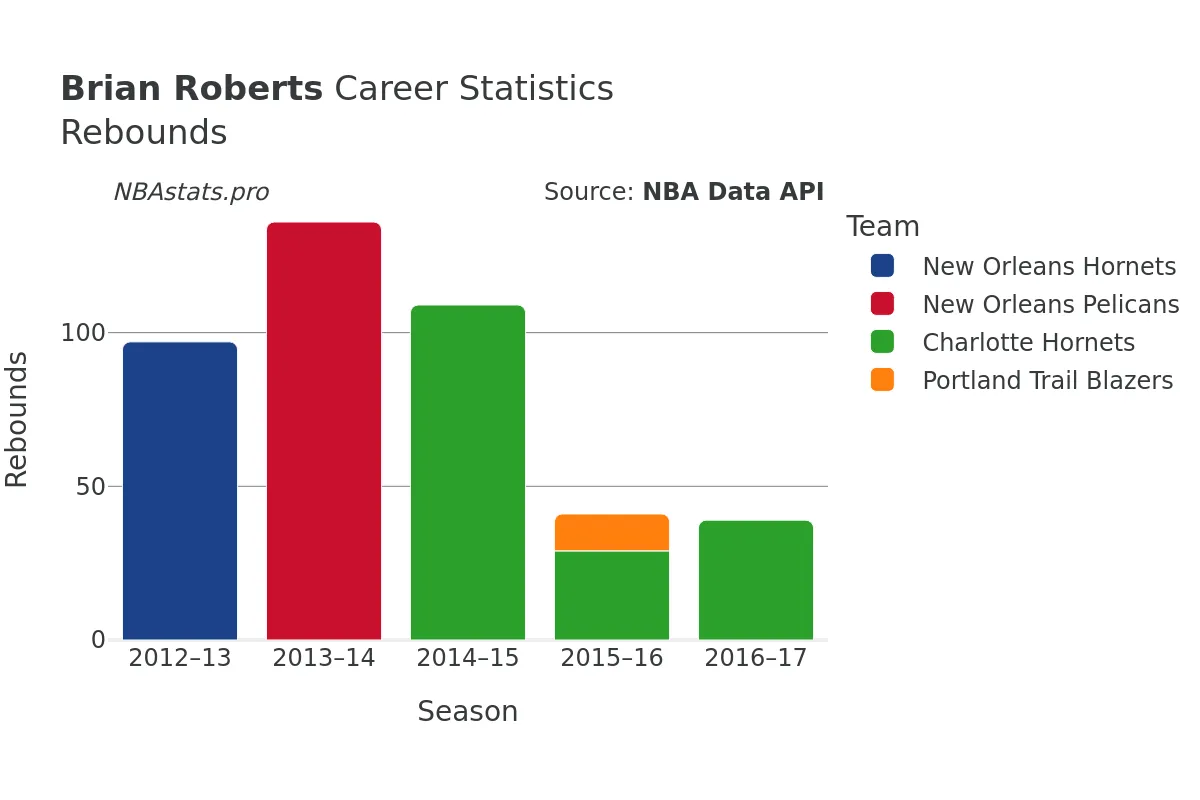
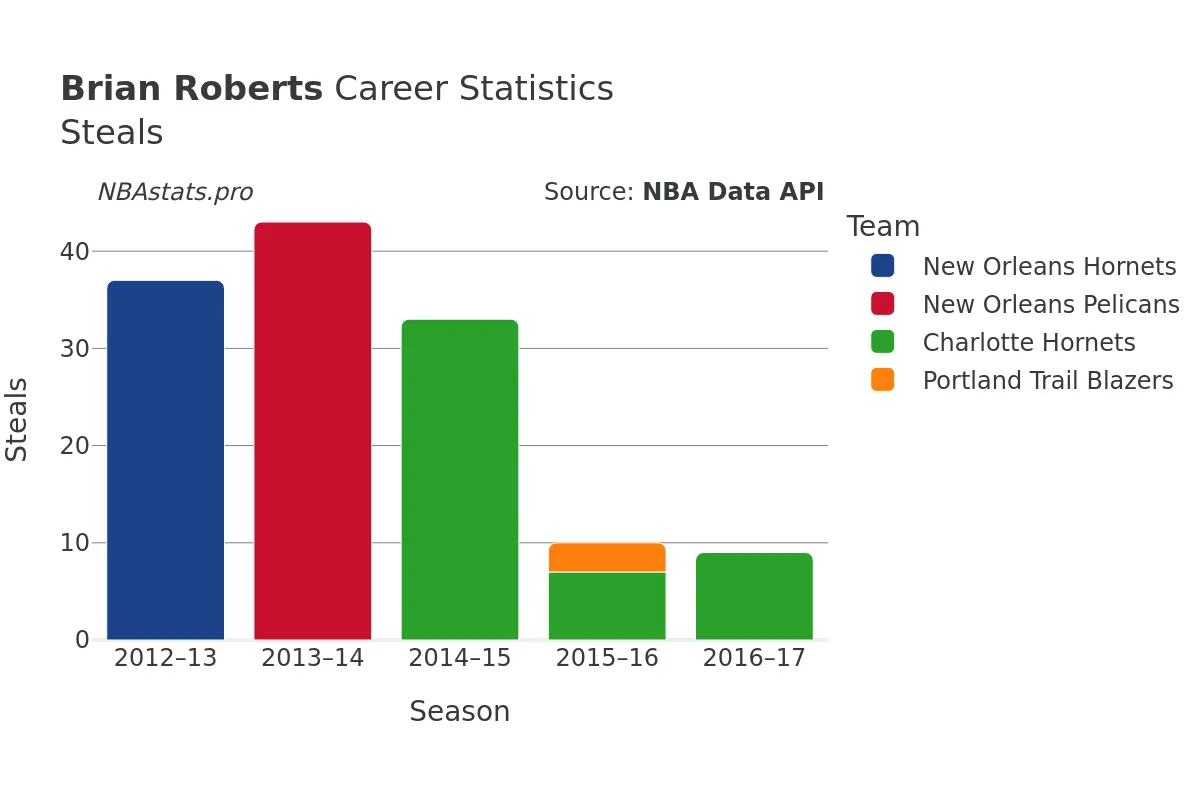
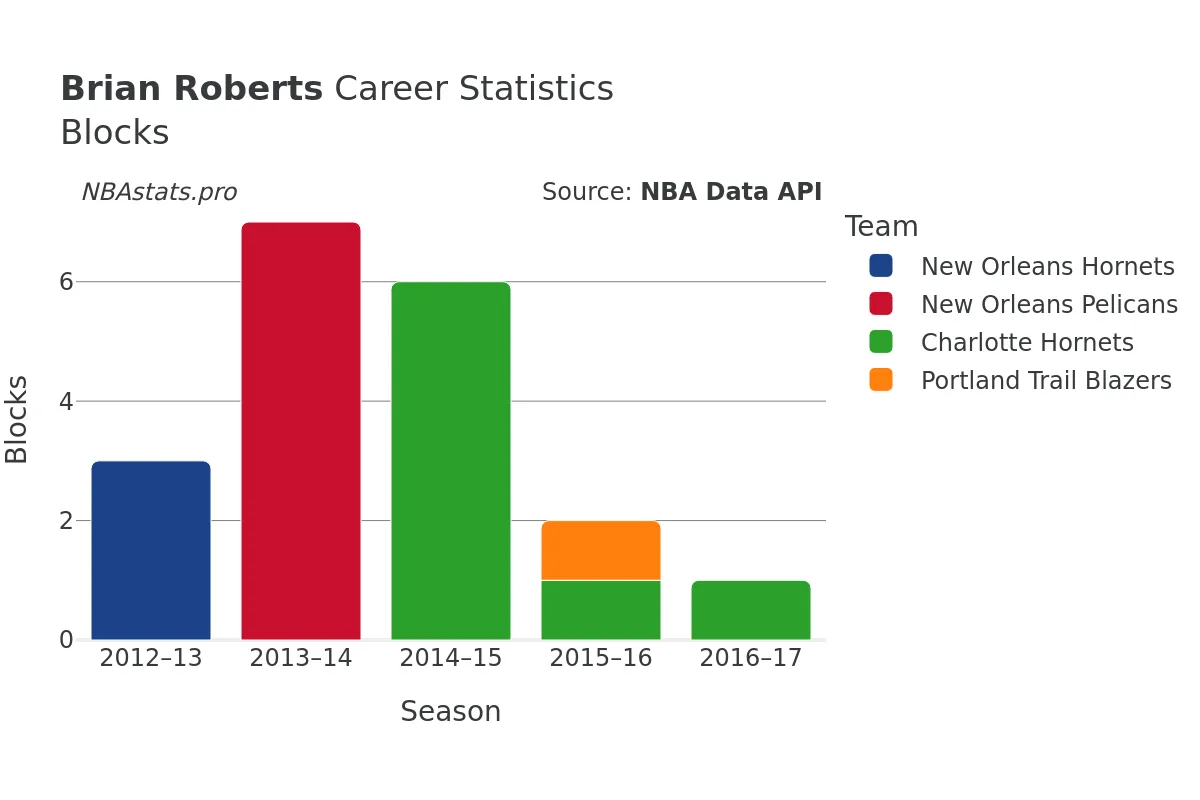
Roberts was not just a scoring machine; he was a well-rounded player who made his presence felt in multiple facets of the game. His 463 total rebounds, including 399 defensive rebounds and 64 offensive rebounds, underscored his commitment to both ends of the court. Additionally, his 775 assists, 142 steals, and 21 blocks highlighted his playmaking abilities, defensive instincts, and shot-blocking prowess, solidifying his reputation as a versatile guard capable of impacting the game in myriad ways.
At the core of Roberts' NBA journey lies a passion for the game, a relentless drive to improve, and a competitive spirit that fueled his every move on the court. While his active playing days may have come to a close, the legacy of Brian Roberts as a dedicated and skilled basketball player endures, inspiring current and future generations of athletes to strive for greatness and leave an indelible mark in the world of sports.
For a deeper dive into the fascinating career of Brian Roberts, explore the charts and stats on this page, and unravel the intricacies of a player whose impact reverberates far beyond the three-point line.
Read more
Games Played
Points
Assists
Rebounds
Steals
Minutes Played
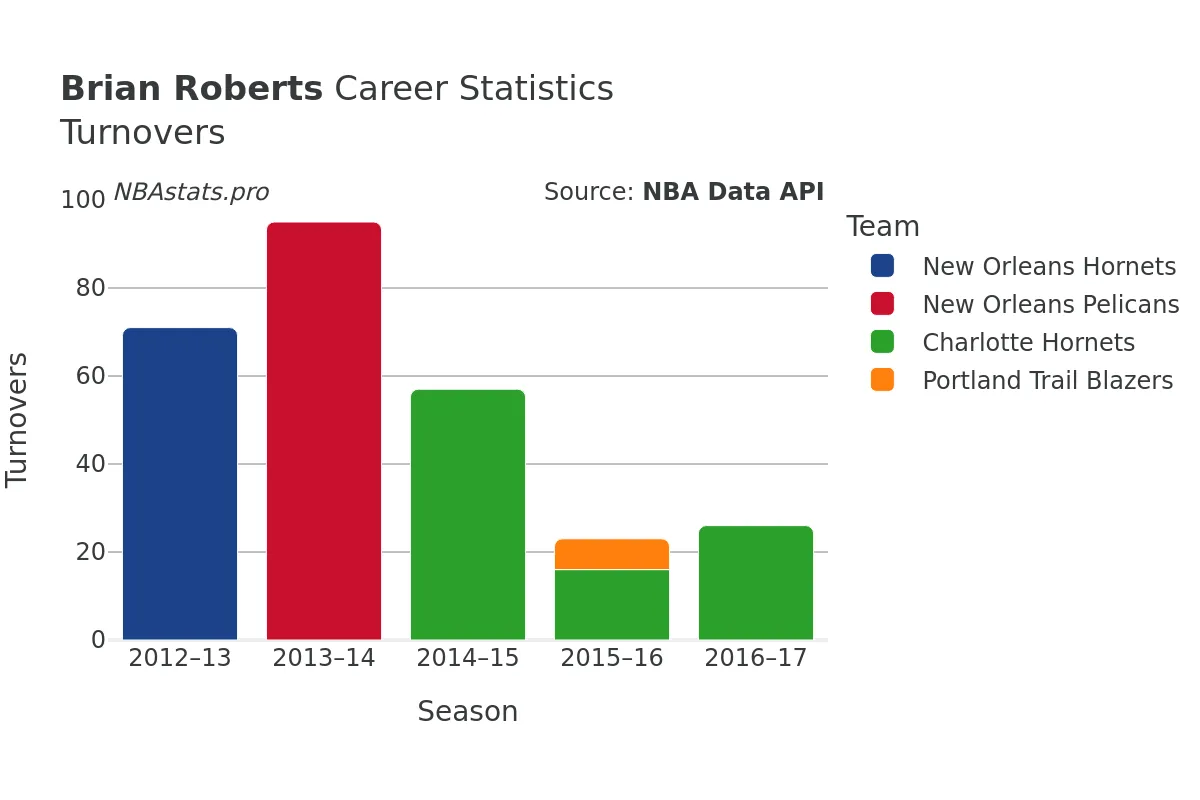
Turnovers
Blocks
Brian Roberts Career Stats Table
| SEASON | TEAM | AGE | GP | GS | MIN | FGM | FGA | FG % | FG3M | FG3A | FG3 % | FTM | FTA | FT % | OREB | DREB | REB | AST | STL | BLK | TOV | PF | PTS | |
|---|---|---|---|---|---|---|---|---|---|---|---|---|---|---|---|---|---|---|---|---|---|---|---|---|
| 1 | 2012-13 | NOH | 27 | 78 | 5 | 1,324 | 213 | 511 | 41.7% | 59 | 153 | 38.6% | 70 | 77 | 90.9% | 17 | 80 | 97 | 219 | 37 | 3 | 71 | 108 | 555 |
| 2 | 2013-14 | NOP | 28 | 72 | 42 | 1,667 | 244 | 581 | 42.0% | 64 | 178 | 36.0% | 125 | 133 | 94.0% | 17 | 119 | 136 | 234 | 43 | 7 | 95 | 132 | 677 |
| 3 | 2014-15 | CHA | 29 | 72 | 10 | 1,330 | 176 | 452 | 38.9% | 62 | 193 | 32.1% | 66 | 74 | 89.2% | 13 | 96 | 109 | 162 | 33 | 6 | 57 | 75 | 480 |
| 4 | 2015-16 | CHA | 30 | 30 | 0 | 333 | 51 | 115 | 44.3% | 9 | 27 | 33.3% | 34 | 37 | 91.9% | 4 | 25 | 29 | 38 | 7 | 1 | 16 | 23 | 145 |
| 5 | 2015-16 | POR | 30 | 21 | 0 | 137 | 23 | 50 | 46.0% | 6 | 15 | 40.0% | 8 | 10 | 80.0% | 2 | 10 | 12 | 16 | 3 | 1 | 7 | 12 | 60 |
| 6 | 2015-16 | TOT | 30 | 51 | 0 | 470 | 74 | 165 | 44.8% | 15 | 42 | 35.7% | 42 | 47 | 89.4% | 6 | 35 | 41 | 54 | 10 | 2 | 23 | 35 | 205 |
| 7 | 2016-17 | CHA | 31 | 41 | 2 | 416 | 46 | 122 | 37.7% | 17 | 44 | 38.6% | 33 | 39 | 84.6% | 5 | 34 | 39 | 52 | 9 | 1 | 26 | 18 | 142 |
Max Min
NBA Alltime Leaders
Games Played
Robert Parish: 1,611Kareem Abdul-Jabbar: 1,560
Vince Carter: 1,541
Dirk Nowitzki: 1,522
John Stockton: 1,504
Points
LeBron James: 40,474Kareem Abdul-Jabbar: 38,387
Karl Malone: 36,928
Kobe Bryant: 33,643
Michael Jordan: 32,292
Steals
John Stockton: 3,265Jason Kidd: 2,684
Chris Paul: 2,614
Michael Jordan: 2,514
Gary Payton: 2,445
Free Throws Made
Karl Malone: 9,787Moses Malone: 8,531
LeBron James: 8,390
Kobe Bryant: 8,378
Oscar Robertson: 7,694