Brian Cook Stats: NBA Career

Brian Cook, a prolific forward in the NBA, made a significant impact during his tenure with various teams such as the Los Angeles Lakers, Orlando Magic, Houston Rockets, Los Angeles Clippers, and Washington Wizards. As we delve into the statistics of his impressive career, it becomes evident why he was a formidable player on the court.
Cook's journey in the NBA began during the 2003-04 season as a 23-year-old athlete ready to showcase his skills. Over the years, he proved to be a valuable asset... to every team he played for, demonstrating his versatility and proficiency in the game.
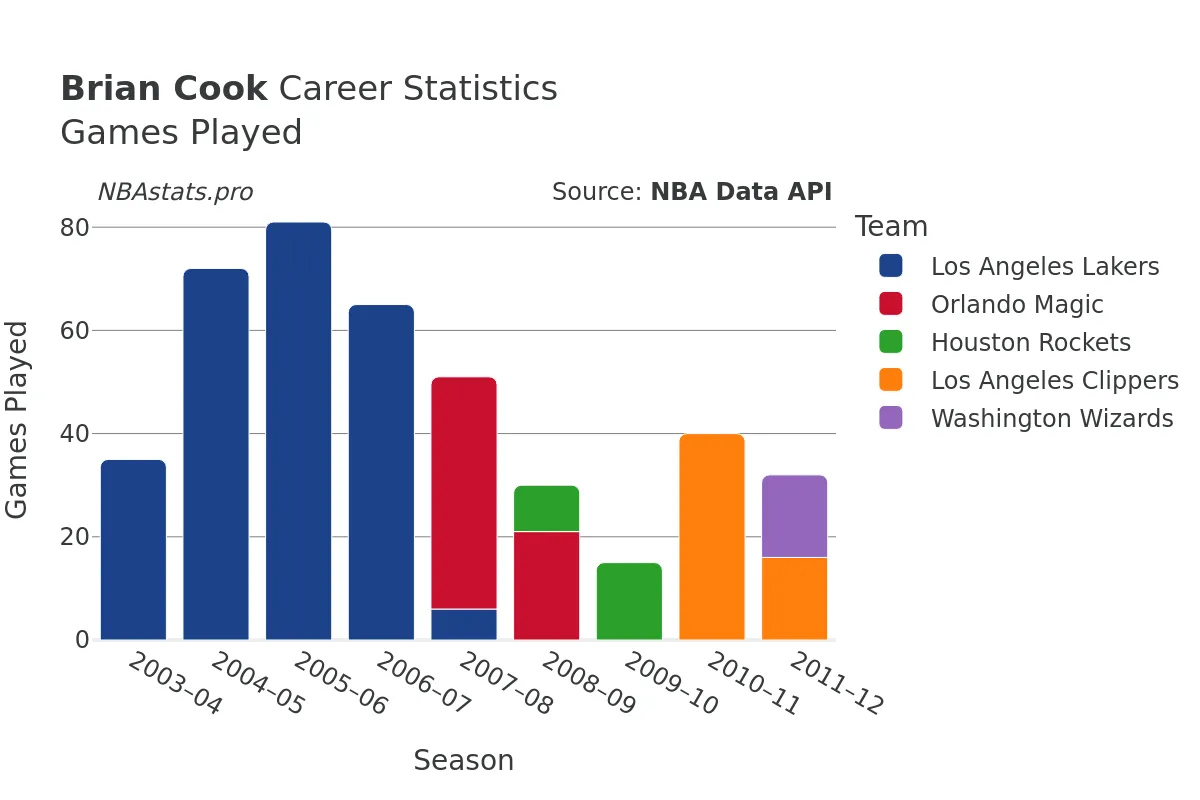
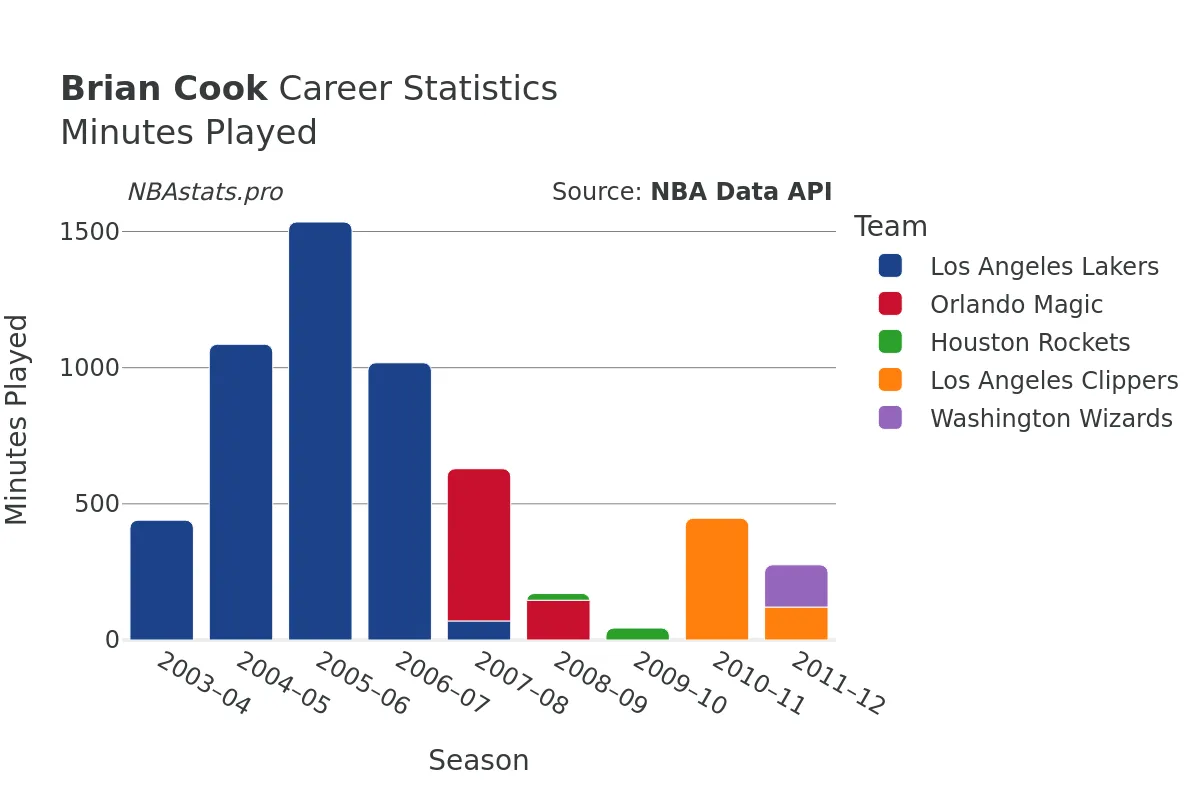
Throughout his career, spanning from 2003 to 2012, Brian played a total of 534 games, accumulating over 6722 minutes on the court. His dedication and commitment to the sport were evident in his performance, as reflected in his impressive stats.
When it comes to scoring, Cook was a reliable shooter, with a total of 1062 goals made out of 2491 attempts, boasting a shooting percentage of 42.6%. His ability to put points on the board and make crucial plays for his team made him a go-to player in clutch situations.
In addition to his scoring prowess, Brian Cook was also proficient at the free-throw line. With 253 successful free throws out of 318 attempts, he maintained an impressive free-throw percentage, showcasing his skill and composure under pressure.
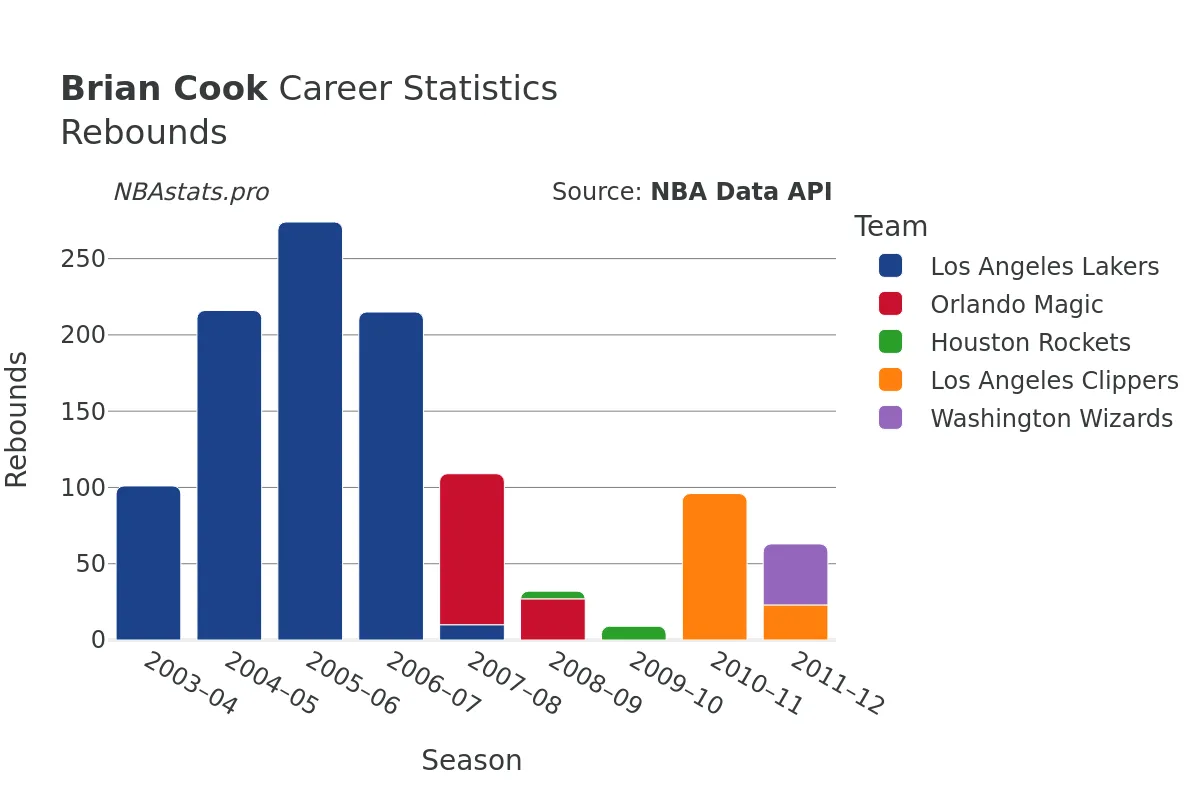
Rebounding was another area where Cook excelled, further solidifying his presence on the court. With a total of 1319 rebounds, including 966 defensive rebounds and 353 offensive rebounds, he played a vital role in controlling the boards and creating opportunities for his team.
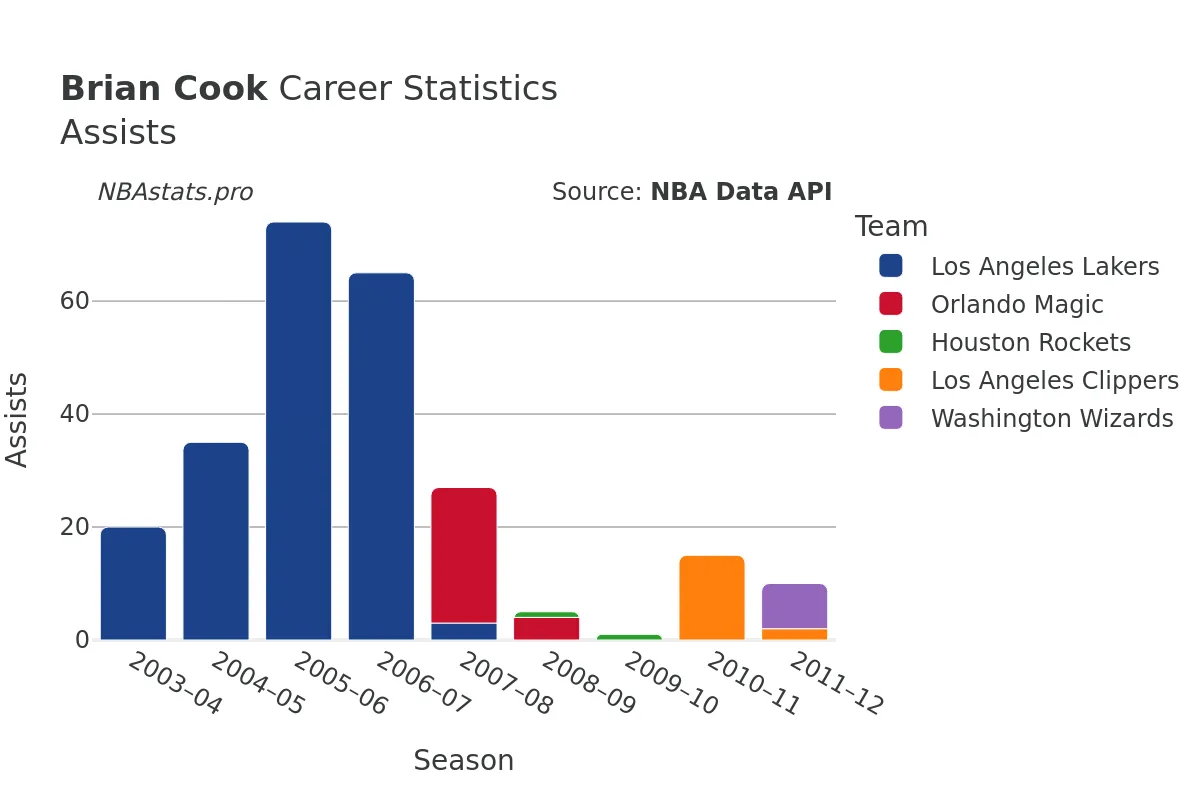
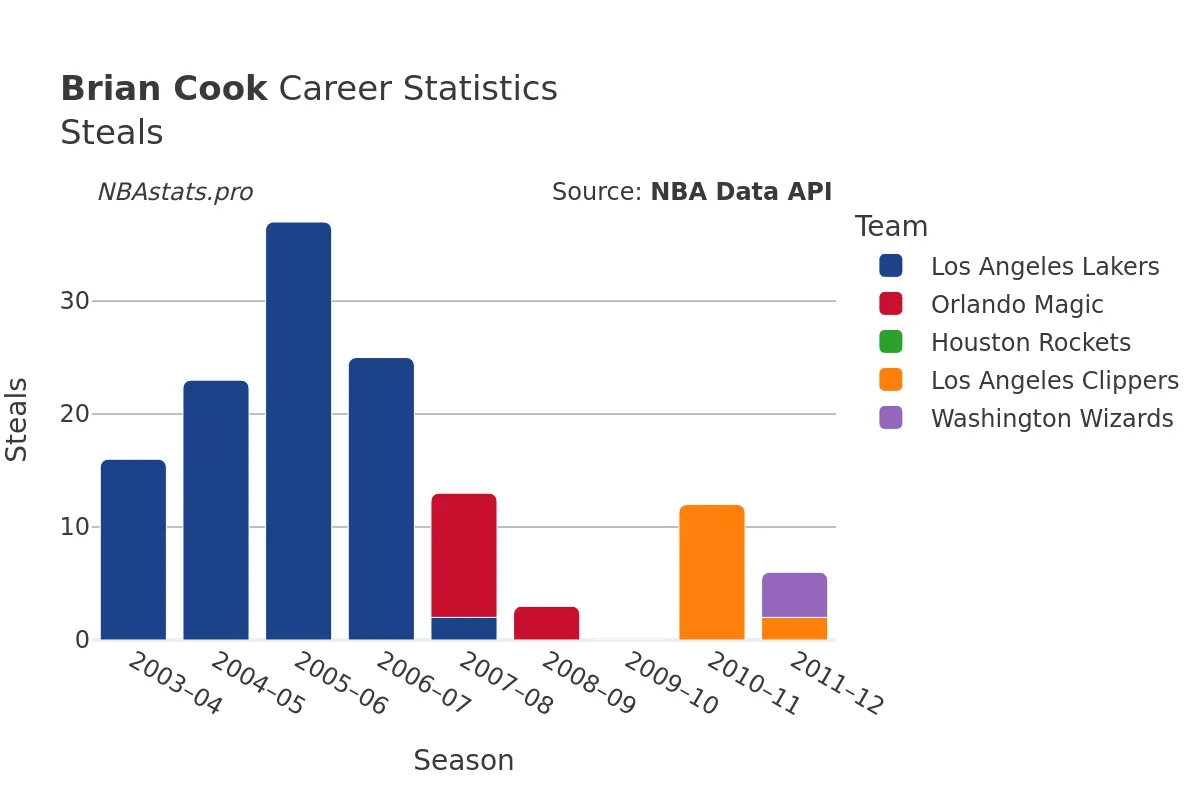
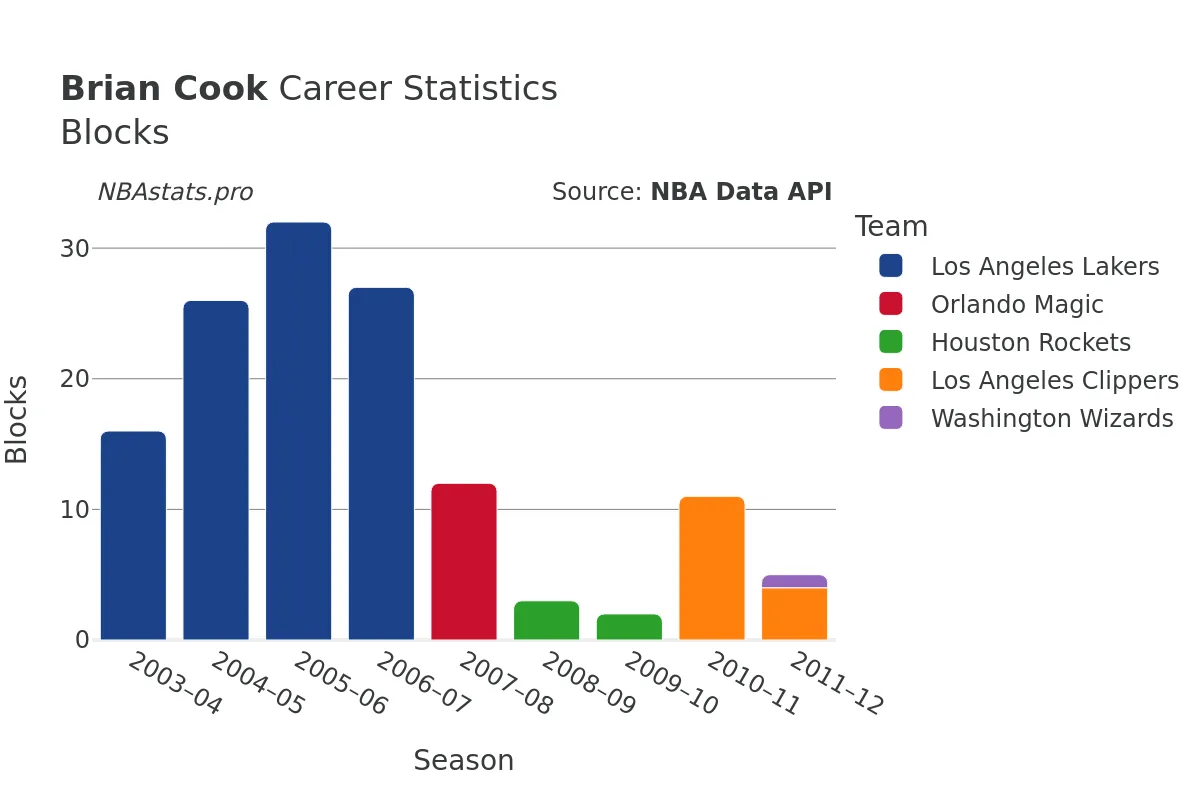
Apart from scoring and rebounding, Brian Cook also showcased his passing and defensive abilities throughout his career. With 294 assists, 157 steals, and 154 blocks to his name, he was a well-rounded player who could contribute in various facets of the game.
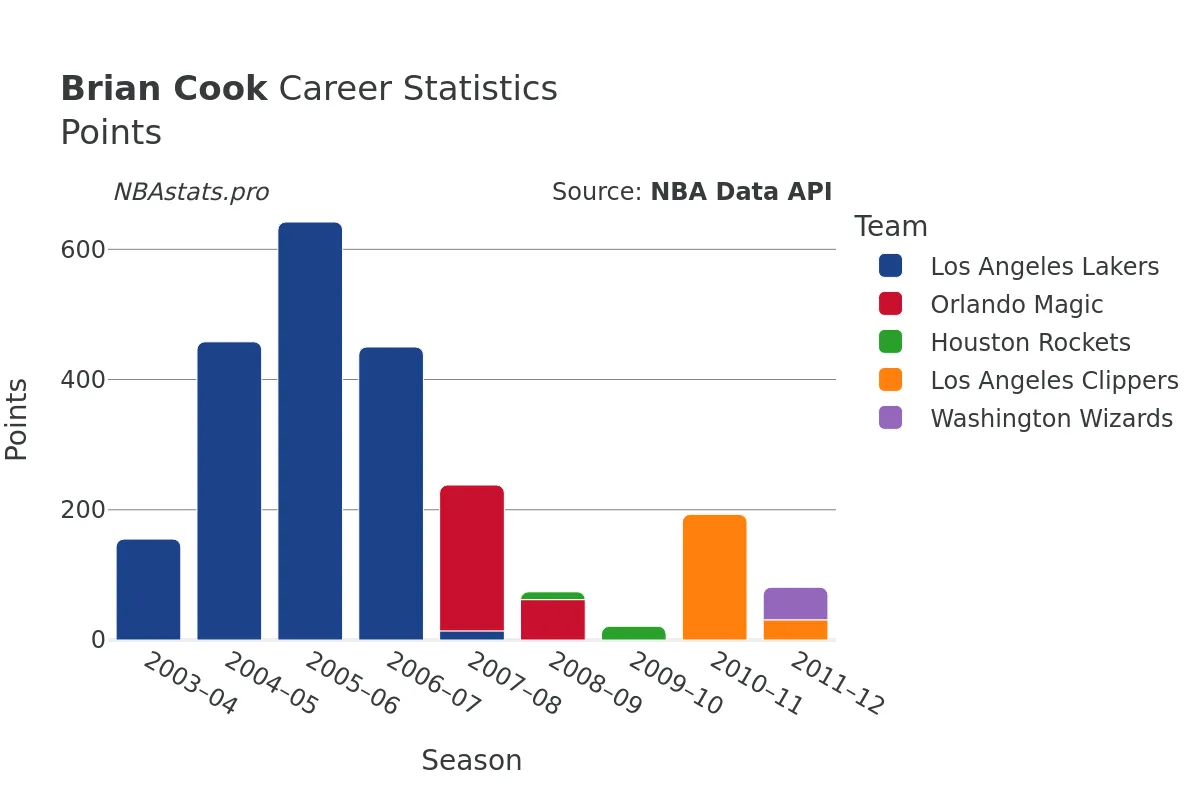
In terms of overall points scored, Cook accumulated a total of 2705 points during his time in the NBA, further emphasizing his impact as a key contributor to his teams' success.
Although Brian Cook is no longer active in the NBA, his legacy as a skilled and dedicated player lives on through his impressive career statistics. By analyzing his numbers and contributions to the game, fans and enthusiasts can gain a deeper understanding and appreciation for the talent and hard work he brought to the basketball court.
As you explore the charts and data provided on this profile page, immerse yourself in the career of Brian Cook and discover the intricacies of his playing style, achievements, and lasting impact on the sport of basketball.
Read more
Games Played
Points
Assists
Rebounds
Steals
Minutes Played
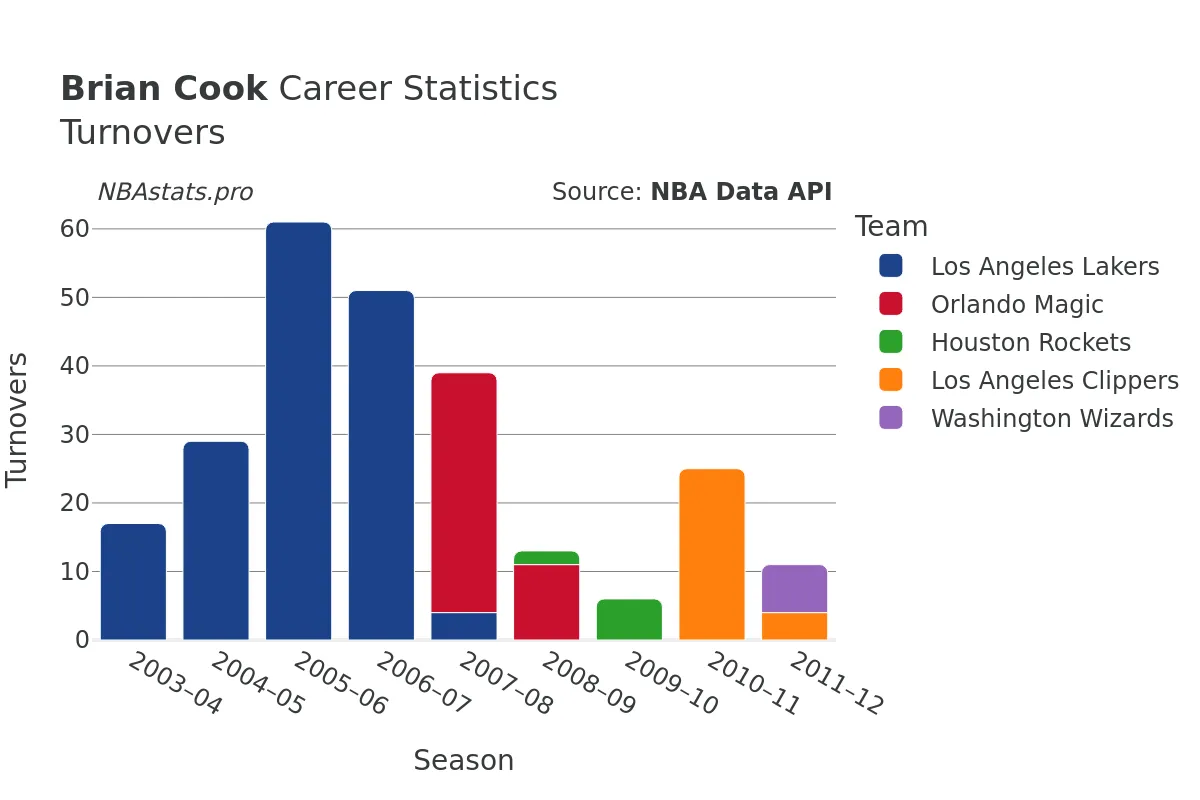
Turnovers
Blocks
Brian Cook Career Stats Table
| SEASON | TEAM | AGE | GP | GS | MIN | FGM | FGA | FG % | FG3M | FG3A | FG3 % | FTM | FTA | FT % | OREB | DREB | REB | AST | STL | BLK | TOV | PF | PTS | |
|---|---|---|---|---|---|---|---|---|---|---|---|---|---|---|---|---|---|---|---|---|---|---|---|---|
| 1 | 2003-04 | LAL | 23 | 35 | 2 | 440 | 67 | 141 | 47.5% | 0 | 5 | 0.0% | 21 | 28 | 75.0% | 31 | 70 | 101 | 20 | 16 | 16 | 17 | 64 | 155 |
| 2 | 2004-05 | LAL | 24 | 72 | 0 | 1,086 | 176 | 422 | 41.7% | 78 | 199 | 39.2% | 28 | 37 | 75.7% | 63 | 153 | 216 | 35 | 23 | 26 | 29 | 139 | 458 |
| 3 | 2005-06 | LAL | 25 | 81 | 46 | 1,535 | 261 | 511 | 51.1% | 36 | 84 | 42.9% | 84 | 101 | 83.2% | 88 | 186 | 274 | 74 | 37 | 32 | 61 | 205 | 642 |
| 4 | 2006-07 | LAL | 26 | 65 | 24 | 1,018 | 185 | 408 | 45.3% | 46 | 115 | 40.0% | 34 | 47 | 72.3% | 61 | 154 | 215 | 65 | 25 | 27 | 51 | 134 | 450 |
| 5 | 2007-08 | LAL | 27 | 6 | 2 | 70 | 4 | 21 | 19.0% | 2 | 10 | 20.0% | 4 | 4 | 100.0% | 4 | 6 | 10 | 3 | 2 | 0 | 4 | 6 | 14 |
| 6 | 2007-08 | ORL | 27 | 45 | 0 | 559 | 84 | 213 | 39.4% | 41 | 105 | 39.0% | 15 | 17 | 88.2% | 24 | 75 | 99 | 24 | 11 | 12 | 35 | 87 | 224 |
| 7 | 2007-08 | TOT | 27 | 51 | 2 | 629 | 88 | 234 | 37.6% | 43 | 115 | 37.4% | 19 | 21 | 90.5% | 28 | 81 | 109 | 27 | 13 | 12 | 39 | 93 | 238 |
| 8 | 2008-09 | ORL | 28 | 21 | 0 | 146 | 23 | 60 | 38.3% | 11 | 25 | 44.0% | 5 | 6 | 83.3% | 6 | 21 | 27 | 4 | 3 | 0 | 11 | 23 | 62 |
| 9 | 2008-09 | HOU | 28 | 9 | 0 | 25 | 5 | 16 | 31.3% | 2 | 5 | 40.0% | 0 | 0 | 0.0% | 1 | 4 | 5 | 1 | 0 | 3 | 2 | 3 | 12 |
| 10 | 2008-09 | TOT | 28 | 30 | 0 | 171 | 28 | 76 | 36.8% | 13 | 30 | 43.3% | 5 | 6 | 83.3% | 7 | 25 | 32 | 5 | 3 | 3 | 13 | 26 | 74 |
| 11 | 2009-10 | HOU | 29 | 15 | 0 | 44 | 7 | 23 | 30.4% | 2 | 9 | 22.2% | 5 | 7 | 71.4% | 1 | 8 | 9 | 1 | 0 | 2 | 6 | 5 | 21 |
| 12 | 2010-11 | LAC | 30 | 40 | 0 | 447 | 72 | 170 | 42.4% | 34 | 79 | 43.0% | 15 | 24 | 62.5% | 19 | 77 | 96 | 15 | 12 | 11 | 25 | 75 | 193 |
| 13 | 2011-12 | LAC | 31 | 16 | 0 | 121 | 11 | 49 | 22.4% | 5 | 27 | 18.5% | 4 | 4 | 100.0% | 4 | 19 | 23 | 2 | 2 | 4 | 4 | 26 | 31 |
| 14 | 2011-12 | WAS | 31 | 16 | 0 | 155 | 20 | 49 | 40.8% | 5 | 23 | 21.7% | 5 | 6 | 83.3% | 6 | 34 | 40 | 8 | 4 | 1 | 7 | 22 | 50 |
| 15 | 2011-12 | TOT | 31 | 32 | 0 | 276 | 31 | 98 | 31.6% | 10 | 50 | 20.0% | 9 | 10 | 90.0% | 10 | 53 | 63 | 10 | 6 | 5 | 11 | 48 | 81 |
Max Min
NBA Alltime Leaders
Games Played
Robert Parish: 1,611Kareem Abdul-Jabbar: 1,560
Vince Carter: 1,541
Dirk Nowitzki: 1,522
John Stockton: 1,504
Points
LeBron James: 40,474Kareem Abdul-Jabbar: 38,387
Karl Malone: 36,928
Kobe Bryant: 33,643
Michael Jordan: 32,292
Steals
John Stockton: 3,265Jason Kidd: 2,684
Chris Paul: 2,614
Michael Jordan: 2,514
Gary Payton: 2,445
Free Throws Made
Karl Malone: 9,787Moses Malone: 8,531
LeBron James: 8,390
Kobe Bryant: 8,378
Oscar Robertson: 7,694