Brandon Jennings Stats: NBA Career

Welcome to the profile page of Brandon Jennings, a dynamic point guard who made a significant impact during his time in the NBA. Throughout his career, Jennings played for five different teams, showcasing his versatility and adaptability as a player.
Jennings began his NBA journey in the 2009-2010 season with the Milwaukee Bucks, where he quickly made a name for himself as a young and promising talent. Known for his quickness, creativity, and scoring ability, Jennings became a fan favorite in M...ilwaukee before eventually moving on to play for the Detroit Pistons, Orlando Magic, New York Knicks, and Washington Wizards.
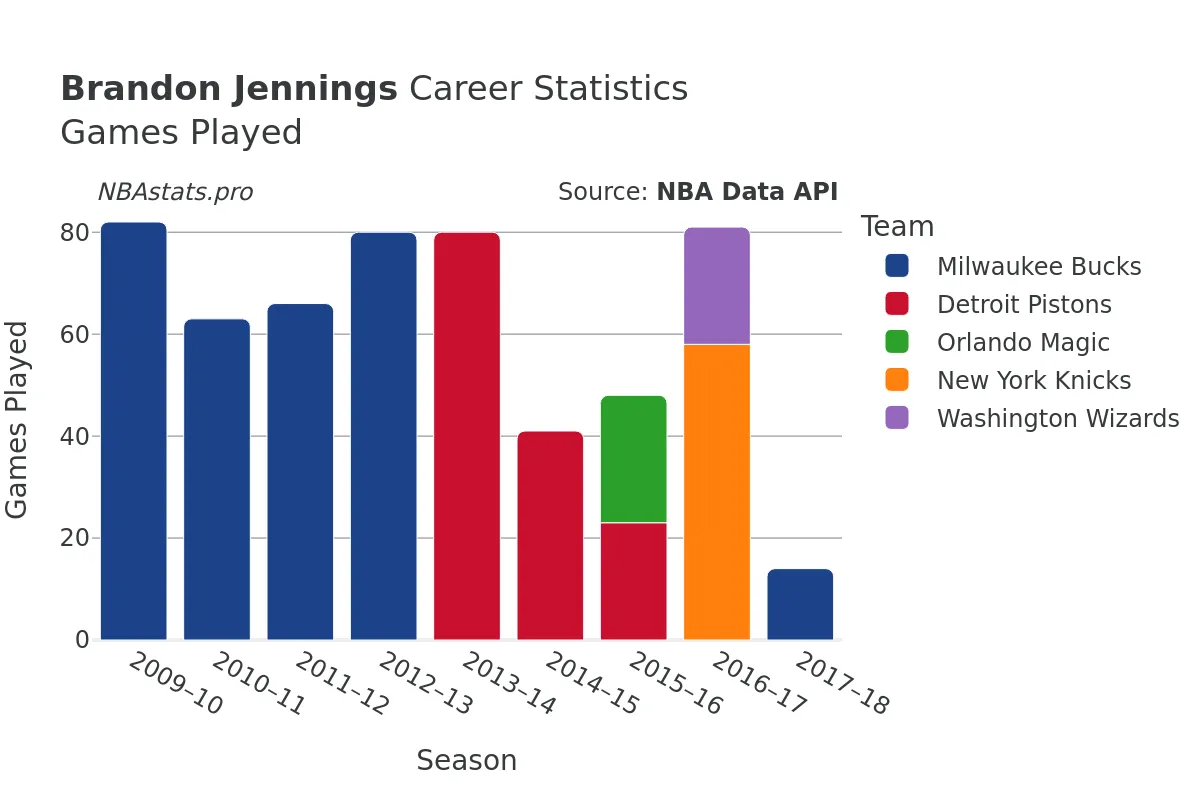
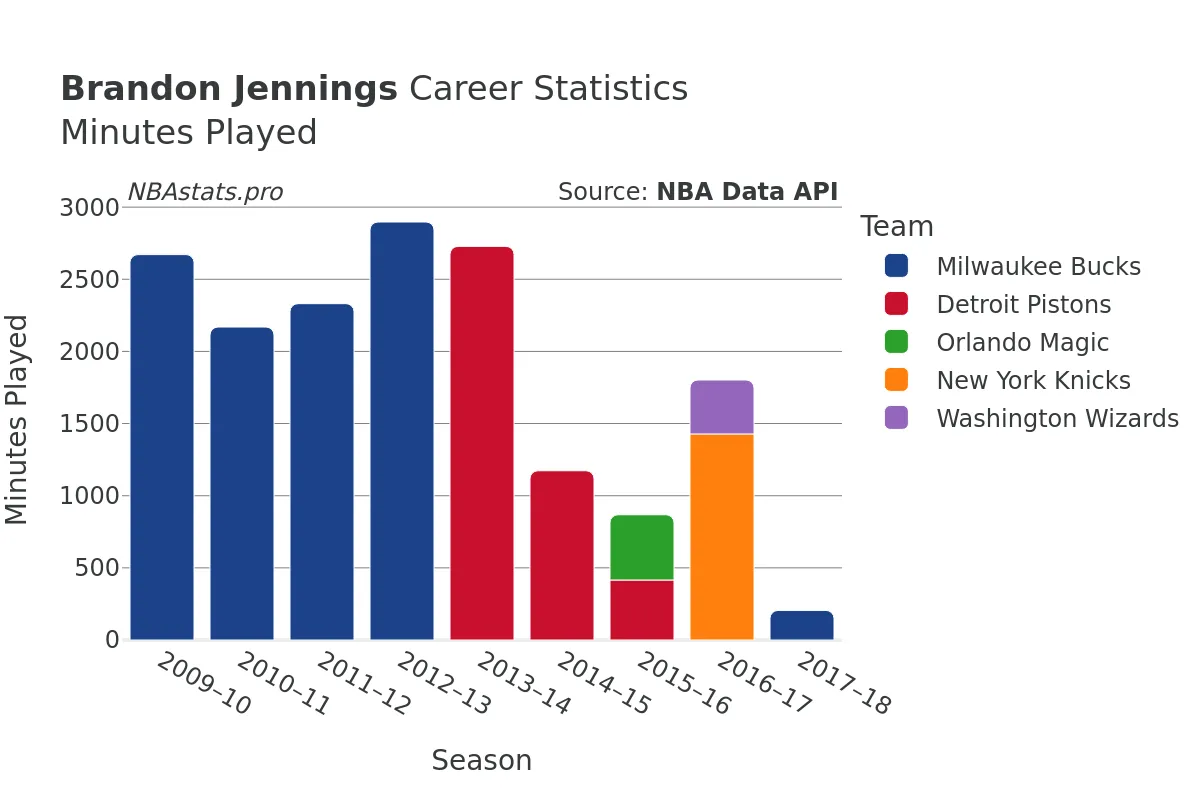
Over the course of his career, Jennings demonstrated his dedication to the game, appearing in a total of 684 games and logging over 19,000 minutes on the court. His offensive prowess was evident in his 3,054 field goals made out of 7,938 attempts, resulting in a field goal percentage of approximately 38.47%.
Adept at drawing fouls and getting to the free-throw line, Jennings attempted 1,973 free throws and made an impressive 1,558 of them. His accuracy from the charity stripe further solidified his reputation as a reliable scorer and clutch performer.
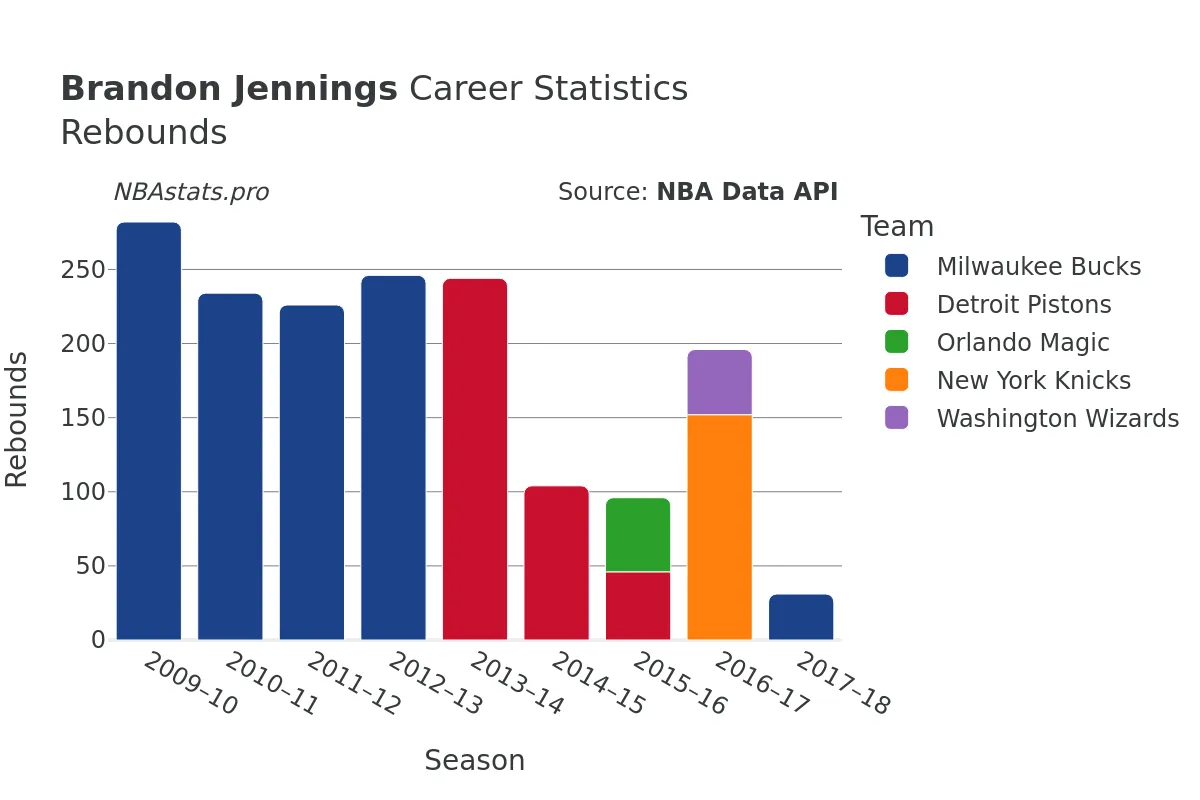
In addition to his scoring ability, Jennings was also a well-rounded player on the court. He contributed significantly on the glass, pulling down a total of 1,951 rebounds throughout his career. His knack for crashing the boards and grabbing offensive rebounds showcased his tenacity and hustle on both ends of the floor.
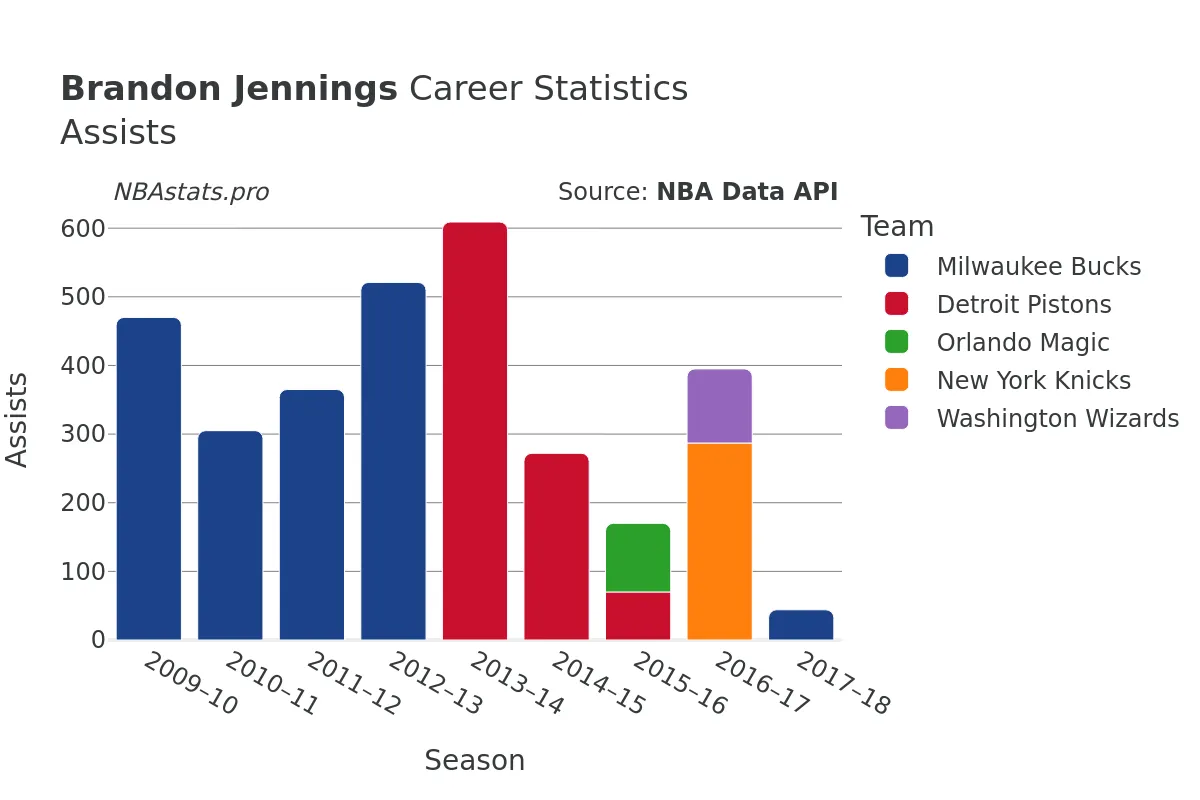
As a playmaker, Jennings excelled in creating opportunities for his teammates, notching 3,716 assists over the span of his career. His court vision, passing skills, and ability to set up his teammates for easy baskets made him a valuable asset to any team he played for.
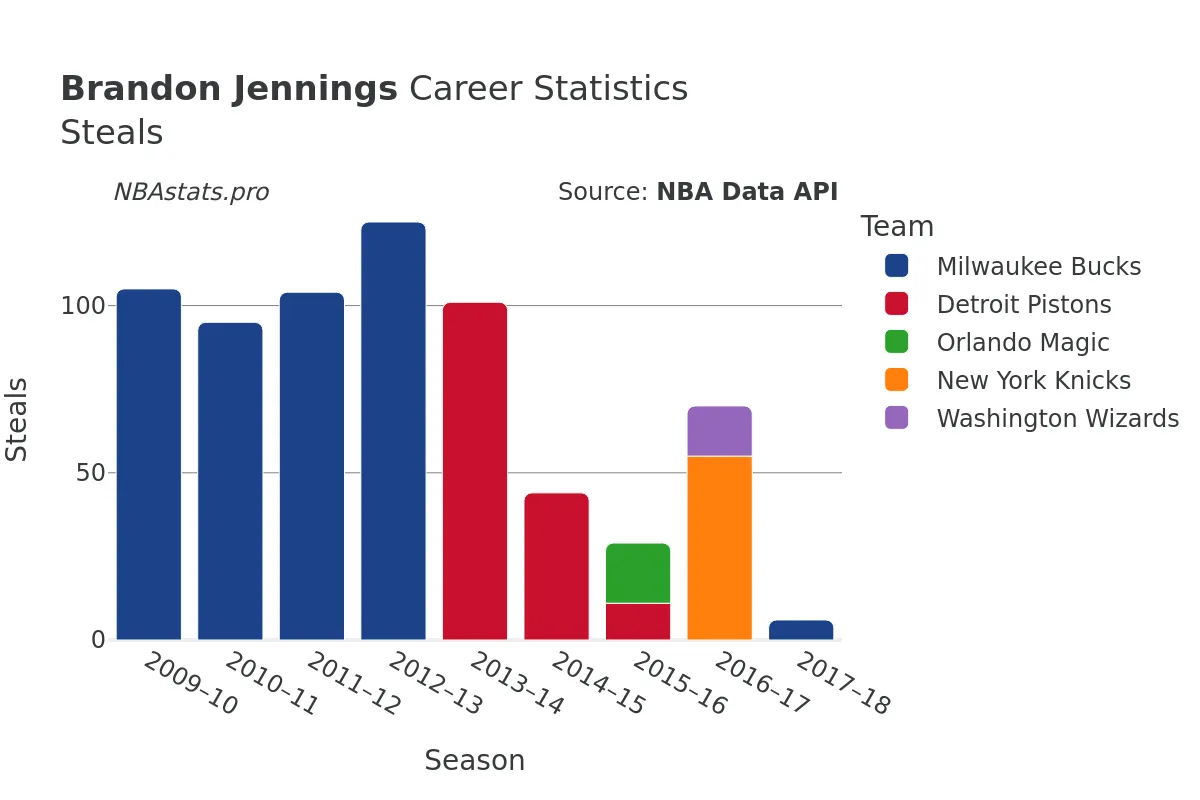
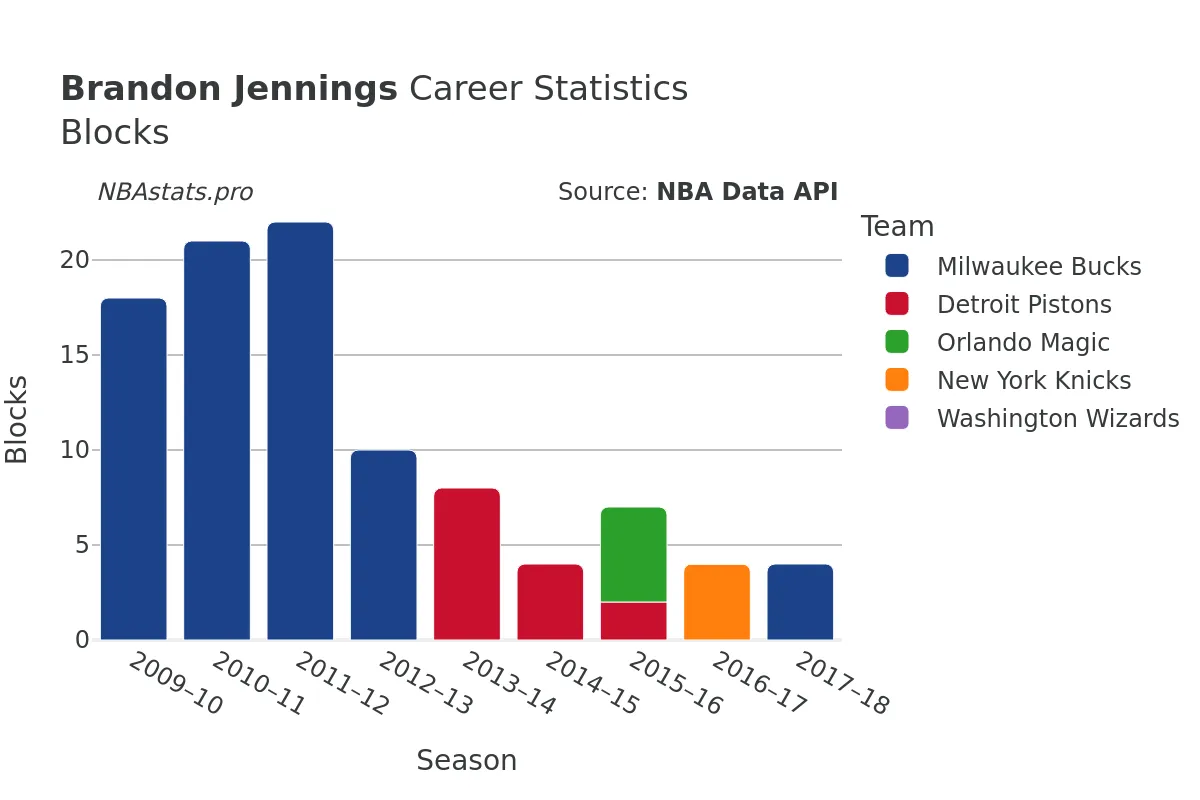
Defensively, Jennings was a disruptive force, tallying 778 steals and 109 blocks throughout his time in the league. His quick hands, anticipation, and defensive awareness allowed him to generate turnovers and make life difficult for opposing scorers.
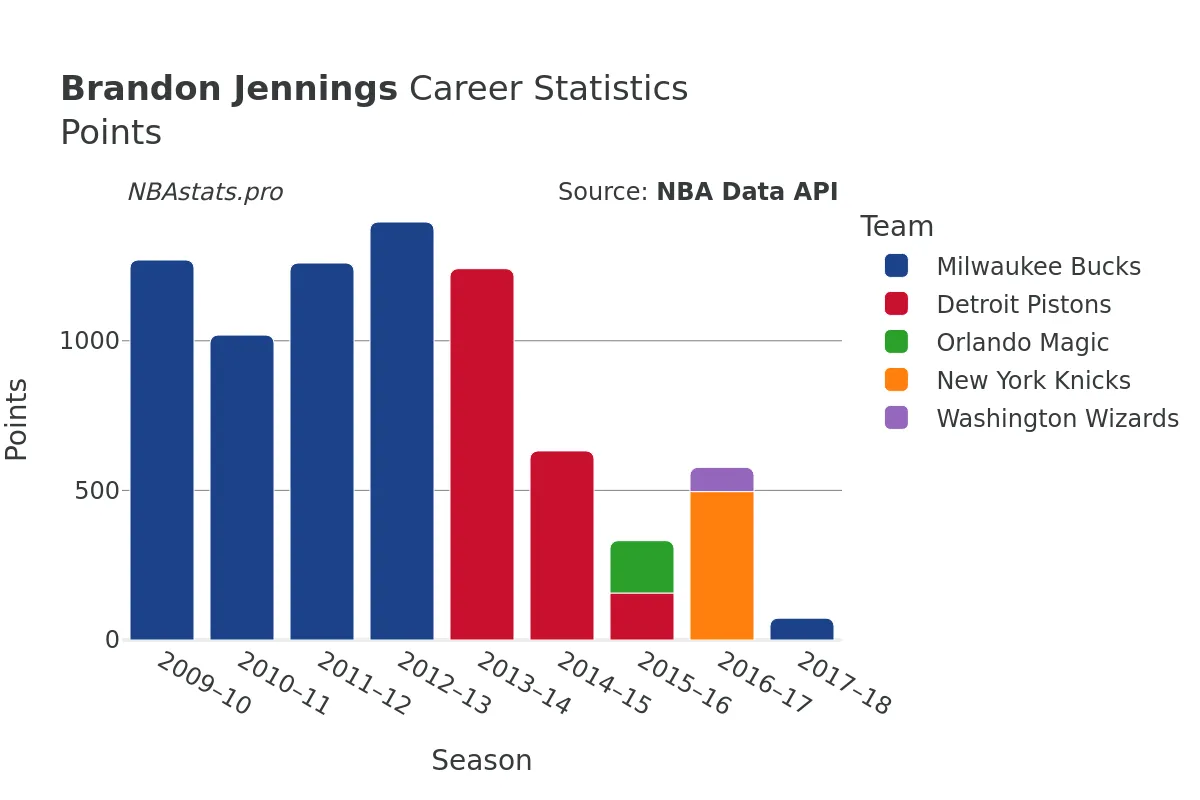
When it came to putting points on the board, Jennings was a reliable scorer, amassing a total of 8,710 points over his NBA career. Whether from beyond the arc, driving to the basket, or knocking down mid-range jumpers, Jennings had a diverse scoring repertoire that kept defenders on their toes.
Although Jennings is no longer active in the NBA, his impact on the league and the teams he played for lingers on. His scoring ability, playmaking skills, and defensive tenacity left a lasting impression on fans and teammates alike.
To delve deeper into Brandon Jennings' career statistics and performance metrics, explore the charts and data provided on this profile page. Get to know the player behind the numbers and appreciate the unique skills and contributions that made Jennings a standout player in the NBA.
Read more
Games Played
Points
Assists
Rebounds
Steals
Minutes Played
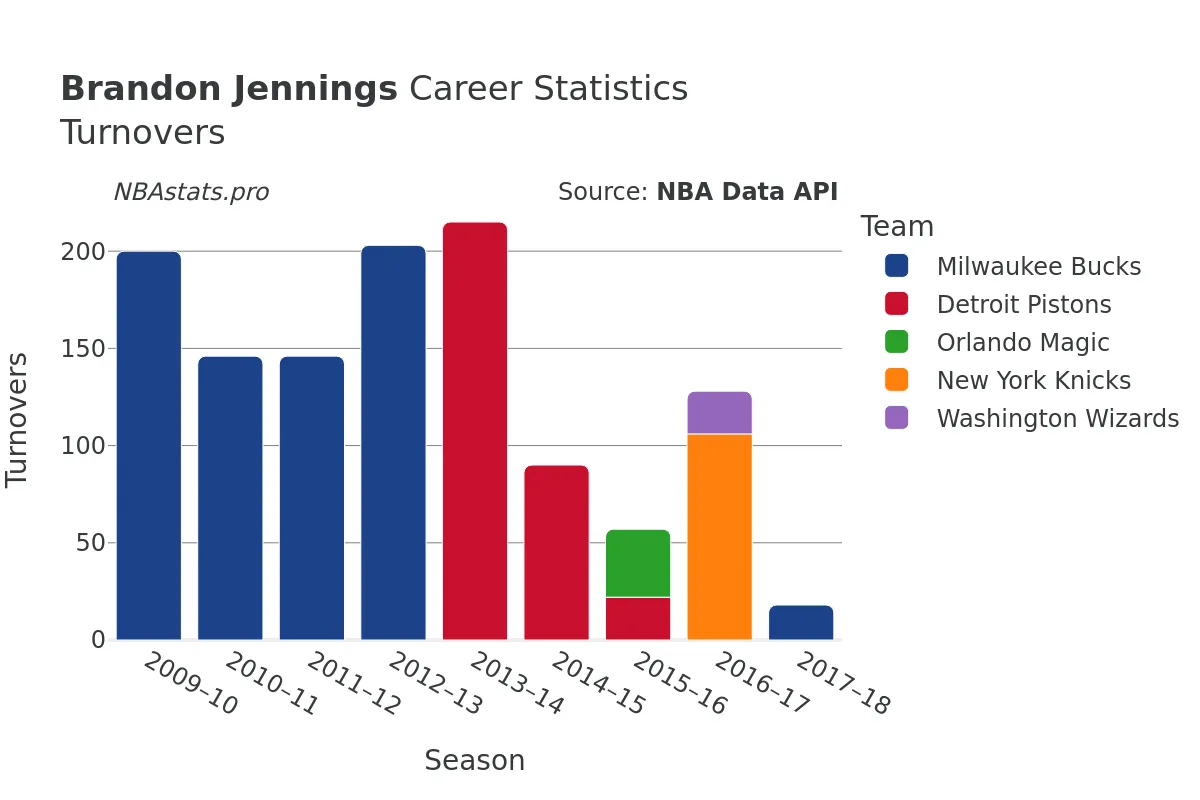
Turnovers
Blocks
Brandon Jennings Career Stats Table
| SEASON | TEAM | AGE | GP | GS | MIN | FGM | FGA | FG % | FG3M | FG3A | FG3 % | FTM | FTA | FT % | OREB | DREB | REB | AST | STL | BLK | TOV | PF | PTS | |
|---|---|---|---|---|---|---|---|---|---|---|---|---|---|---|---|---|---|---|---|---|---|---|---|---|
| 1 | 2009-10 | MIL | 20 | 82 | 82 | 2,671 | 451 | 1,216 | 37.1% | 145 | 388 | 37.4% | 223 | 273 | 81.7% | 49 | 233 | 282 | 470 | 105 | 18 | 200 | 191 | 1,270 |
| 2 | 2010-11 | MIL | 21 | 63 | 61 | 2,169 | 361 | 926 | 39.0% | 98 | 303 | 32.3% | 199 | 246 | 80.9% | 42 | 192 | 234 | 305 | 95 | 21 | 146 | 131 | 1,019 |
| 3 | 2011-12 | MIL | 22 | 66 | 66 | 2,331 | 469 | 1,121 | 41.8% | 129 | 388 | 33.2% | 193 | 239 | 80.8% | 49 | 177 | 226 | 365 | 104 | 22 | 146 | 114 | 1,260 |
| 4 | 2012-13 | MIL | 23 | 80 | 80 | 2,897 | 497 | 1,247 | 39.9% | 173 | 461 | 37.5% | 230 | 281 | 81.9% | 59 | 187 | 246 | 521 | 125 | 10 | 203 | 155 | 1,397 |
| 5 | 2013-14 | DET | 24 | 80 | 79 | 2,728 | 423 | 1,135 | 37.3% | 154 | 457 | 33.7% | 241 | 321 | 75.1% | 59 | 185 | 244 | 609 | 101 | 8 | 215 | 157 | 1,241 |
| 6 | 2014-15 | DET | 25 | 41 | 41 | 1,173 | 218 | 543 | 40.1% | 76 | 211 | 36.0% | 120 | 143 | 83.9% | 21 | 83 | 104 | 272 | 44 | 4 | 90 | 64 | 632 |
| 7 | 2015-16 | DET | 26 | 23 | 1 | 416 | 53 | 143 | 37.1% | 24 | 77 | 31.2% | 27 | 38 | 71.1% | 5 | 41 | 46 | 70 | 11 | 2 | 22 | 24 | 157 |
| 8 | 2015-16 | ORL | 26 | 25 | 6 | 452 | 59 | 161 | 36.6% | 27 | 78 | 34.6% | 30 | 40 | 75.0% | 11 | 39 | 50 | 100 | 18 | 5 | 35 | 33 | 175 |
| 9 | 2015-16 | TOT | 26 | 48 | 7 | 868 | 112 | 304 | 36.8% | 51 | 155 | 32.9% | 57 | 78 | 73.1% | 16 | 80 | 96 | 170 | 29 | 7 | 57 | 57 | 332 |
| 10 | 2016-17 | NYK | 27 | 58 | 11 | 1,428 | 163 | 429 | 38.0% | 68 | 200 | 34.0% | 102 | 135 | 75.6% | 21 | 131 | 152 | 287 | 55 | 4 | 106 | 84 | 496 |
| 11 | 2016-17 | WAS | 27 | 23 | 2 | 374 | 29 | 106 | 27.4% | 11 | 52 | 21.2% | 12 | 17 | 70.6% | 8 | 36 | 44 | 108 | 15 | 0 | 22 | 32 | 81 |
| 12 | 2016-17 | TOT | 27 | 81 | 13 | 1,801 | 192 | 535 | 35.9% | 79 | 252 | 31.3% | 114 | 152 | 75.0% | 29 | 167 | 196 | 395 | 70 | 4 | 128 | 116 | 577 |
| 13 | 2017-18 | MIL | 28 | 14 | 0 | 205 | 27 | 72 | 37.5% | 9 | 33 | 27.3% | 10 | 10 | 100.0% | 5 | 26 | 31 | 44 | 6 | 4 | 18 | 11 | 73 |
Max Min
NBA Alltime Leaders
Games Played
Robert Parish: 1,611Kareem Abdul-Jabbar: 1,560
Vince Carter: 1,541
Dirk Nowitzki: 1,522
John Stockton: 1,504
Points
LeBron James: 40,474Kareem Abdul-Jabbar: 38,387
Karl Malone: 36,928
Kobe Bryant: 33,643
Michael Jordan: 32,292
Steals
John Stockton: 3,265Jason Kidd: 2,684
Chris Paul: 2,614
Michael Jordan: 2,514
Gary Payton: 2,445
Free Throws Made
Karl Malone: 9,787Moses Malone: 8,531
LeBron James: 8,390
Kobe Bryant: 8,378
Oscar Robertson: 7,694