Brandon Bass Stats: NBA Career

**Analyzing the Career of Brandon Bass: The Power Forward from New Orleans**
When it comes to the NBA, every player has a unique journey that defines their legacy on the court. One player whose career is worth delving into is Brandon Bass, a power forward who has left his mark on multiple teams in the league. With years of experience playing for notable teams such as the New Orleans Pelicans, Dallas Mavericks, Orlando Magic, Boston Celtics, Los Angeles Lakers, and Los Angeles Clippers, Bass has... showcased his skills and versatility through his gameplay.
Brandon Bass embarked on his NBA career in the 2005-06 season, when he was just 21 years old. Over the span of 12 seasons, he proved to be a consistent and reliable player, earning a reputation as a talented power forward. Despite retiring after the 2016-17 season, Bass's impact on the court is still remembered by fans and his fellow players alike.
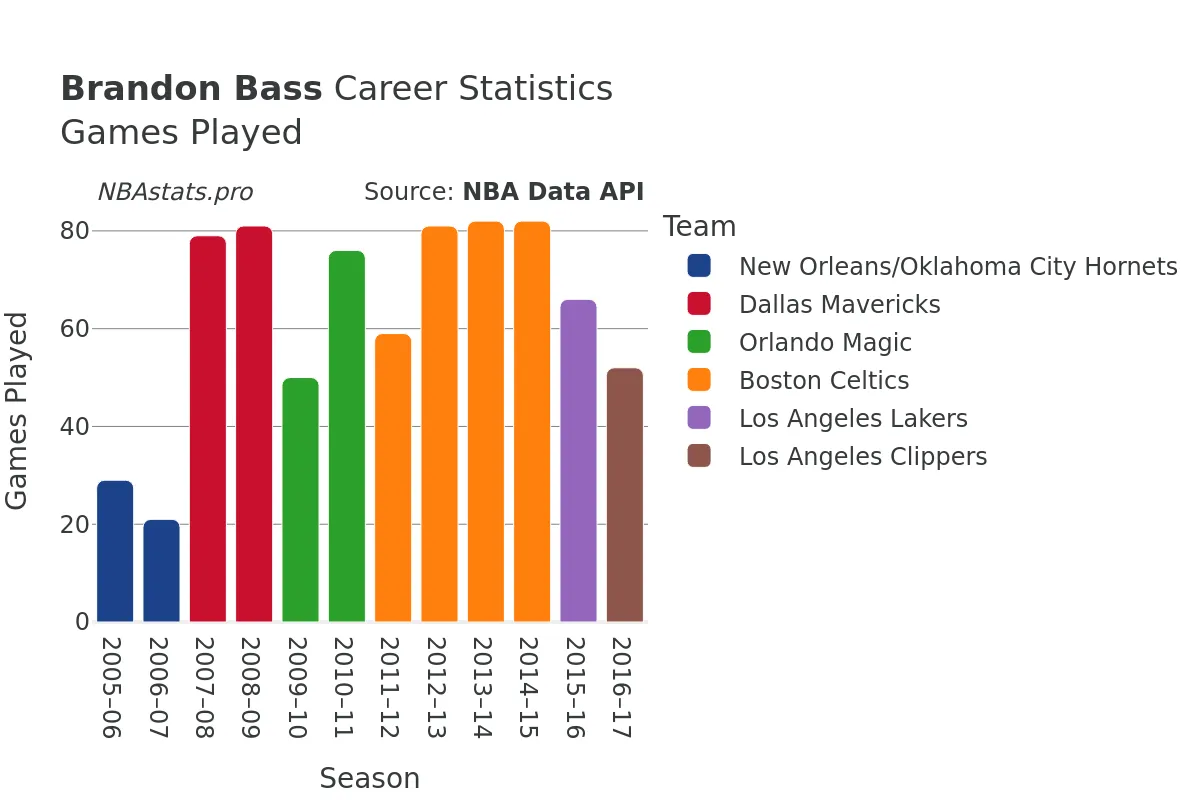
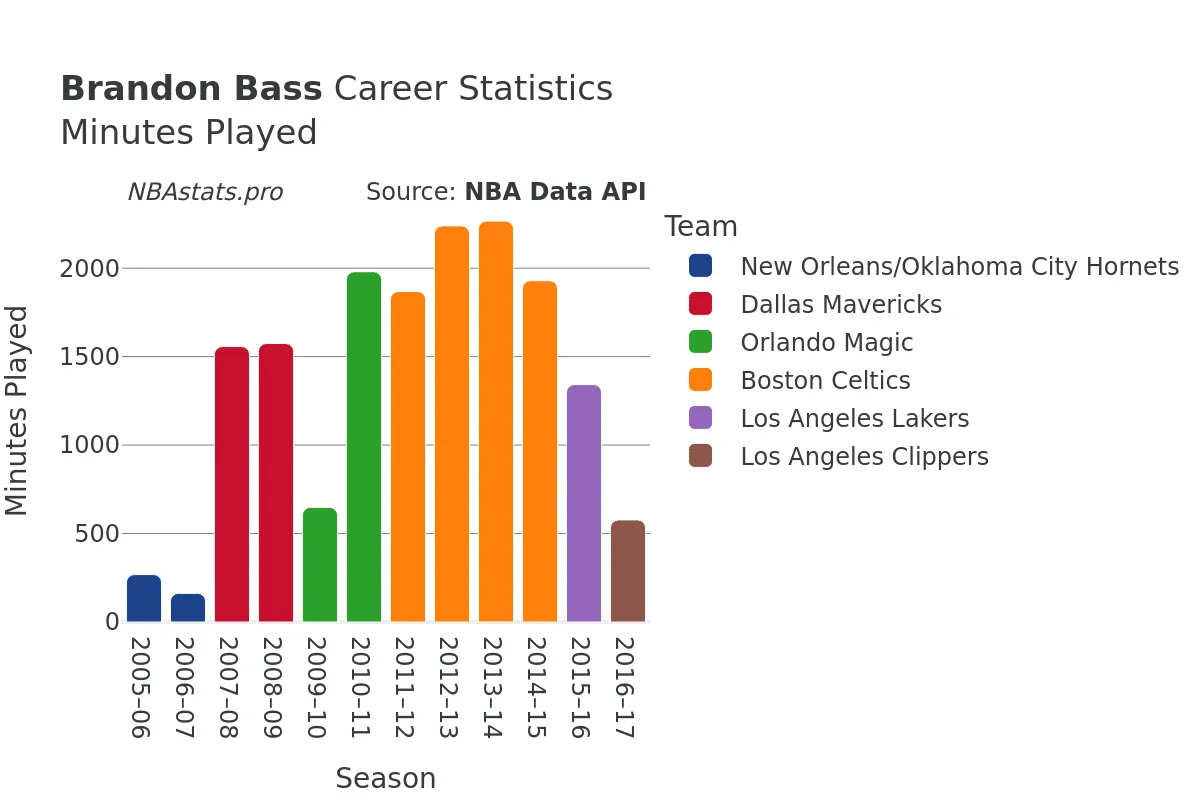
Throughout his career, Brandon Bass appeared in a total of 758 games, amassing an impressive 16,410 minutes of playing time. His dedication to the game is further showcased by his 51% field goal percentage, with 2,558 successful goals out of 5,125 attempts. Additionally, Bass demonstrated his skill at the free-throw line, with a remarkable free throw percentage, making 1,447 out of 1,740 attempts.
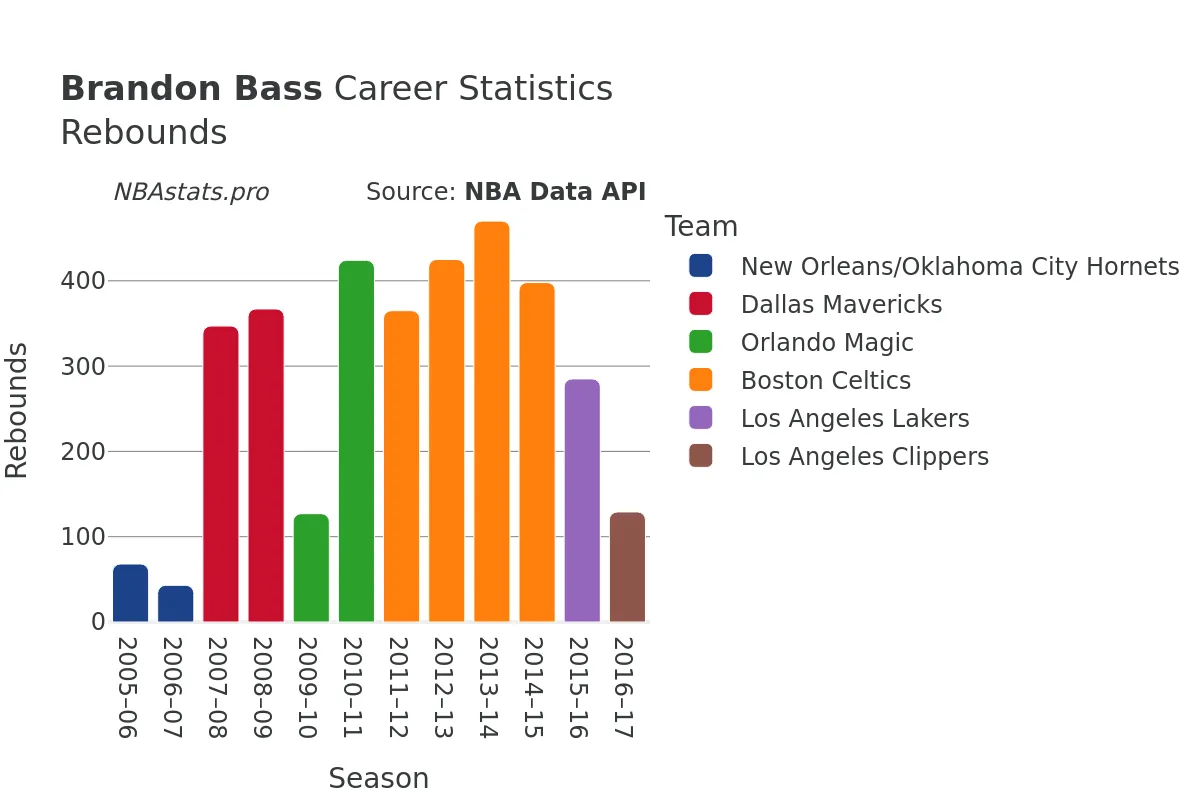
Rebounds were another area where Brandon Bass excelled, showcasing his prowess on both the defensive and offensive ends of the court. He secured a total of 3,448 rebounds, with 2,309 of them being defensive rebounds and 1,139 offensive rebounds. His ability to control the boards played a crucial role in his team's success and added an essential dimension to his overall gameplay.
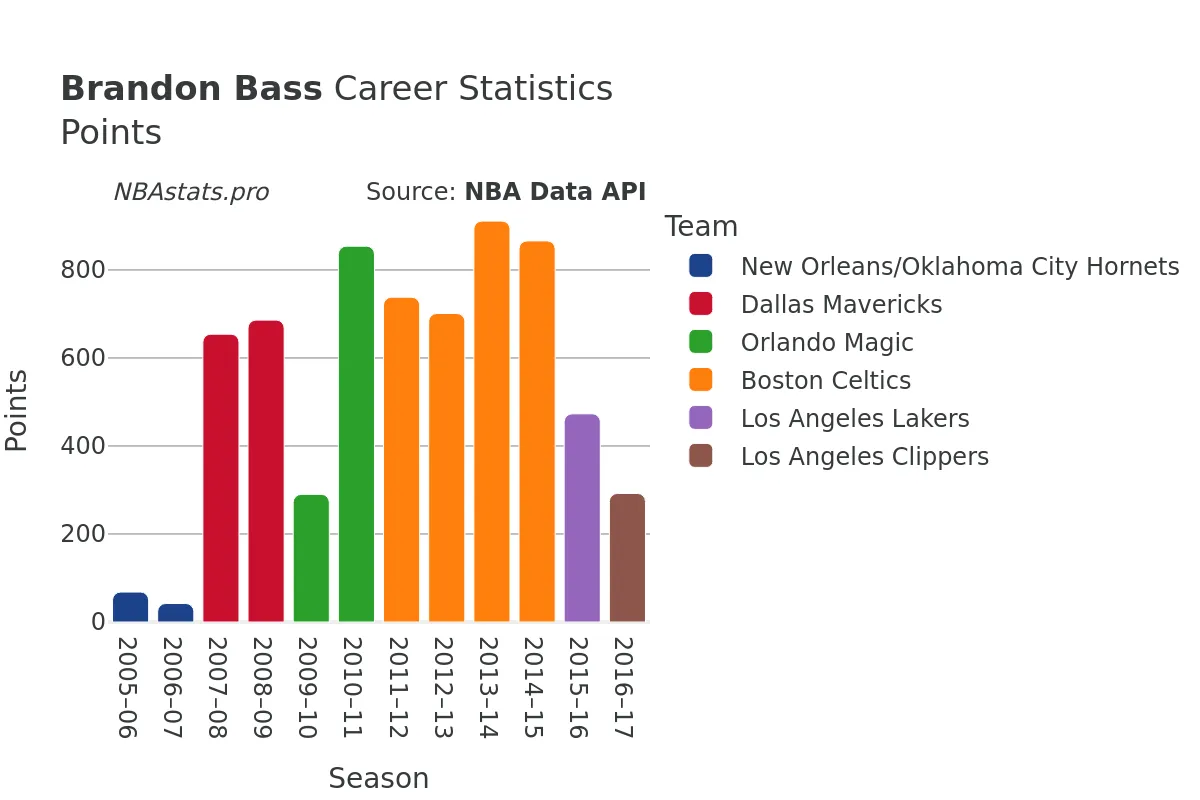
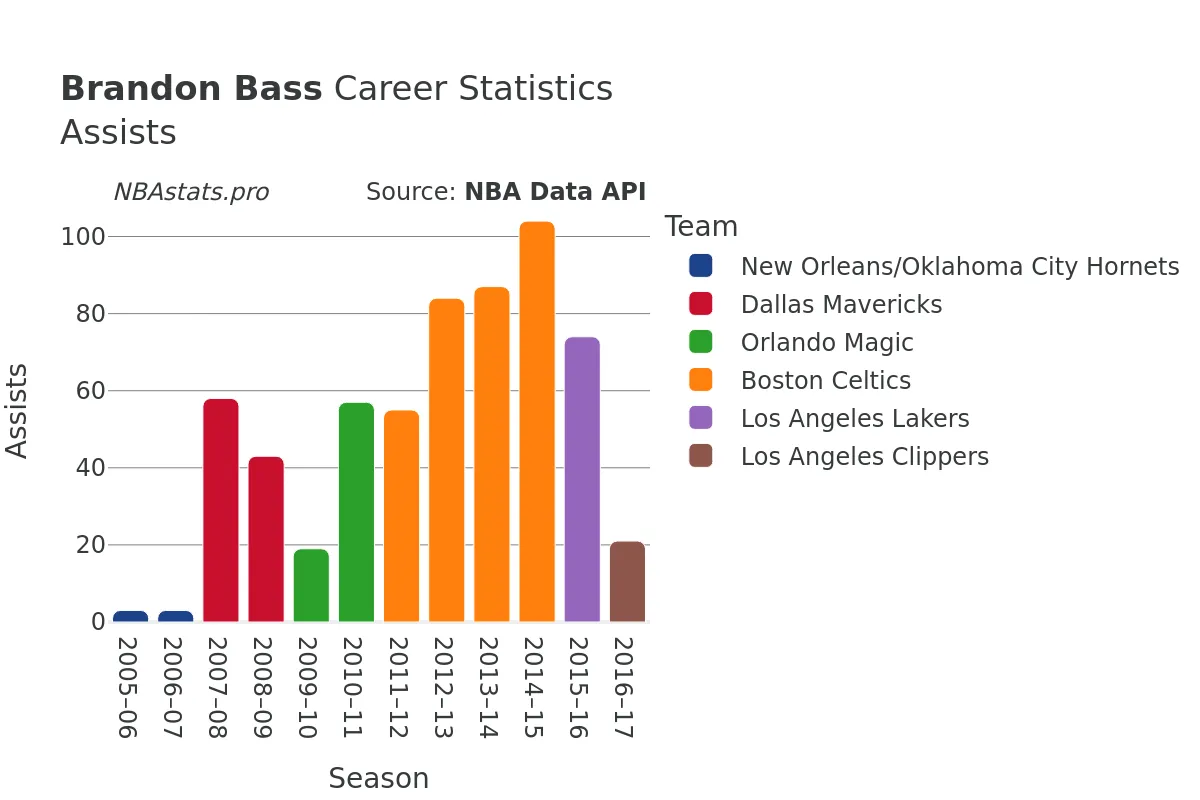
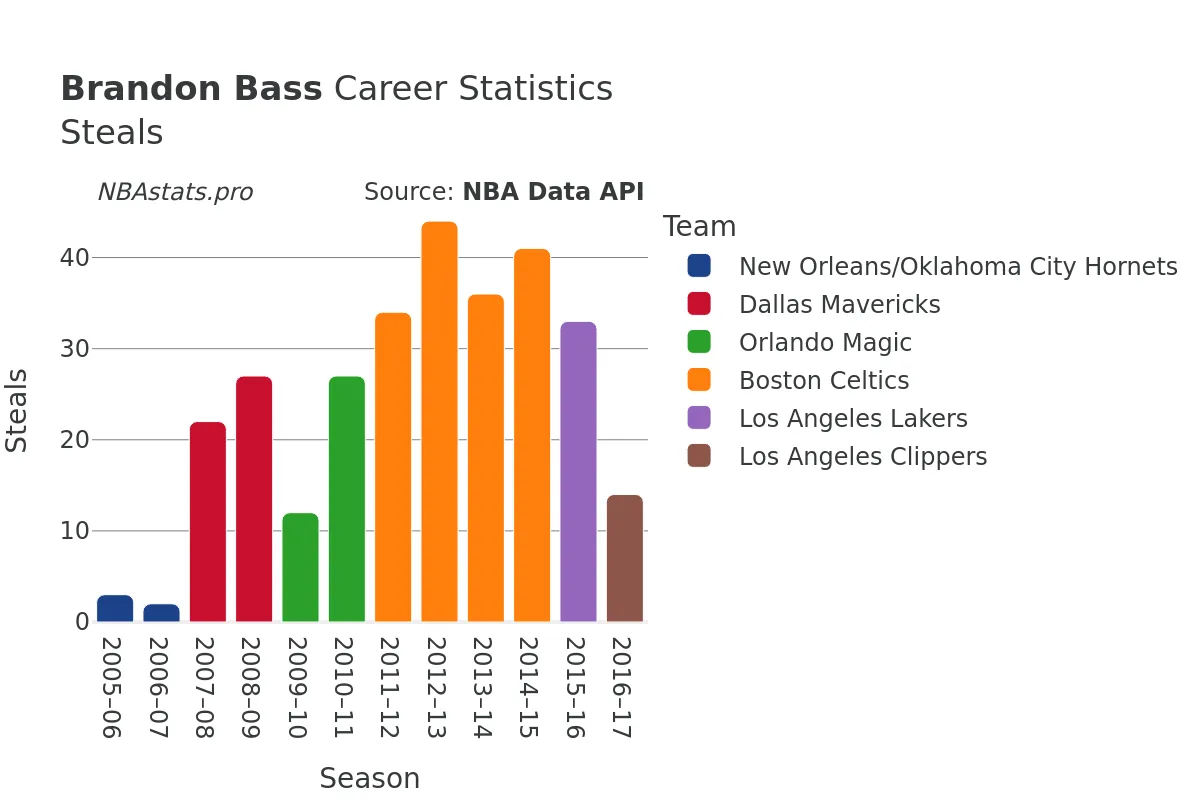
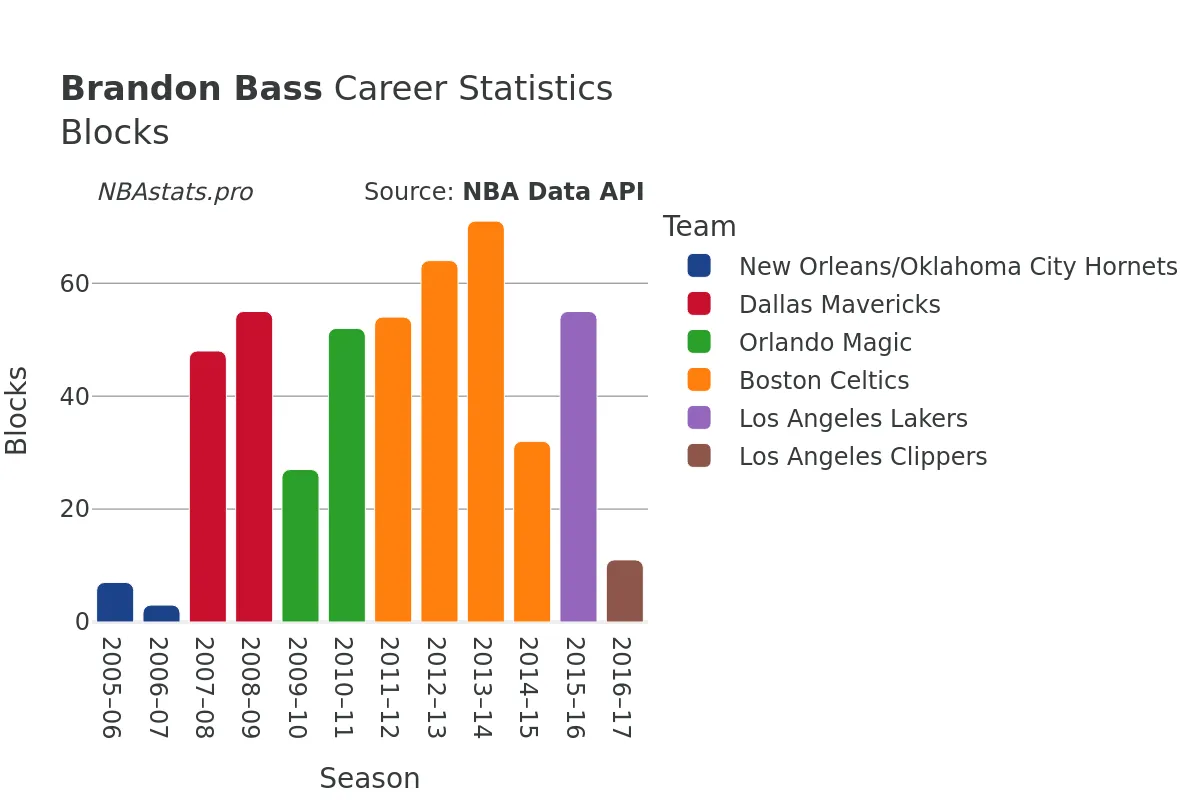
In terms of other statistics, Brandon Bass's versatility as a player is evident in his performance across various categories. He contributed 608 assists, demonstrating his playmaking abilities, and registered 295 steals and 479 blocks, highlighting his defensive impact on the court. Moreover, Bass accumulated a total of 6,575 points throughout his career, solidifying his status as a reliable scorer for his teams.
One of the most intriguing aspects of Brandon Bass's career is his journey across different cities and states as he represented different NBA teams. From his early days in New Orleans to stints in Dallas, Orlando, Boston, and finally Los Angeles, Bass's career trajectory showcases the diverse experiences and challenges he encountered as a professional basketball player.
As you explore the statistics and details of Brandon Bass's career, you will gain a deeper understanding of the player's contributions to the teams he played for and the impact he had on the game. Whether you are a fan of Bass specifically or simply interested in analyzing the career of a seasoned NBA player, delving into the numbers and insights will provide valuable context into the legacy of this talented power forward.
So, take a closer look at the career of Brandon Bass, the power forward from New Orleans, and uncover the story behind the numbers. Dive into the charts, explore the data, and immerse yourself in the journey of a player who left a lasting impression on the NBA with his skills, dedication, and passion for the game.
Read more
Games Played
Points
Assists
Rebounds
Steals
Minutes Played
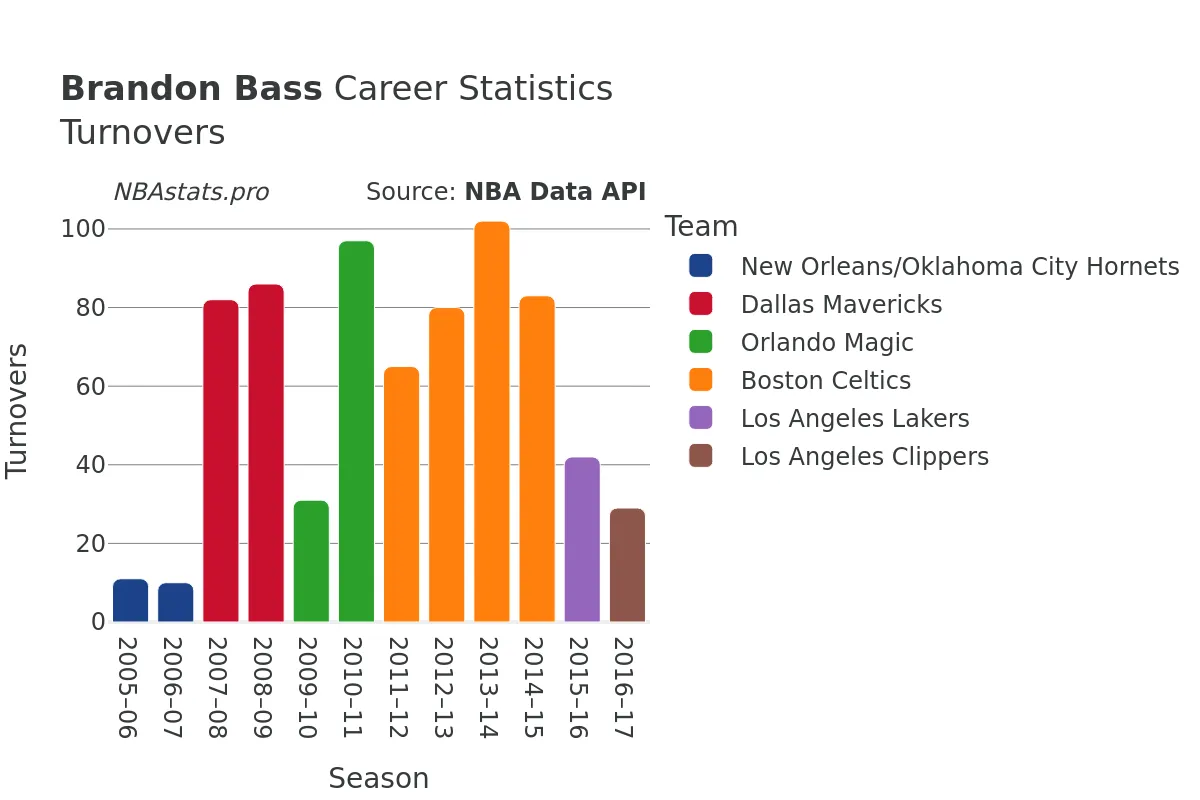
Turnovers
Blocks
Brandon Bass Career Stats Table
| SEASON | TEAM | AGE | GP | GS | MIN | FGM | FGA | FG % | FG3M | FG3A | FG3 % | FTM | FTA | FT % | OREB | DREB | REB | AST | STL | BLK | TOV | PF | PTS | |
|---|---|---|---|---|---|---|---|---|---|---|---|---|---|---|---|---|---|---|---|---|---|---|---|---|
| 1 | 2005-06 | NOK | 21 | 29 | 1 | 268 | 28 | 70 | 40.0% | 0 | 0 | 0.0% | 12 | 19 | 63.2% | 18 | 50 | 68 | 3 | 3 | 7 | 11 | 18 | 68 |
| 2 | 2006-07 | NOK | 22 | 21 | 3 | 162 | 15 | 44 | 34.1% | 0 | 1 | 0.0% | 12 | 16 | 75.0% | 13 | 30 | 43 | 3 | 2 | 3 | 10 | 16 | 42 |
| 3 | 2007-08 | DAL | 23 | 79 | 1 | 1,557 | 246 | 493 | 49.9% | 0 | 4 | 0.0% | 162 | 197 | 82.2% | 120 | 227 | 347 | 58 | 22 | 48 | 82 | 150 | 654 |
| 4 | 2008-09 | DAL | 24 | 81 | 0 | 1,574 | 252 | 508 | 49.6% | 0 | 6 | 0.0% | 182 | 210 | 86.7% | 129 | 238 | 367 | 43 | 27 | 55 | 86 | 140 | 686 |
| 5 | 2009-10 | ORL | 25 | 50 | 3 | 648 | 119 | 233 | 51.1% | 0 | 0 | 0.0% | 52 | 63 | 82.5% | 54 | 73 | 127 | 19 | 12 | 27 | 31 | 69 | 290 |
| 6 | 2010-11 | ORL | 26 | 76 | 51 | 1,980 | 332 | 645 | 51.5% | 0 | 2 | 0.0% | 190 | 233 | 81.5% | 134 | 290 | 424 | 57 | 27 | 52 | 97 | 159 | 854 |
| 7 | 2011-12 | BOS | 27 | 59 | 39 | 1,868 | 303 | 632 | 47.9% | 0 | 0 | 0.0% | 132 | 163 | 81.0% | 95 | 270 | 365 | 55 | 34 | 54 | 65 | 135 | 738 |
| 8 | 2012-13 | BOS | 28 | 81 | 69 | 2,239 | 286 | 589 | 48.6% | 0 | 2 | 0.0% | 129 | 150 | 86.0% | 129 | 296 | 425 | 84 | 44 | 64 | 80 | 188 | 701 |
| 9 | 2013-14 | BOS | 29 | 82 | 73 | 2,266 | 352 | 725 | 48.6% | 2 | 6 | 33.3% | 205 | 239 | 85.8% | 161 | 309 | 470 | 87 | 36 | 71 | 102 | 190 | 911 |
| 10 | 2014-15 | BOS | 30 | 82 | 43 | 1,929 | 344 | 683 | 50.4% | 9 | 32 | 28.1% | 169 | 214 | 79.0% | 139 | 259 | 398 | 104 | 41 | 32 | 83 | 140 | 866 |
| 11 | 2015-16 | LAL | 31 | 66 | 0 | 1,342 | 174 | 317 | 54.9% | 0 | 2 | 0.0% | 125 | 148 | 84.5% | 104 | 181 | 285 | 74 | 33 | 55 | 42 | 125 | 473 |
| 12 | 2016-17 | LAC | 32 | 52 | 0 | 577 | 107 | 186 | 57.5% | 1 | 3 | 33.3% | 77 | 88 | 87.5% | 43 | 86 | 129 | 21 | 14 | 11 | 29 | 45 | 292 |
Max Min
NBA Alltime Leaders
Games Played
Robert Parish: 1,611Kareem Abdul-Jabbar: 1,560
Vince Carter: 1,541
Dirk Nowitzki: 1,522
John Stockton: 1,504
Points
LeBron James: 40,474Kareem Abdul-Jabbar: 38,387
Karl Malone: 36,928
Kobe Bryant: 33,643
Michael Jordan: 32,292
Steals
John Stockton: 3,265Jason Kidd: 2,684
Chris Paul: 2,614
Michael Jordan: 2,514
Gary Payton: 2,445
Free Throws Made
Karl Malone: 9,787Moses Malone: 8,531
LeBron James: 8,390
Kobe Bryant: 8,378
Oscar Robertson: 7,694