Anthony Morrow Stats: NBA Career

Anthony Morrow, a sharpshooter and a versatile player, has made his mark in the NBA during his illustrious career. Morrow played for an array of teams throughout his tenure in the league, showcasing his skills and leaving a lasting impact wherever he went. Let's dive into the numbers and explore the journey of this talented basketball player.
Morrow started his NBA journey in the 2008-09 season with the Golden State Warriors, where he began showcasing his scoring prowess. Over the course of his... career, he also donned the jerseys of the Brooklyn Nets, Atlanta Hawks, Dallas Mavericks, New Orleans Pelicans, Oklahoma City Thunder, and the Chicago Bulls. His ability to adapt to different playing styles and contribute effectively to each of these teams highlights his versatility and basketball IQ.
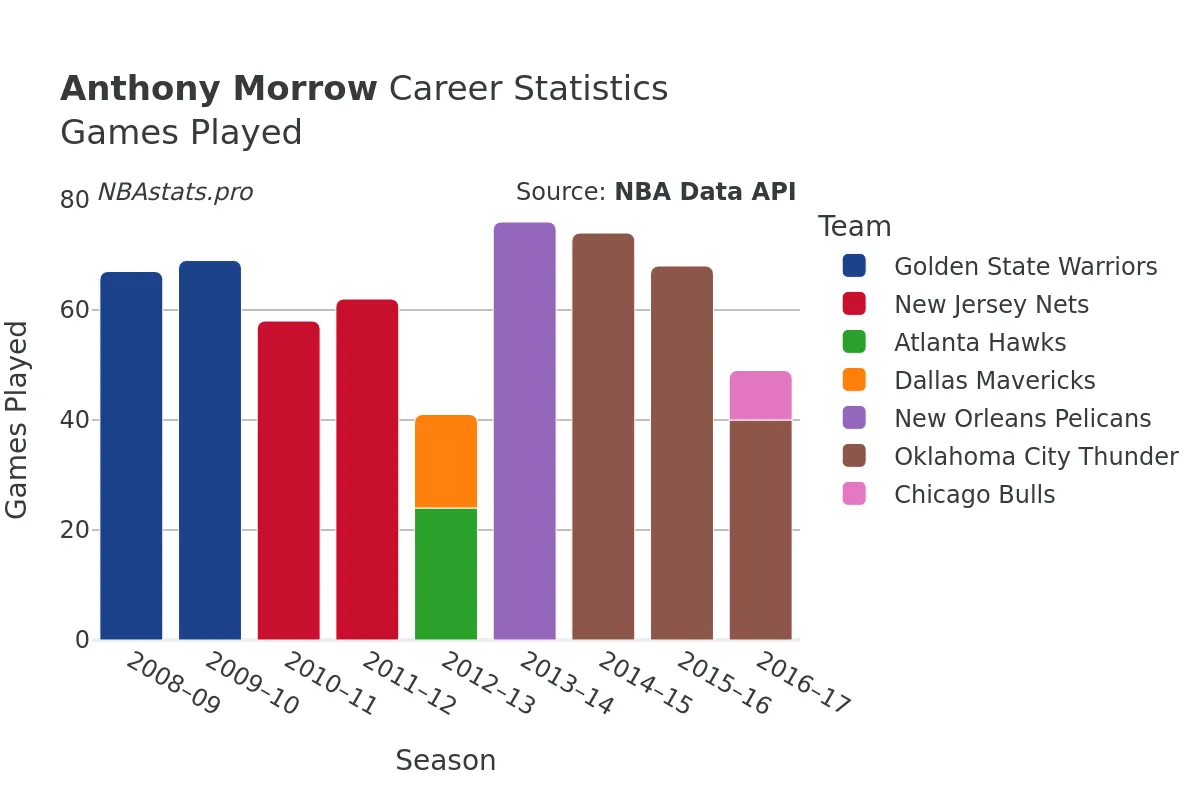
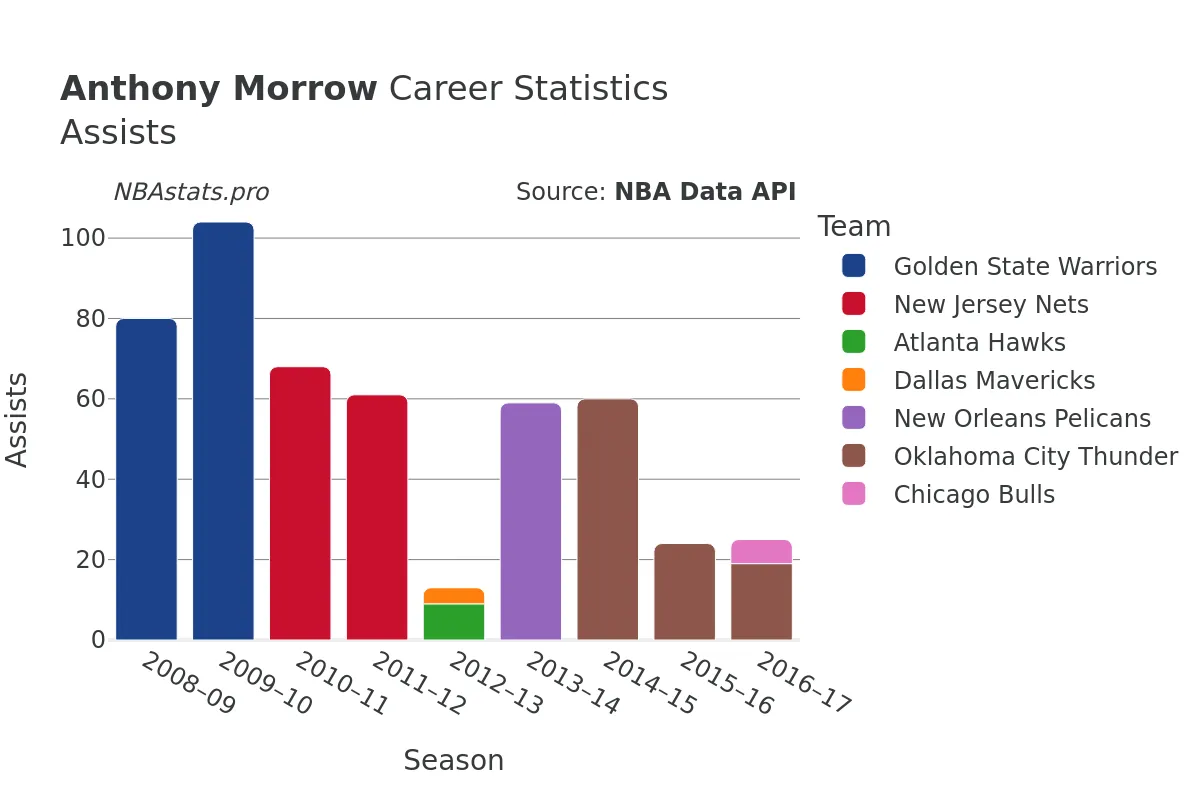
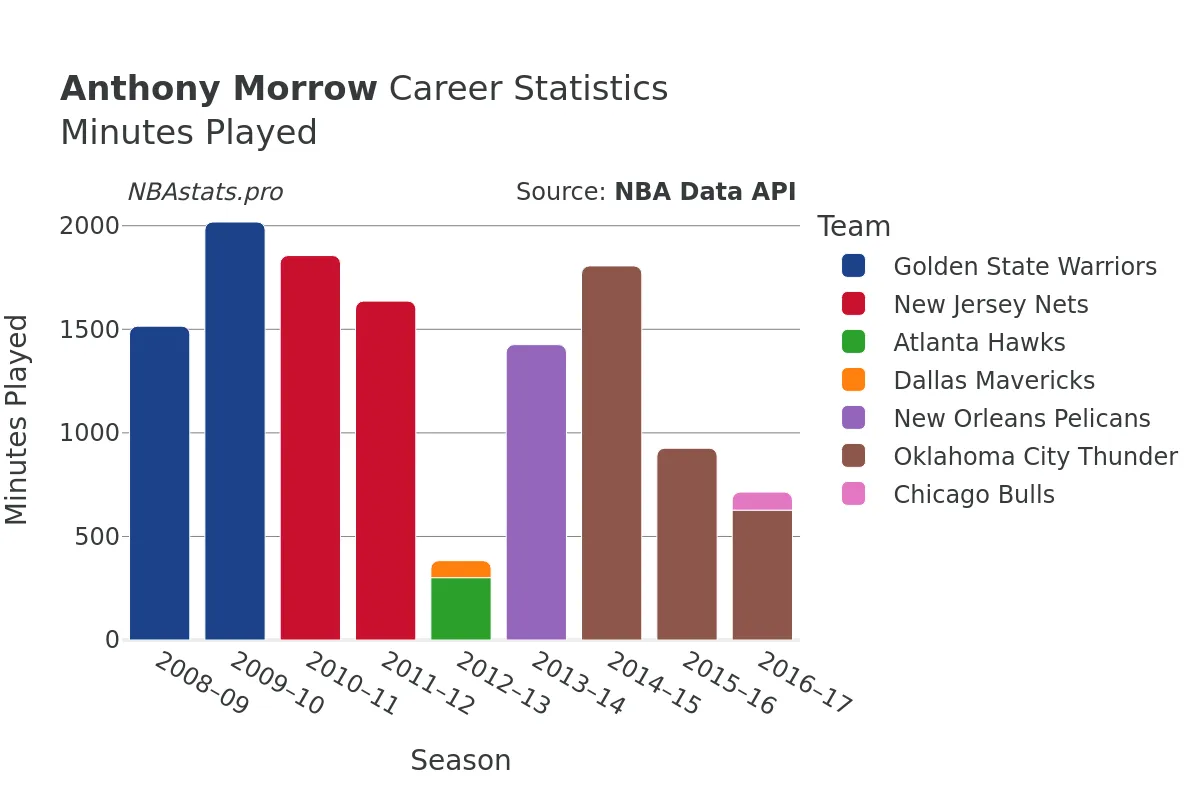
Throughout his nine seasons in the NBA, Morrow played a total of 654 games, accumulating an impressive 13,377 minutes on the court. His offensive capabilities were evident in his 2,118 field goals made out of 4,777 attempted, boasting a solid field goal percentage of 44.3%. Morrow was not just a scorer but also a team player, as reflected in his 532 assists, showcasing his willingness to create opportunities for his teammates.
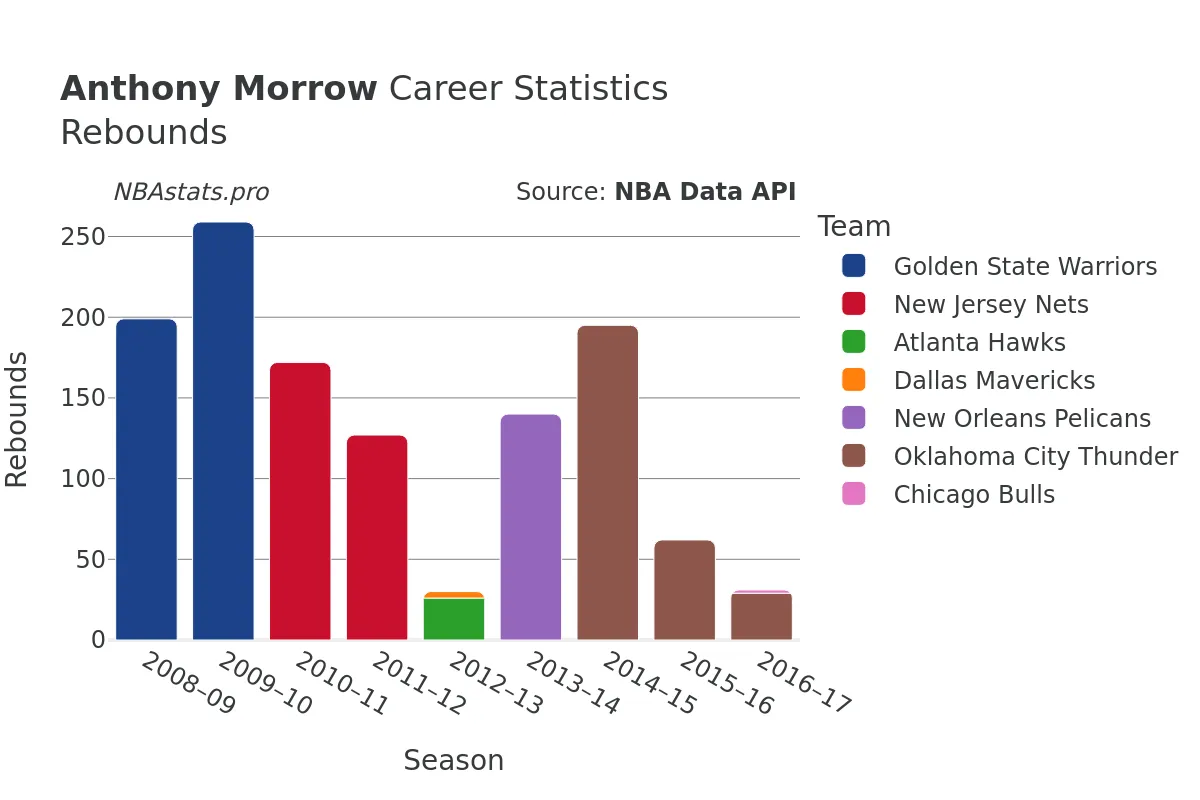
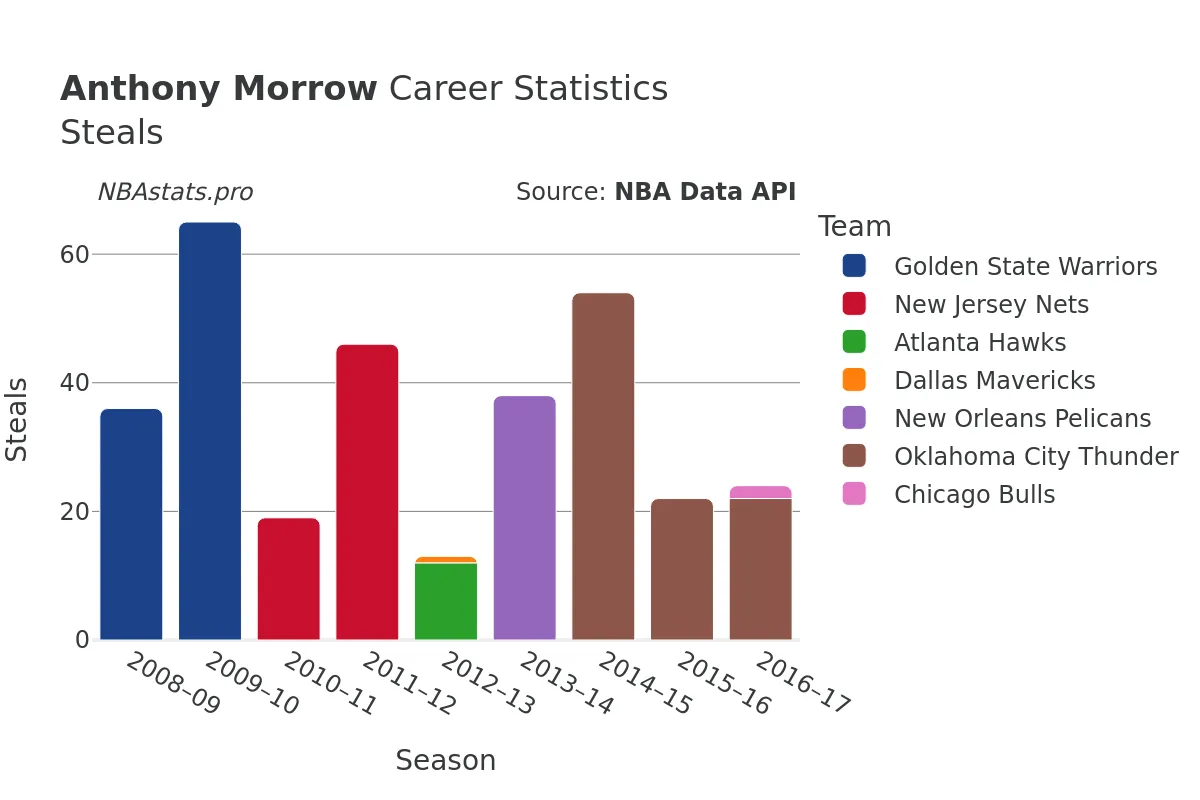
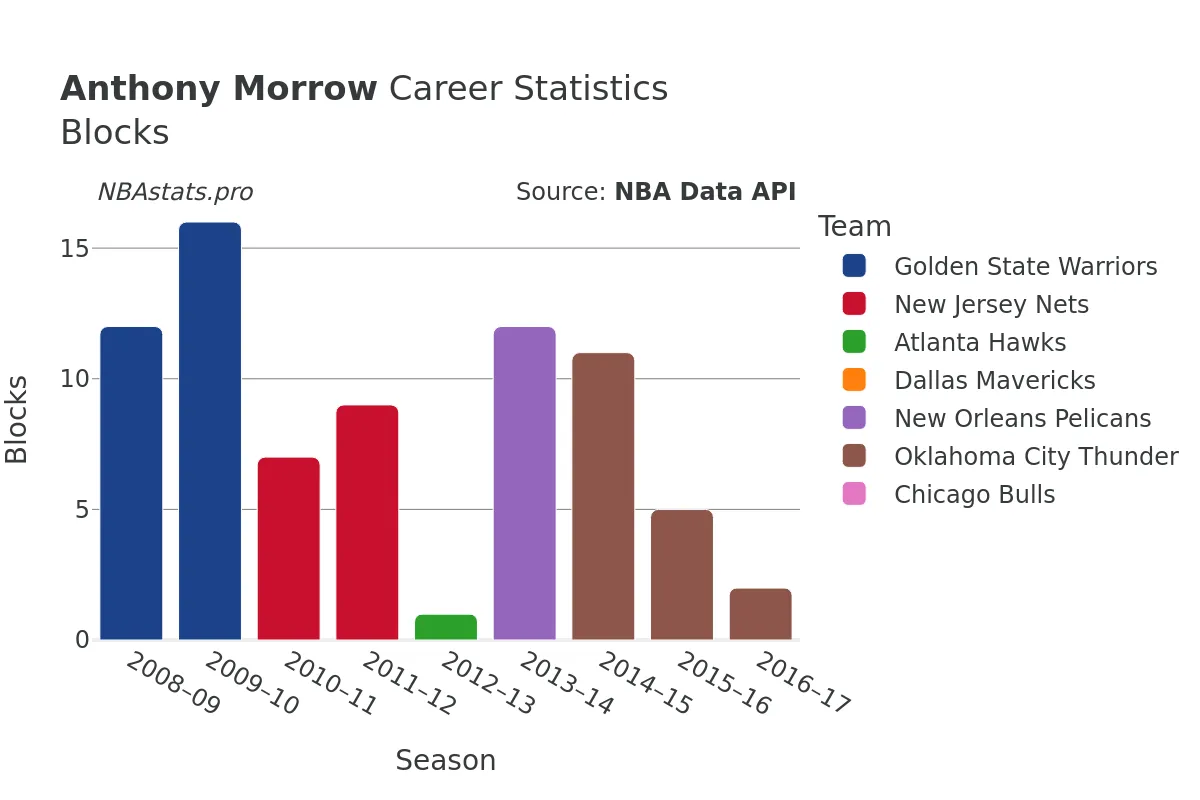
When it came to rebounding, Morrow held his own, with a total of 1,276 rebounds throughout his career. His prowess on the defensive end was particularly notable, with 944 defensive rebounds and 332 offensive rebounds, demonstrating his ability to contribute on both ends of the court. Additionally, Morrow showcased his defensive skills with 354 steals and 78 blocks, proving to be a well-rounded player capable of making an impact on defense as well.
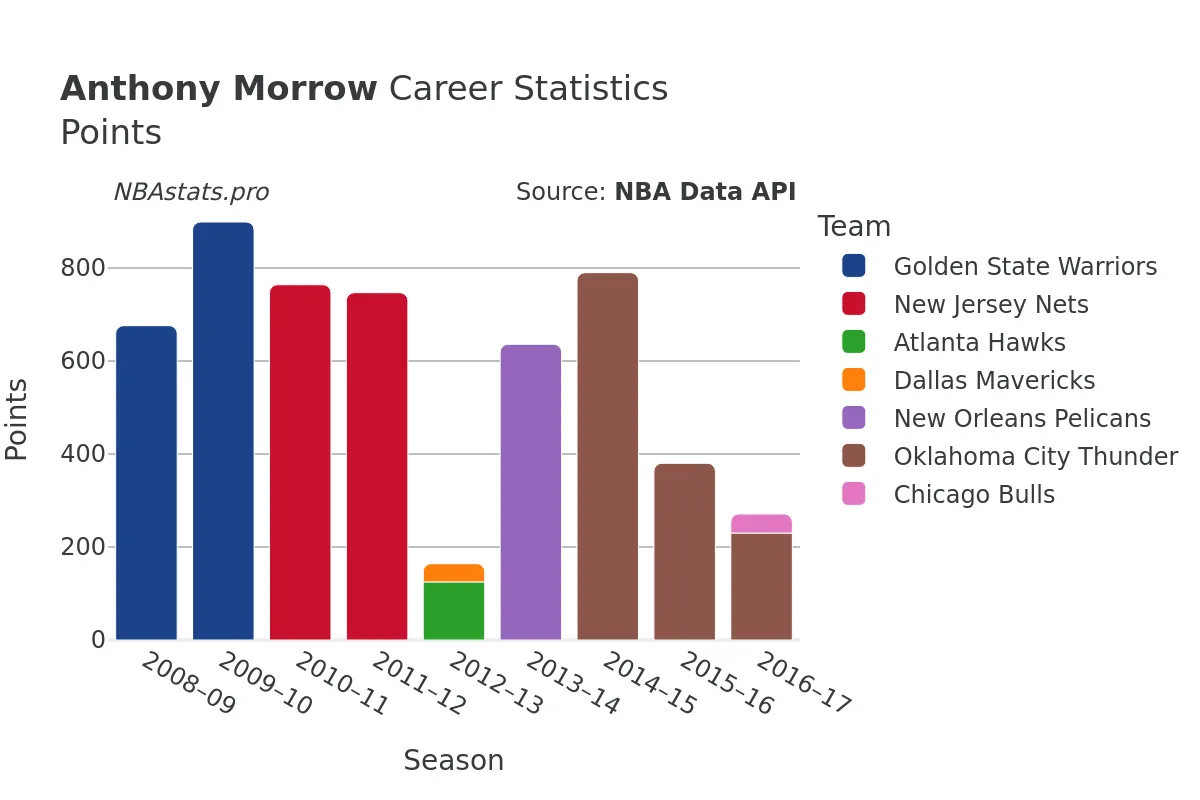
One of Morrow's standout attributes was his scoring ability, as evidenced by his career total of 5,762 points. His knack for putting the ball in the basket, coupled with his efficiency, made him a potent offensive threat on any team he played for. Morrow's scoring proficiency was further highlighted by his consistency from the free-throw line, with an impressive free-throw percentage over his career.
As a player who was always willing to put in the work and make valuable contributions to his team, Morrow earned the respect of fans, teammates, and opponents alike. His dedication to the game and his craft was evident in his performance on the court, making him a valuable asset to any team he played for.
While Anthony Morrow may no longer be active in the NBA, his impact on the league and the teams he played for will not be forgotten. His journey through the NBA, marked by impressive stats and memorable moments, solidified his place as a skilled and respected player in the world of professional basketball. Dive into the charts and statistics of Anthony Morrow's career to further appreciate the legacy of this talented basketball player.
Read more
Games Played
Points
Assists
Rebounds
Steals
Minutes Played
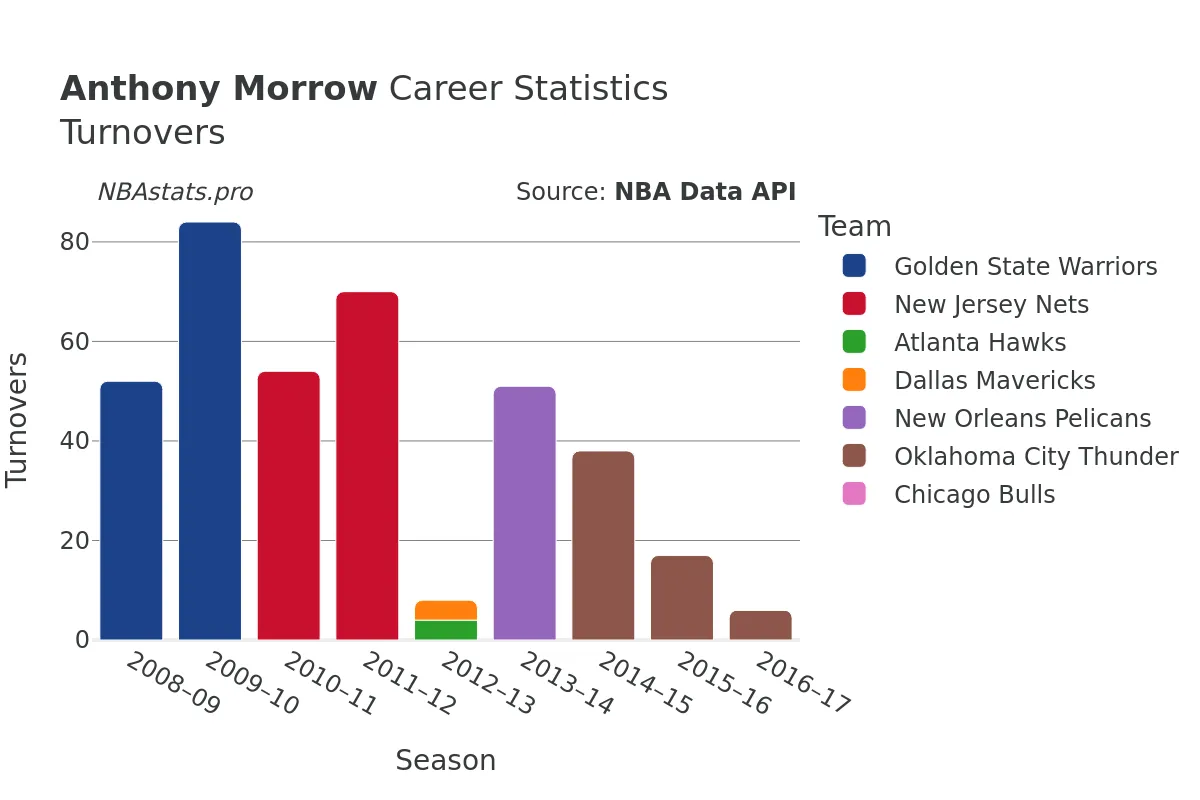
Turnovers
Blocks
Anthony Morrow Career Stats Table
| SEASON | TEAM | AGE | GP | GS | MIN | FGM | FGA | FG % | FG3M | FG3A | FG3 % | FTM | FTA | FT % | OREB | DREB | REB | AST | STL | BLK | TOV | PF | PTS | |
|---|---|---|---|---|---|---|---|---|---|---|---|---|---|---|---|---|---|---|---|---|---|---|---|---|
| 1 | 2008-09 | GSW | 23 | 67 | 17 | 1,515 | 255 | 534 | 47.8% | 86 | 184 | 46.7% | 80 | 92 | 87.0% | 78 | 121 | 199 | 80 | 36 | 12 | 52 | 130 | 676 |
| 2 | 2009-10 | GSW | 24 | 69 | 37 | 2,018 | 329 | 703 | 46.8% | 140 | 307 | 45.6% | 101 | 114 | 88.6% | 61 | 198 | 259 | 104 | 65 | 16 | 84 | 158 | 899 |
| 3 | 2010-11 | NJN | 25 | 58 | 47 | 1,856 | 279 | 620 | 45.0% | 110 | 260 | 42.3% | 96 | 107 | 89.7% | 37 | 135 | 172 | 68 | 19 | 7 | 54 | 135 | 764 |
| 4 | 2011-12 | NJN | 26 | 62 | 18 | 1,636 | 272 | 658 | 41.3% | 106 | 286 | 37.1% | 97 | 104 | 93.3% | 31 | 96 | 127 | 61 | 46 | 9 | 70 | 86 | 747 |
| 5 | 2012-13 | ATL | 27 | 24 | 1 | 301 | 47 | 111 | 42.3% | 15 | 38 | 39.5% | 16 | 18 | 88.9% | 10 | 16 | 26 | 9 | 12 | 1 | 4 | 33 | 125 |
| 6 | 2012-13 | DAL | 27 | 17 | 0 | 82 | 17 | 34 | 50.0% | 1 | 5 | 20.0% | 4 | 4 | 100.0% | 1 | 3 | 4 | 4 | 1 | 0 | 4 | 10 | 39 |
| 7 | 2012-13 | TOT | 27 | 41 | 1 | 383 | 64 | 145 | 44.1% | 16 | 43 | 37.2% | 20 | 22 | 90.9% | 11 | 19 | 30 | 13 | 13 | 1 | 8 | 43 | 164 |
| 8 | 2013-14 | NOP | 28 | 76 | 9 | 1,426 | 238 | 520 | 45.8% | 88 | 195 | 45.1% | 72 | 87 | 82.8% | 29 | 111 | 140 | 59 | 38 | 12 | 51 | 102 | 636 |
| 9 | 2014-15 | OKC | 29 | 74 | 0 | 1,806 | 285 | 615 | 46.3% | 141 | 325 | 43.4% | 79 | 89 | 88.8% | 40 | 155 | 195 | 60 | 54 | 11 | 38 | 135 | 790 |
| 10 | 2015-16 | OKC | 30 | 68 | 6 | 926 | 136 | 333 | 40.8% | 79 | 204 | 38.7% | 29 | 39 | 74.4% | 10 | 52 | 62 | 24 | 22 | 5 | 17 | 64 | 380 |
| 11 | 2016-17 | OKC | 31 | 40 | 7 | 627 | 86 | 223 | 38.6% | 35 | 119 | 29.4% | 23 | 26 | 88.5% | 11 | 18 | 29 | 19 | 22 | 2 | 6 | 40 | 230 |
| 12 | 2016-17 | CHI | 31 | 9 | 0 | 87 | 12 | 29 | 41.4% | 6 | 14 | 42.9% | 11 | 11 | 100.0% | 1 | 1 | 2 | 6 | 2 | 0 | 0 | 4 | 41 |
| 13 | 2016-17 | TOT | 31 | 49 | 7 | 714 | 98 | 252 | 38.9% | 41 | 133 | 30.8% | 34 | 37 | 91.9% | 12 | 19 | 31 | 25 | 24 | 2 | 6 | 44 | 271 |
Max Min
NBA Alltime Leaders
Games Played
Robert Parish: 1,611Kareem Abdul-Jabbar: 1,560
Vince Carter: 1,541
Dirk Nowitzki: 1,522
John Stockton: 1,504
Points
LeBron James: 40,474Kareem Abdul-Jabbar: 38,387
Karl Malone: 36,928
Kobe Bryant: 33,643
Michael Jordan: 32,292
Steals
John Stockton: 3,265Jason Kidd: 2,684
Chris Paul: 2,614
Michael Jordan: 2,514
Gary Payton: 2,445
Free Throws Made
Karl Malone: 9,787Moses Malone: 8,531
LeBron James: 8,390
Kobe Bryant: 8,378
Oscar Robertson: 7,694