Amir Johnson Stats: NBA Career

### Analyzing the Career of Amir Johnson: A Defensive Powerhouse
Amir Johnson, a seasoned veteran of the NBA, has made his presence known on the court through his tenacity, versatility, and defensive prowess. Over the course of his 14-year career, Johnson has donned the jerseys of the Detroit Pistons, Toronto Raptors, Boston Celtics, and Philadelphia 76ers, leaving his mark on each team and city he represented.
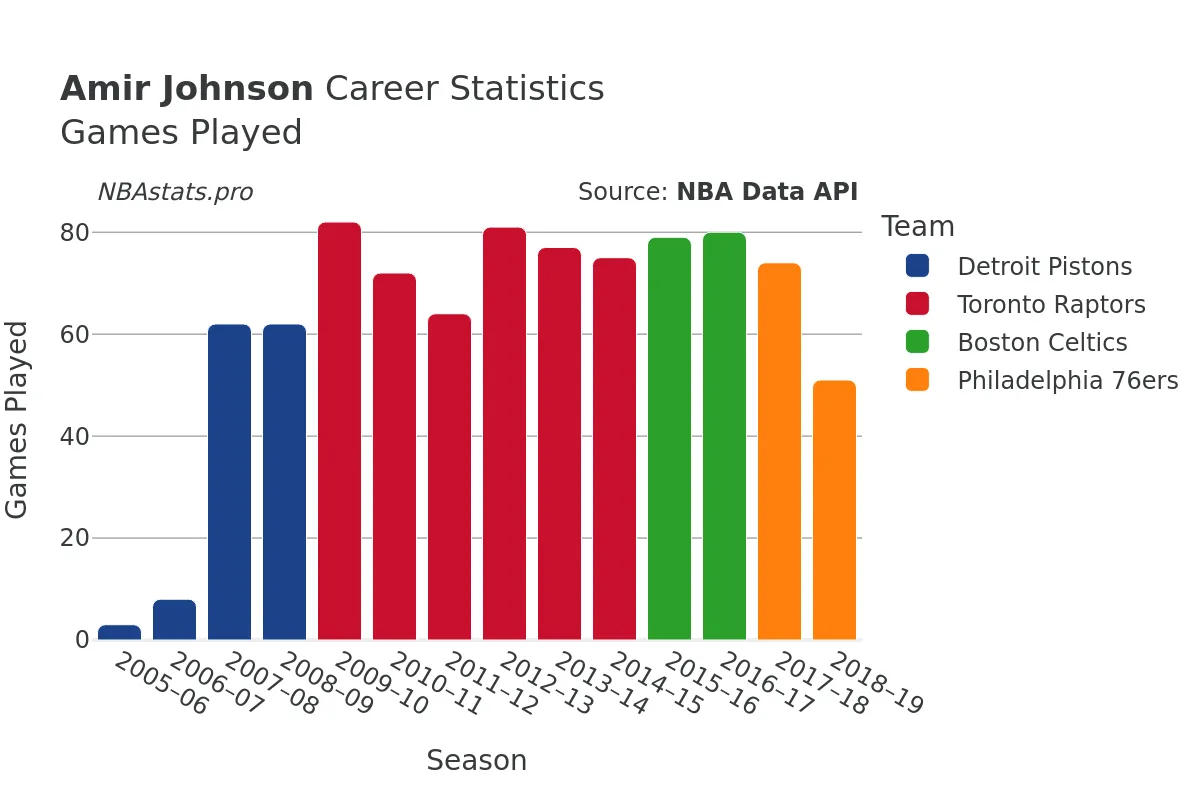
Johnson's journey in the NBA began in the 2005-06 season when he entered the league... at the young age of 19 with the Detroit Pistons. Throughout his career, he exhibited durability and consistency, appearing in a total of 870 games and logging 18,322 minutes on the court. His offensive capabilities were highlighted by his 2,558 field goals made out of 4,490 attempts, boasting an impressive shooting percentage of 56.97%.
A key aspect of Johnson's game was his ability to draw fouls and capitalize from the free-throw line. With 1,307 attempts, he converted 879 free throws, showcasing efficiency and composure in crucial moments. His free-throw percentage remained solid throughout his career, underscoring his reliability in pressure situations.
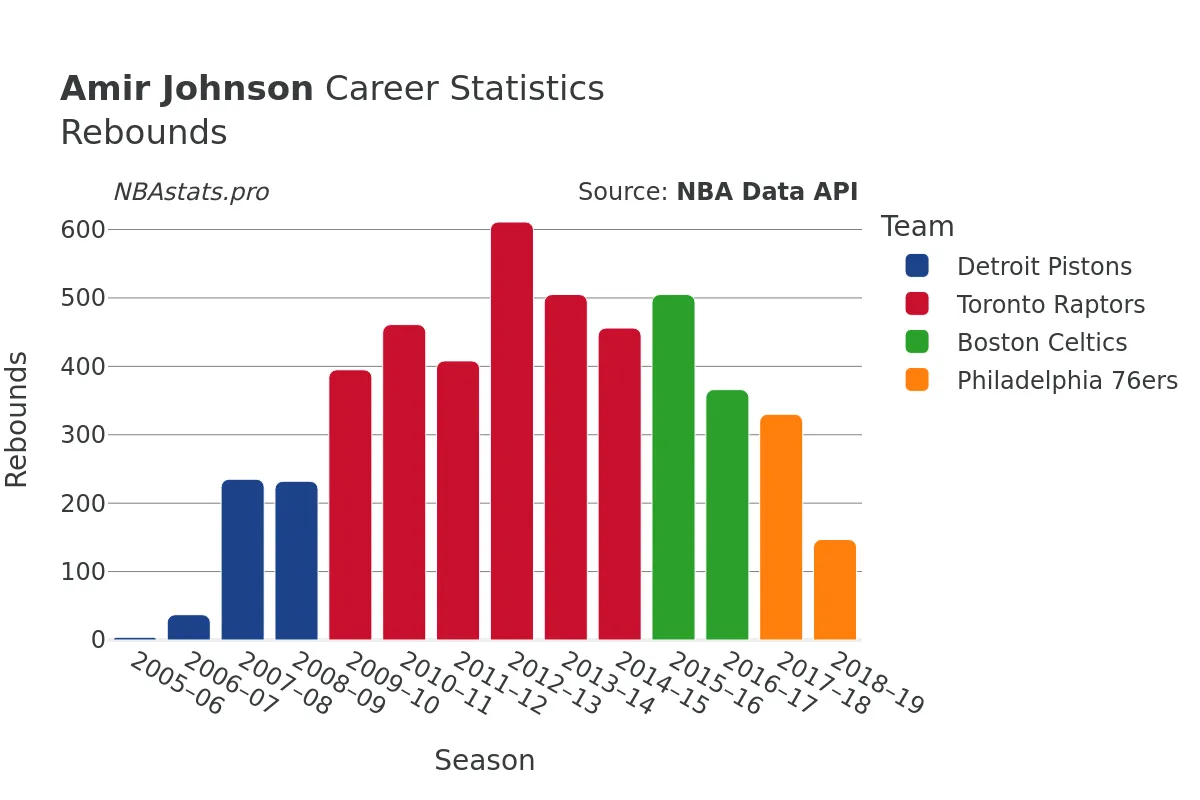
While Johnson's offensive contributions were significant, his impact on the boards and defensive end truly set him apart as a player. A dominant force in the paint, he accumulated a total of 4,692 rebounds, with 2,969 coming on the defensive end and 1,723 on the offensive glass. His tenacious rebounding and shot-blocking abilities were instrumental in controlling the paint and limiting opponents' scoring opportunities.
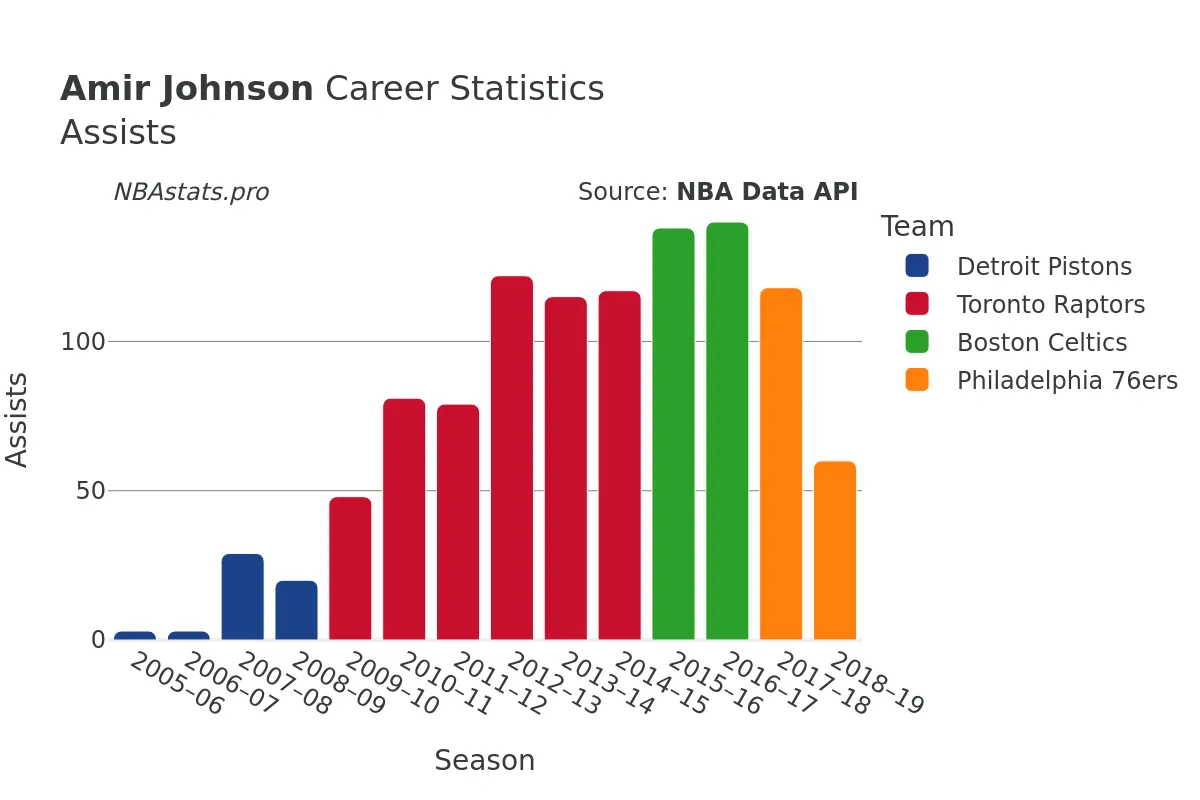
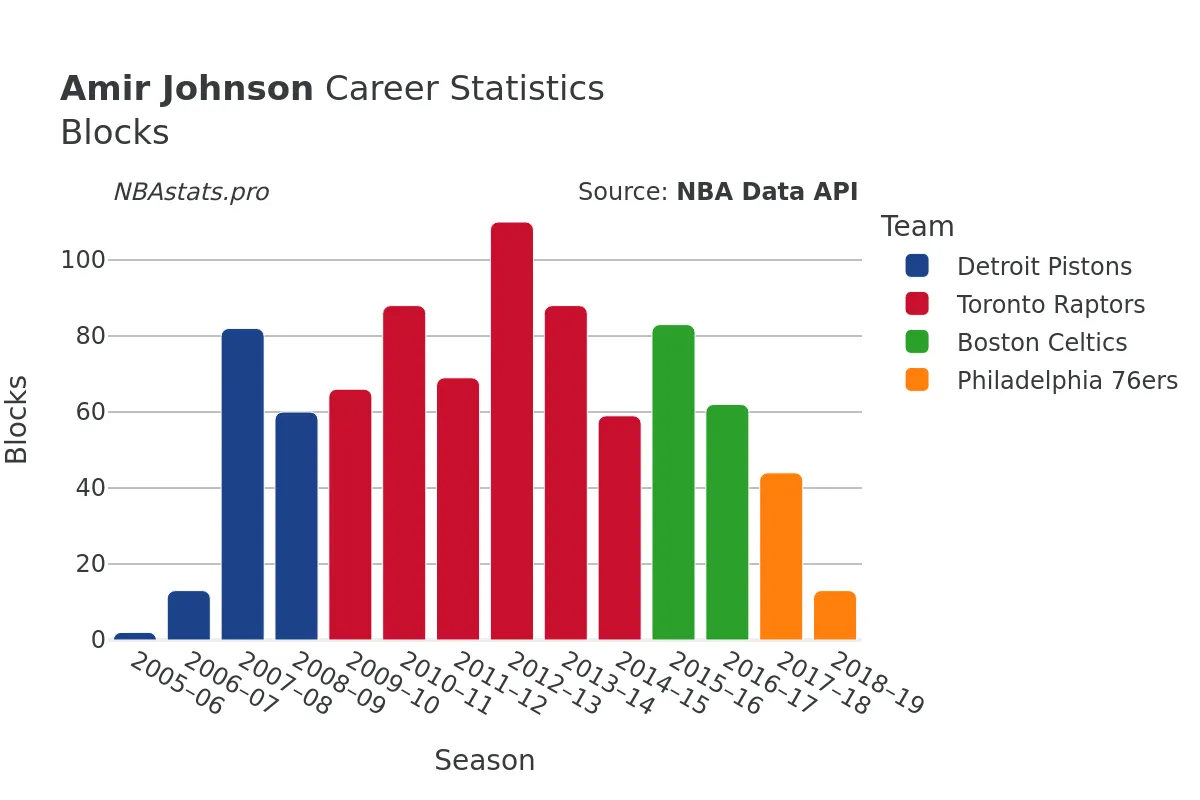
In addition to his rebounding prowess, Johnson showcased his playmaking skills with 1,073 assists, facilitating ball movement and creating scoring opportunities for his teammates. His defensive instincts were further highlighted by his 524 steals and an impressive 839 blocks, demonstrating his ability to disrupt opposing offenses and protect the rim with authority.
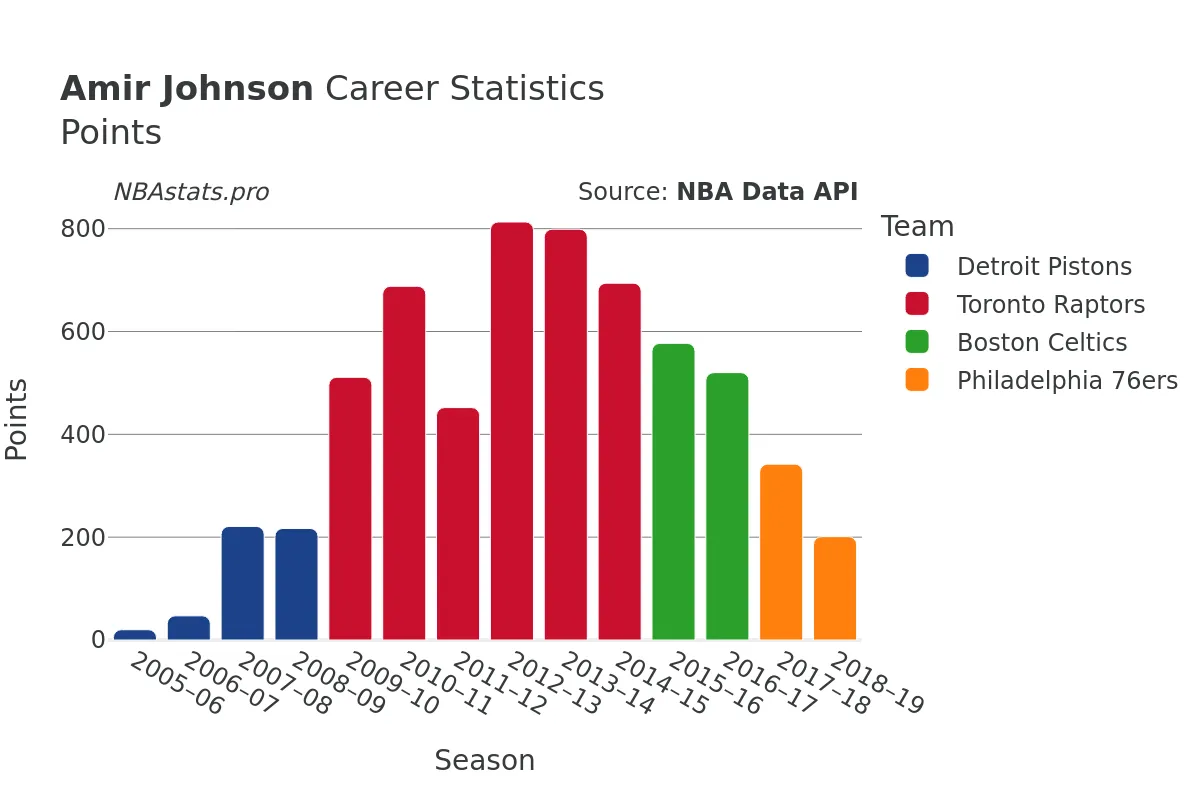
Over the course of his career, Johnson compiled a total of 6,102 points, showcasing his versatility as a two-way player capable of making an impact on both ends of the floor. His contributions went beyond traditional statistical categories, as his leadership, work ethic, and defensive intensity left a lasting impression on the teams and cities he represented.
As we delve deeper into the stats and charts of Amir Johnson's career, we uncover the intricacies and nuances of his playing style, his impact on the game, and the defining moments that shaped his legacy in the NBA. Join us as we unravel the career of this defensive powerhouse and gain a deeper understanding of the skills and attributes that made him a valuable asset to multiple NBA teams throughout his illustrious career.
Read more
Games Played
Points
Assists
Rebounds
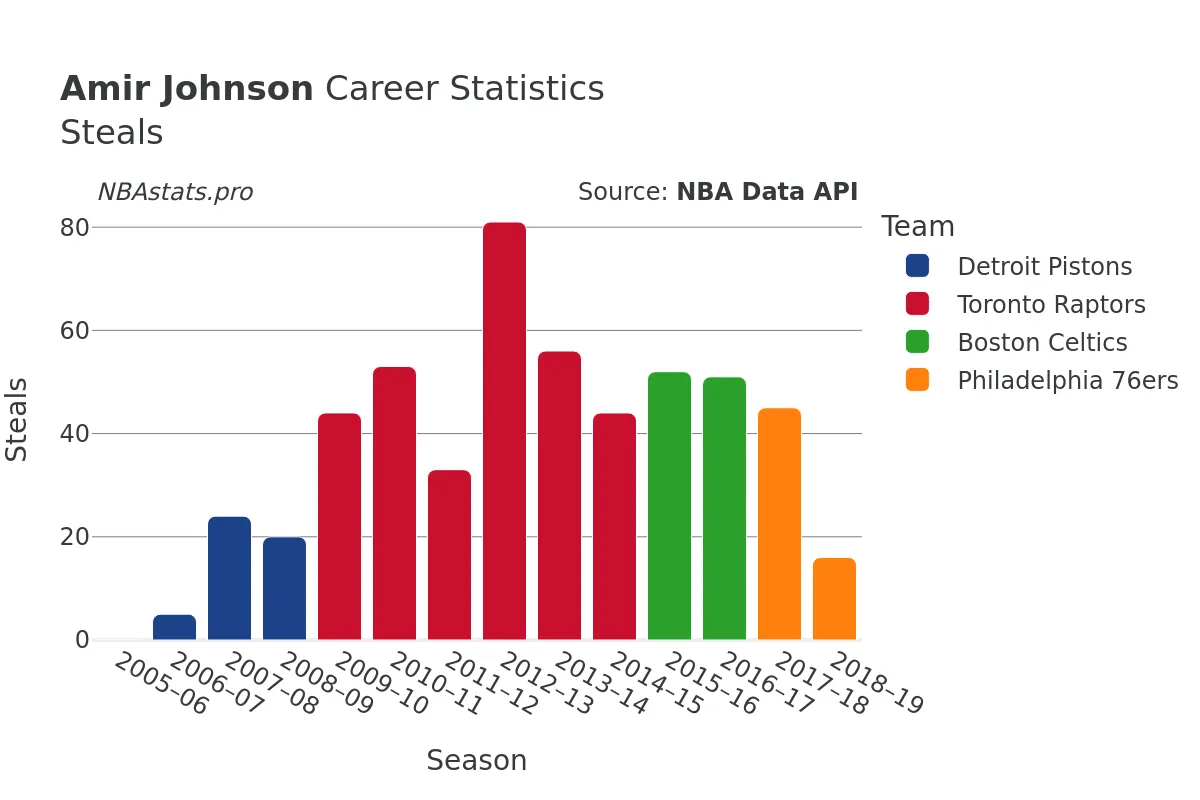
Steals
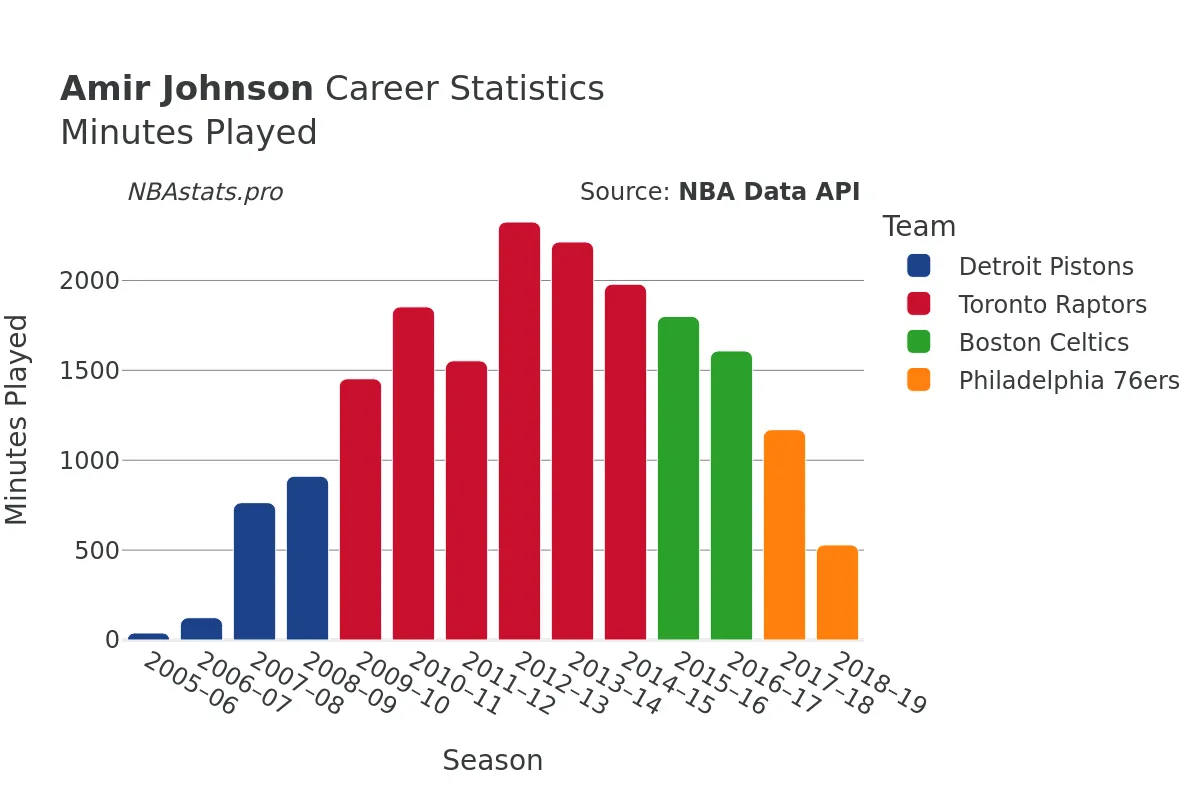
Minutes Played
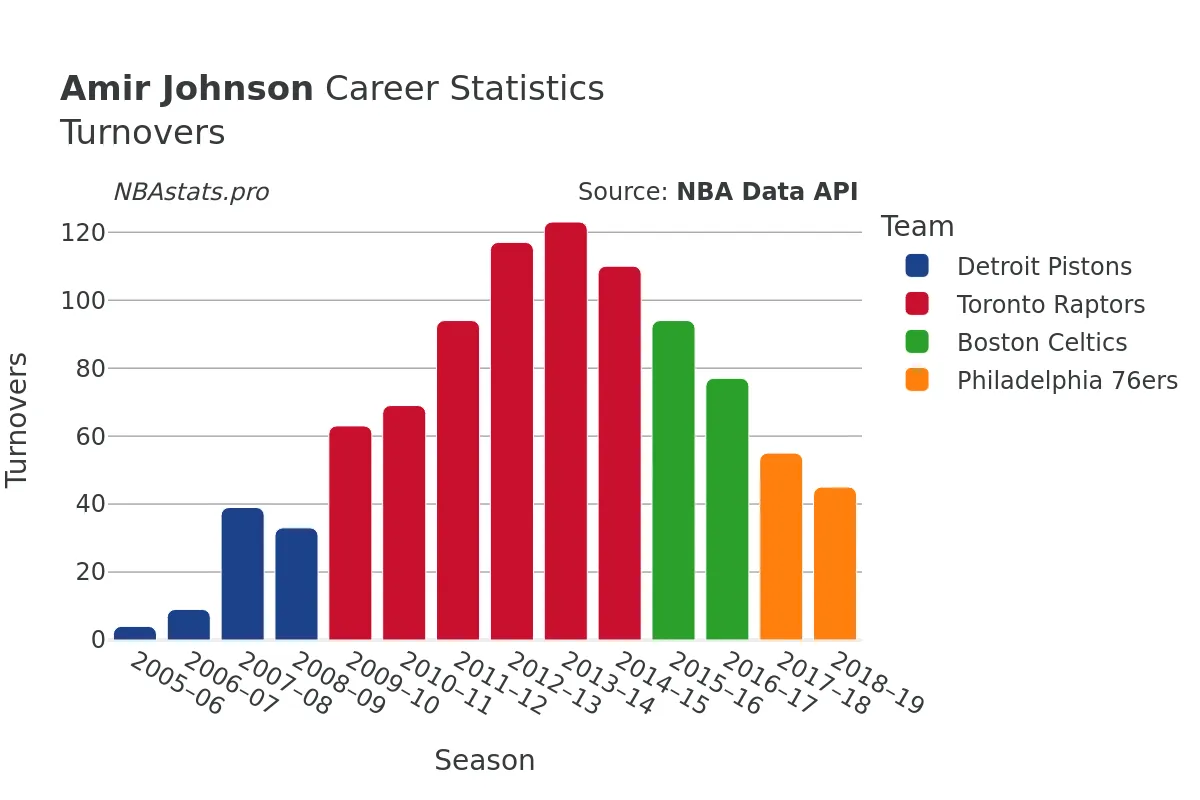
Turnovers
Blocks
Amir Johnson Career Stats Table
| SEASON | TEAM | AGE | GP | GS | MIN | FGM | FGA | FG % | FG3M | FG3A | FG3 % | FTM | FTA | FT % | OREB | DREB | REB | AST | STL | BLK | TOV | PF | PTS | |
|---|---|---|---|---|---|---|---|---|---|---|---|---|---|---|---|---|---|---|---|---|---|---|---|---|
| 1 | 2005-06 | DET | 19 | 3 | 0 | 39 | 7 | 10 | 70.0% | 2 | 3 | 66.7% | 4 | 4 | 100.0% | 3 | 1 | 4 | 3 | 0 | 2 | 4 | 7 | 20 |
| 2 | 2006-07 | DET | 20 | 8 | 0 | 124 | 18 | 33 | 54.5% | 0 | 3 | 0.0% | 11 | 14 | 78.6% | 15 | 22 | 37 | 3 | 5 | 13 | 9 | 19 | 47 |
| 3 | 2007-08 | DET | 21 | 62 | 0 | 764 | 92 | 165 | 55.8% | 0 | 0 | 0.0% | 37 | 55 | 67.3% | 87 | 148 | 235 | 29 | 24 | 82 | 39 | 141 | 221 |
| 4 | 2008-09 | DET | 22 | 62 | 24 | 911 | 97 | 163 | 59.5% | 0 | 0 | 0.0% | 23 | 35 | 65.7% | 102 | 130 | 232 | 20 | 20 | 60 | 33 | 171 | 217 |
| 5 | 2009-10 | TOR | 23 | 82 | 5 | 1,453 | 208 | 334 | 62.3% | 0 | 4 | 0.0% | 95 | 149 | 63.8% | 154 | 241 | 395 | 48 | 44 | 66 | 63 | 255 | 511 |
| 6 | 2010-11 | TOR | 24 | 72 | 54 | 1,853 | 281 | 495 | 56.8% | 0 | 1 | 0.0% | 126 | 160 | 78.8% | 189 | 272 | 461 | 81 | 53 | 88 | 69 | 263 | 688 |
| 7 | 2011-12 | TOR | 25 | 64 | 43 | 1,553 | 196 | 340 | 57.6% | 2 | 5 | 40.0% | 58 | 84 | 69.0% | 149 | 259 | 408 | 79 | 33 | 69 | 94 | 209 | 452 |
| 8 | 2012-13 | TOR | 26 | 81 | 38 | 2,325 | 336 | 606 | 55.4% | 5 | 13 | 38.5% | 136 | 187 | 72.7% | 227 | 384 | 611 | 122 | 81 | 110 | 117 | 301 | 813 |
| 9 | 2013-14 | TOR | 27 | 77 | 72 | 2,214 | 344 | 612 | 56.2% | 20 | 66 | 30.3% | 91 | 143 | 63.6% | 172 | 333 | 505 | 115 | 56 | 88 | 123 | 271 | 799 |
| 10 | 2014-15 | TOR | 28 | 75 | 72 | 1,979 | 298 | 519 | 57.4% | 19 | 46 | 41.3% | 79 | 129 | 61.2% | 159 | 297 | 456 | 117 | 44 | 59 | 110 | 225 | 694 |
| 11 | 2015-16 | BOS | 29 | 79 | 76 | 1,800 | 249 | 426 | 58.5% | 10 | 43 | 23.3% | 69 | 121 | 57.0% | 178 | 327 | 505 | 138 | 52 | 83 | 94 | 214 | 577 |
| 12 | 2016-17 | BOS | 30 | 80 | 77 | 1,608 | 213 | 370 | 57.6% | 27 | 66 | 40.9% | 67 | 100 | 67.0% | 118 | 248 | 366 | 140 | 51 | 62 | 77 | 211 | 520 |
| 13 | 2017-18 | PHI | 31 | 74 | 18 | 1,170 | 140 | 260 | 53.8% | 10 | 32 | 31.3% | 52 | 85 | 61.2% | 123 | 207 | 330 | 118 | 45 | 44 | 55 | 192 | 342 |
| 14 | 2018-19 | PHI | 32 | 51 | 6 | 529 | 79 | 157 | 50.3% | 12 | 40 | 30.0% | 31 | 41 | 75.6% | 47 | 100 | 147 | 60 | 16 | 13 | 45 | 99 | 201 |
Max Min
NBA Alltime Leaders
Games Played
Robert Parish: 1,611Kareem Abdul-Jabbar: 1,560
Vince Carter: 1,541
Dirk Nowitzki: 1,522
John Stockton: 1,504
Points
LeBron James: 40,474Kareem Abdul-Jabbar: 38,387
Karl Malone: 36,928
Kobe Bryant: 33,643
Michael Jordan: 32,292
Steals
John Stockton: 3,265Jason Kidd: 2,684
Chris Paul: 2,614
Michael Jordan: 2,514
Gary Payton: 2,445
Free Throws Made
Karl Malone: 9,787Moses Malone: 8,531
LeBron James: 8,390
Kobe Bryant: 8,378
Oscar Robertson: 7,694